Ivanhoe Mines' reports Q3 2025 profit of $31M and adjusted EBITDA of $87M, including $76M of attributable EBITDA from Kamoa-Kakula
Stage Two dewatering of Kakula Mine advancing towards completion in early December; head grades to improve in Q4 2025 as higher-grade mining areas are reopened
Updated life-of-mine integrated development plan well underway for Q1 2026; targeting return of annualized copper production to over 550,000 tonnes
Africa's largest and greenest copper smelter to start up in the coming weeks
Commissioning 178-megawatt Turbine #5 at Inga II complete; initial additional 50 megawatts of hydropower supplied to Kamoa-Kakula from November
First feed of platinum-palladium-nickel-rhodium-copper-gold ore into the Platreef Phase 1 concentrator recently took place; first concentrate expected in coming weeks
Engineering contractor appointed for Phase 2 expansion of the Platreef Mine; earthworks to commence in Q1 2026
Kipushi produced a record 57,200 tonnes of zinc in Q3 2026; reaching annualized production rates of up to 315,000 tonnes of zinc in concentrate
Ivanhoe Mines' balance sheet strengthened by $500 million strategic private placement with Qatar Investment Authority
Johannesburg, South Africa--(Newsfile Corp. - October 29, 2025) - Ivanhoe Mines' (TSX: IVN) (OTCQX: IVPAF) President and Chief Executive Officer, Marna Cloete, and Chief Financial Officer David van Heerden today announce the company's financial results for the third quarter of 2025, as well as an operations and project development update.
Ivanhoe Mines is a leading Canadian mining company with three principal tier-one mining operations in Southern Africa. The company is primarily focused on operations at the Kamoa-Kakula Copper Complex in the Democratic Republic of the Congo (DRC); the ultra-high-grade Kipushi zinc-copper-lead-germanium mine in the DRC; and the ramping up of the Platreef platinum, palladium, rhodium, nickel, gold, and copper mine in South Africa.
In addition, Ivanhoe Mines is expanding the Makoko District copper discovery in the Western Forelands, as well as exploring for new sedimentary-hosted copper discoveries across its expansive and highly prospective exploration licence packages across the DRC, Angola, Zambia, and Kazakhstan. All figures are in U.S. dollars unless otherwise stated.
Founder and Co-Chairman Robert Friedland commented:
"At Kamoa-Kakula, our teams continue to work around the clock to complete the Stage Two dewatering. As this critical work is completed, underground workings and infrastructure are systematically inspected and rehabilitated to prepare for the resumption of mining activities in higher-grade areas.
"Meanwhile the engineering team of Kamoa Copper, together with Ivanhoe and Zijin, is working alongside world leading geotechnical experts to determine a conservative and responsible plan to increase mining rates from underground to fill our concentrators. We expect production to continue to rise over coming months and quarters, ultimately targeting over 550,000 tonnes of copper per year, reaffirming Kamoa-Kakula's position among the world's most essential and lowest-carbon copper producers.
"After almost thirty years of hard work, vision, and perseverance, the Platreef Mine has come to life. Today, as the first feed of ore entered the concentrator, a dream that began as a drill hole in the Limpopo dust in the last century is now a living, breathing mine. Platreef will prosper for generations to come as one of the lowest-cost and largest sources of platinum, palladium, rhodium, nickel, copper, and gold. We are incredibly proud of the thousands of dedicated, hard-working men and women who have made this dream a reality so far… but, we are only just getting started… the Phase 1 mine is just a baby first step to an operation that we'll be making 10 times larger, over two further phases of expansion.
"Meanwhile, Kipushi's rebirth as one of the world's great zinc mines is now complete - the debottlenecking program has elevated it to the ranks of the globe's top producers. Very soon, with copper from Kamoa-Kakula; zinc, copper, germanium, gallium and silver from Kipushi; as well as platinum, palladium, rhodium, nickel, copper, and gold from Platreef, Ivanhoe Mines stands on the threshold of becoming one of the largest and most significant producers of these critical metals to power our planet's future."
FINANCIAL HIGHLIGHTS
- Ivanhoe Mines' Q3 2025 adjusted EBITDA was $87 million, compared with $123 million for Q2 2025, which includes an attributable share of EBITDA from Kamoa-Kakula of $76 million. Ivanhoe Mines recorded a profit after tax of $31 million for Q3 2025, compared to $108 million for the same period in 2024 and $35 million in Q2 2025.
- Kamoa-Kakula sold 61,528 tonnes of copper (net of payability) during the third quarter at an average realized copper price of $4.42/lb., compared with 101,714 tonnes in Q2 2025 at an average realized copper price of $4.34/lb. At the end of the third quarter, there were approximately 59,000 tonnes of unsold copper in inventory, up from approximately 53,600 tonnes at the end of Q2 2025. Inventory levels expected to normalize to approximately 17,000 tonnes as smelter ramp-up advances.
- Kamoa-Kakula recognized revenue of $566 million, an operating profit of $69 million, and EBITDA of $196 million for the quarter, equivalent to an EBITDA margin of 35%. This compares with Q2 2025 EBITDA of $325 million.
- Kamoa-Kakula's cost of sales per pound (lb.) of payable copper sold was $3.23/lb. for the third quarter, compared with $2.85/lb. in Q2 2025. Cash cost (C1) per pound of payable copper produced in the quarter averaged $2.62/lb., compared with $1.89/lb. in Q2 2025. Year-to-date cash cost (C1) averaged $1.97 /lb. and is on track to meet full year guidance of $1.90 to $2.20/lb. The higher cash costs during the quarter were primarily due to the processing of lower-grade ore and lower recoveries.
- Kamoa-Kakula's 2025 capital expenditure guidance range of $1,420 million to $1,600 million has been lowered by $100 million to a range of $1,320 million to $1,500 million, with $910 million spent year to date. In addition, the 2026 capital expenditure guidance has been raised by $100 million from a range of $700 million to $1,200 million, to a range of $800 million to $1,300 million.
- Kamoa Copper concluded a 2-year term facility of $500 million during the quarter, of which $370 million was drawn in early October 2025.
- Kipushi sold a record 49,744 tonnes of zinc (net of payability) during the quarter, at an average realized zinc price of $1.27/lb., compared with 43,348 tonnes in Q2 2025 at an average realized zinc price of $1.23/lb.
- Kipushi recognized a record quarterly revenue of $129 million, a segmented profit of $8 million, and EBITDA of $27 million for the quarter, equivalent to an EBITDA margin of 21%. This compares with an EBITDA of $9 million and an EBITDA margin of 10% in Q2 2025.
- Kipushi's cost of sales per pound (lb.) of payable zinc sold was $1.11/lb. and the cash cost (C1) per pound of payable zinc sold totaled $0.95/lb.
- Kipushi Mine's cash costs (C1) for the nine months ended September 30, 2025, averaged $0.95/lb. of payable zinc sold, at the mid-point of the 2025 guidance range of $0.90/lb. to $1.00/lb. of payable zinc sold.
- Platreef capital expenditure is tracking at the lower end of 2025 guidance of $250 to $280 million, with $174 million spent year to date. Negotiations are progressing well for a $700 million Phase 2 senior project finance facility, which is expected to close in Q1 2026.
- Ivanhoe Mines completed a private placement with Qatar Investment Authority during the third quarter, yielding gross proceeds of $500 million. A further $70 million in proceeds were received from Zijin following the exercise of its anti-dilution rights.
- Ivanhoe Mines had cash and cash equivalents on hand of $1,056 million as of September 30, 2025.
OPERATIONAL HIGHLIGHTS
- Quarterly copper production remained impacted by recovery efforts following seismic activity on the eastern side of the Kakula Mine, as reported on May 20, 2025.
- During the third quarter of 2025, the Phase 1, 2, and 3 concentrators milled a total of 3.46 million tonnes of ore, producing 71,226 tonnes of copper. Copper production for the first nine months of 2025 totaled 316,393 tonnes. 2025 copper production guidance of 370,000 to 420,000 tonnes is maintained.
- The Phase 3 concentrator milled 1.62 million tonnes of ore in the third quarter, producing 33,522 tonnes of copper. For a second consecutive quarter, the Phase 3 concentrator averaged a milling rate equivalent to 6.5 million tonnes per annum, which is 30% higher than its design capacity of 5.0 million tonnes per annum. The average quarterly feed grade for the Phase 3 concentrator was 2.44% copper.
- Stage Two dewatering of the Kakula Mine is approximately 35% complete and is expected to be completed in early December 2025, at which point the underground water level is anticipated to be near the bottom of the Stage Two dewatering shafts. The central infrastructure enabling underground access between the north and south declines is expected to be dewatered in the coming week.
- The four Stage Two high-capacity submersible pumps were commissioned over the course of two weeks between the end of August and mid-September. The four pumps are operating at the total design rate of approximately 2,600 litres per second. Including the mobile Stage One pump stations located underground, the total potential pumping rate at the Kakula Mine is 6,400 litres per second, or 550 megalitres per day, subject to available underground access.
- To date, approximately 13 kilometres of lateral development have been rehabilitated. As the water level declines, the mining crews are primarily focused on rehabilitating the access drives required to reposition the Stage One underground pumping infrastructure, as well as the access to the Stage Three pump stations, which are currently submerged. The mining crews expect to start gaining access to the existing Stage Three pumping infrastructure in November.
- Work is well underway on an updated life-of-mine integrated development plan. The plan includes a full review of both the Kakula and Kamoa mine plans, with the target of increasing mining rates up to 17 million tonnes per year, prior to the Phase 4 expansion. The review includes updates to several technical assumptions, which continue to evolve as the dewatering advances, supported by several industry experts and qualified persons (QPs) engaged by Kamoa Copper since the seismic activity occurred. Completion of the life-of-mine integrated development plan is targeted by the end of Q1 2026.
- Production rates are expected to steadily improve once the Kakula Mine is dewatered, with annualized copper production returning to over 550,000 tonnes over the medium term. Ivanhoe Mines also plans to provide, by the latest in Q1 2026, an update on Kamoa-Kakula's medium-term production guidance and recovery plan.
- Kamoa-Kakula's 500,000-tonne-per-annum on-site, direct-to-blister copper smelter, the largest in Africa, is expected to commence start-up in the coming weeks. Installation of the 60-megawatt (MW) uninterruptible power supply (UPS) system is nearing completion and will sustain smelter operations during periods of grid instability. The majority of concentrates produced by Phase 1, 2, and 3 concentrators are expected to be smelted on-site, resulting in significant cost savings on logistics costs, as well as by-product credits from sulphuric acid sales.
- Construction of Kamoa-Kakula's on-site solar (PV) facilities, with battery storage, is well advanced. The two sites, with a combined capacity of 60 MW, are 42% and 46% complete, and are expected to be operational from Q2 2026.
- Commissioning of the Inga II hydroelectric dam's 178-MW Turbine #5 was completed with energization, grid synchronization, and testing started on October 1, 2025. The Kamoa Copper Complex expects to receive an initial additional 50 MW of power from November 2025, ramping up to 150 MW over time as transmission improvement initiatives are completed.
- At Kipushi, the concentrator milled a record 168,862 tonnes of ore at a record average grade of 37.8% zinc during the third quarter, producing a record 57,200 tonnes of zinc in concentrate at a contained grade of over 51% zinc.
- Total year-to-date production from the Kipushi concentrator is 141,724 tonnes of zinc in concentrate. Following improved production rates from the debottlenecking program completed in August, Kipushi is well on track to meet its 2025 production guidance range of 180,000 and 240,000 tonnes of zinc.
- The debottlenecking program was delivered ahead of schedule and on budget in August, with an industry-leading safety record. Throughout both the construction of the Kipushi concentrator, which started in September 2022 and was completed in June 2024, and the recently completed debottlenecking program, the project team at Kipushi did not record a single lost time injury (LTI). This is an outstanding and incredibly rare industry achievement.
- Multiple concentrator records were achieved at Kipushi since the completion of the debottlenecking program. A record 6,064 tonnes of zinc in concentrate were produced over seven days in late August, equivalent to an annual production rate of over 315,000 tonnes of zinc, after accounting for availability. Sustaining this production rate would make the Kipushi Mine the world's third-largest zinc mining operation.
- An additional six megawatts of back-up generator capacity are in the process of being installed at Kipushi. The new generators will increase the total onsite back-up power to 20 MW, sufficient to maintain operational continuity during periods of grid instability.
- At the Platreef Mine, the first feed of platinum-palladium-nickel-rhodium-copper-gold ore into the Phase 1 concentrator took place on October 29, 2025. This event marks the final stage of the concentrator's hot commissioning. The first production of concentrate is expected in mid-to-late November. Phase 1 is the first step in a three-phase expansion plan that aims to make the Platreef Mine one of the world's largest and lowest-cost producers of platinum, palladium, rhodium, and gold, with copper and nickel byproduct credits.
- Development ore will initially be fed into the Phase 1 concentrator until the new Shaft #3 is commissioned and is ready to hoist in March 2026. Thereafter, long hole stoping (production mining) of the Flatreef orebody is expected to commence in early Q2 2026.
- Platreef's project team has already commenced work on the development of Phase 2, targeting first production in Q4 2027. Phase 2 production is expected to be more than four times larger than Phase 1, producing approximately 450,000 ounces of platinum, palladium, rhodium, and gold (3PE + Au), plus approximately 9,000 tonnes of nickel and 6,000 tonnes of copper from Q4 2027.
- The engineering, procurement, and construction management (EPCM) contractor for the Phase 2 concentrator and mining has been appointed. Earthworks on the 3.3-million-tonne-per-annum Phase 2 concentrator site, located adjacent to the Phase 1 concentrator, and associated infrastructure are scheduled to commence in Q1 2026.
- The Platreef Mine is projected to be the lowest-cost primary platinum-group-metals producer globally. The Phase 2 life-of-mine total cash cost is estimated to be $599 per ounce of 3PE + Au, net of nickel and copper by-product credits. This compares very favourably with a basket spot price of approximately $1,900 per ounce of 3PE + Au, as at October 24, 2025.
- In the Western Forelands, Ivanhoe continues exploration across its vast licence area, adjacent to Kamoa-Kakula. Drilling efforts during the third quarter focused on the Makoko District, as well as the new target areas of Tshipaya and Kamilli. Drilling to the east of the Makoko District has identified an extension of mineralization that will continue to be tested for continuity during the fourth quarter. Preparations have been made to continue throughout the wet season, which is expected to commence imminently. An updated Mineral Resource for the Makoko District is planned for 2026.
- In Kazakhstan, drilling commenced in July on Ivanhoe's joint venture licences. Two rigs have been deployed for a 17,500-metre diamond drilling program, with two holes completed to date. Concurrent with the drilling program, extensive geophysical and geochemical programs are underway across the licence package.
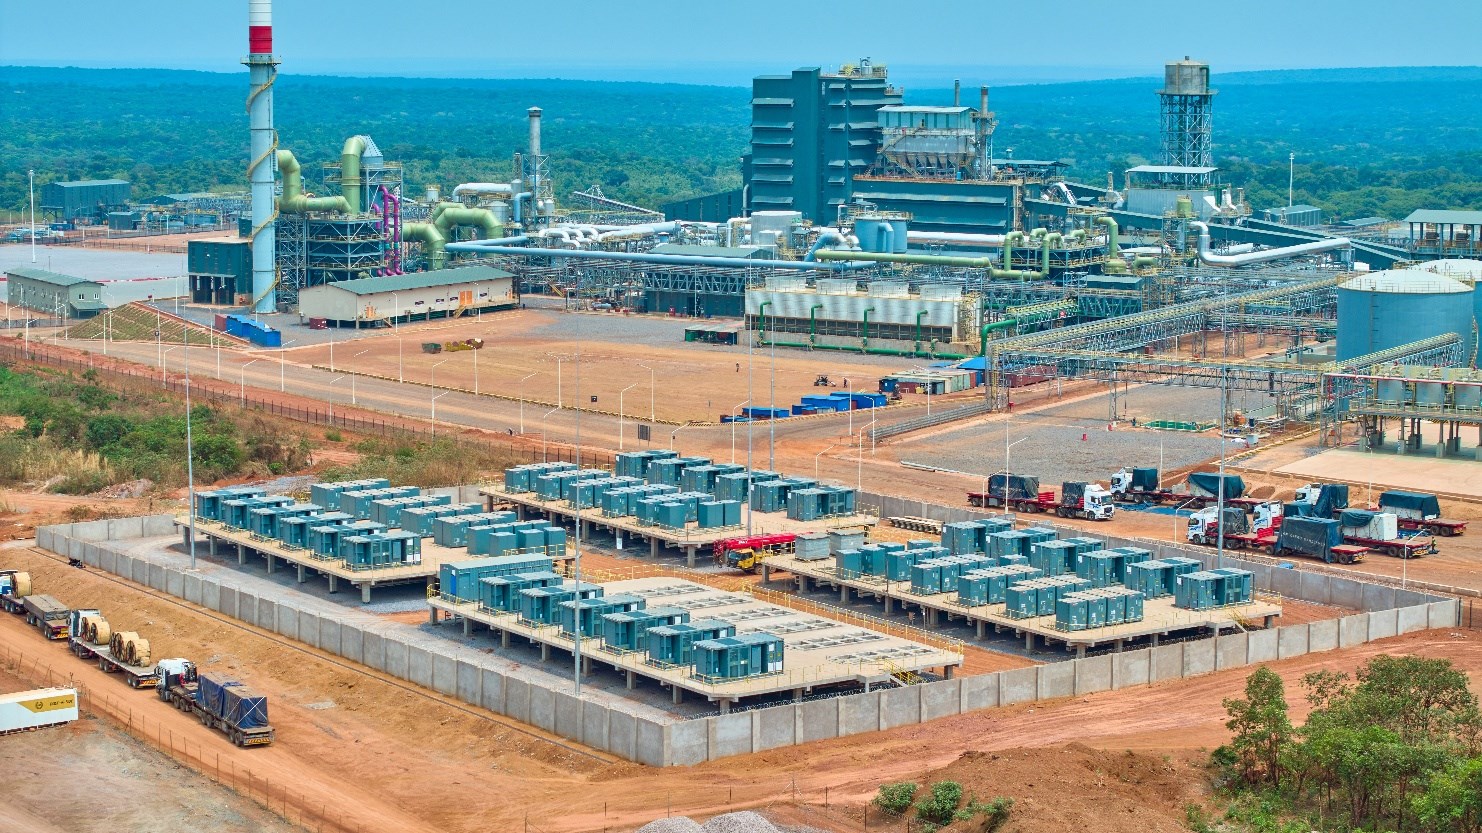
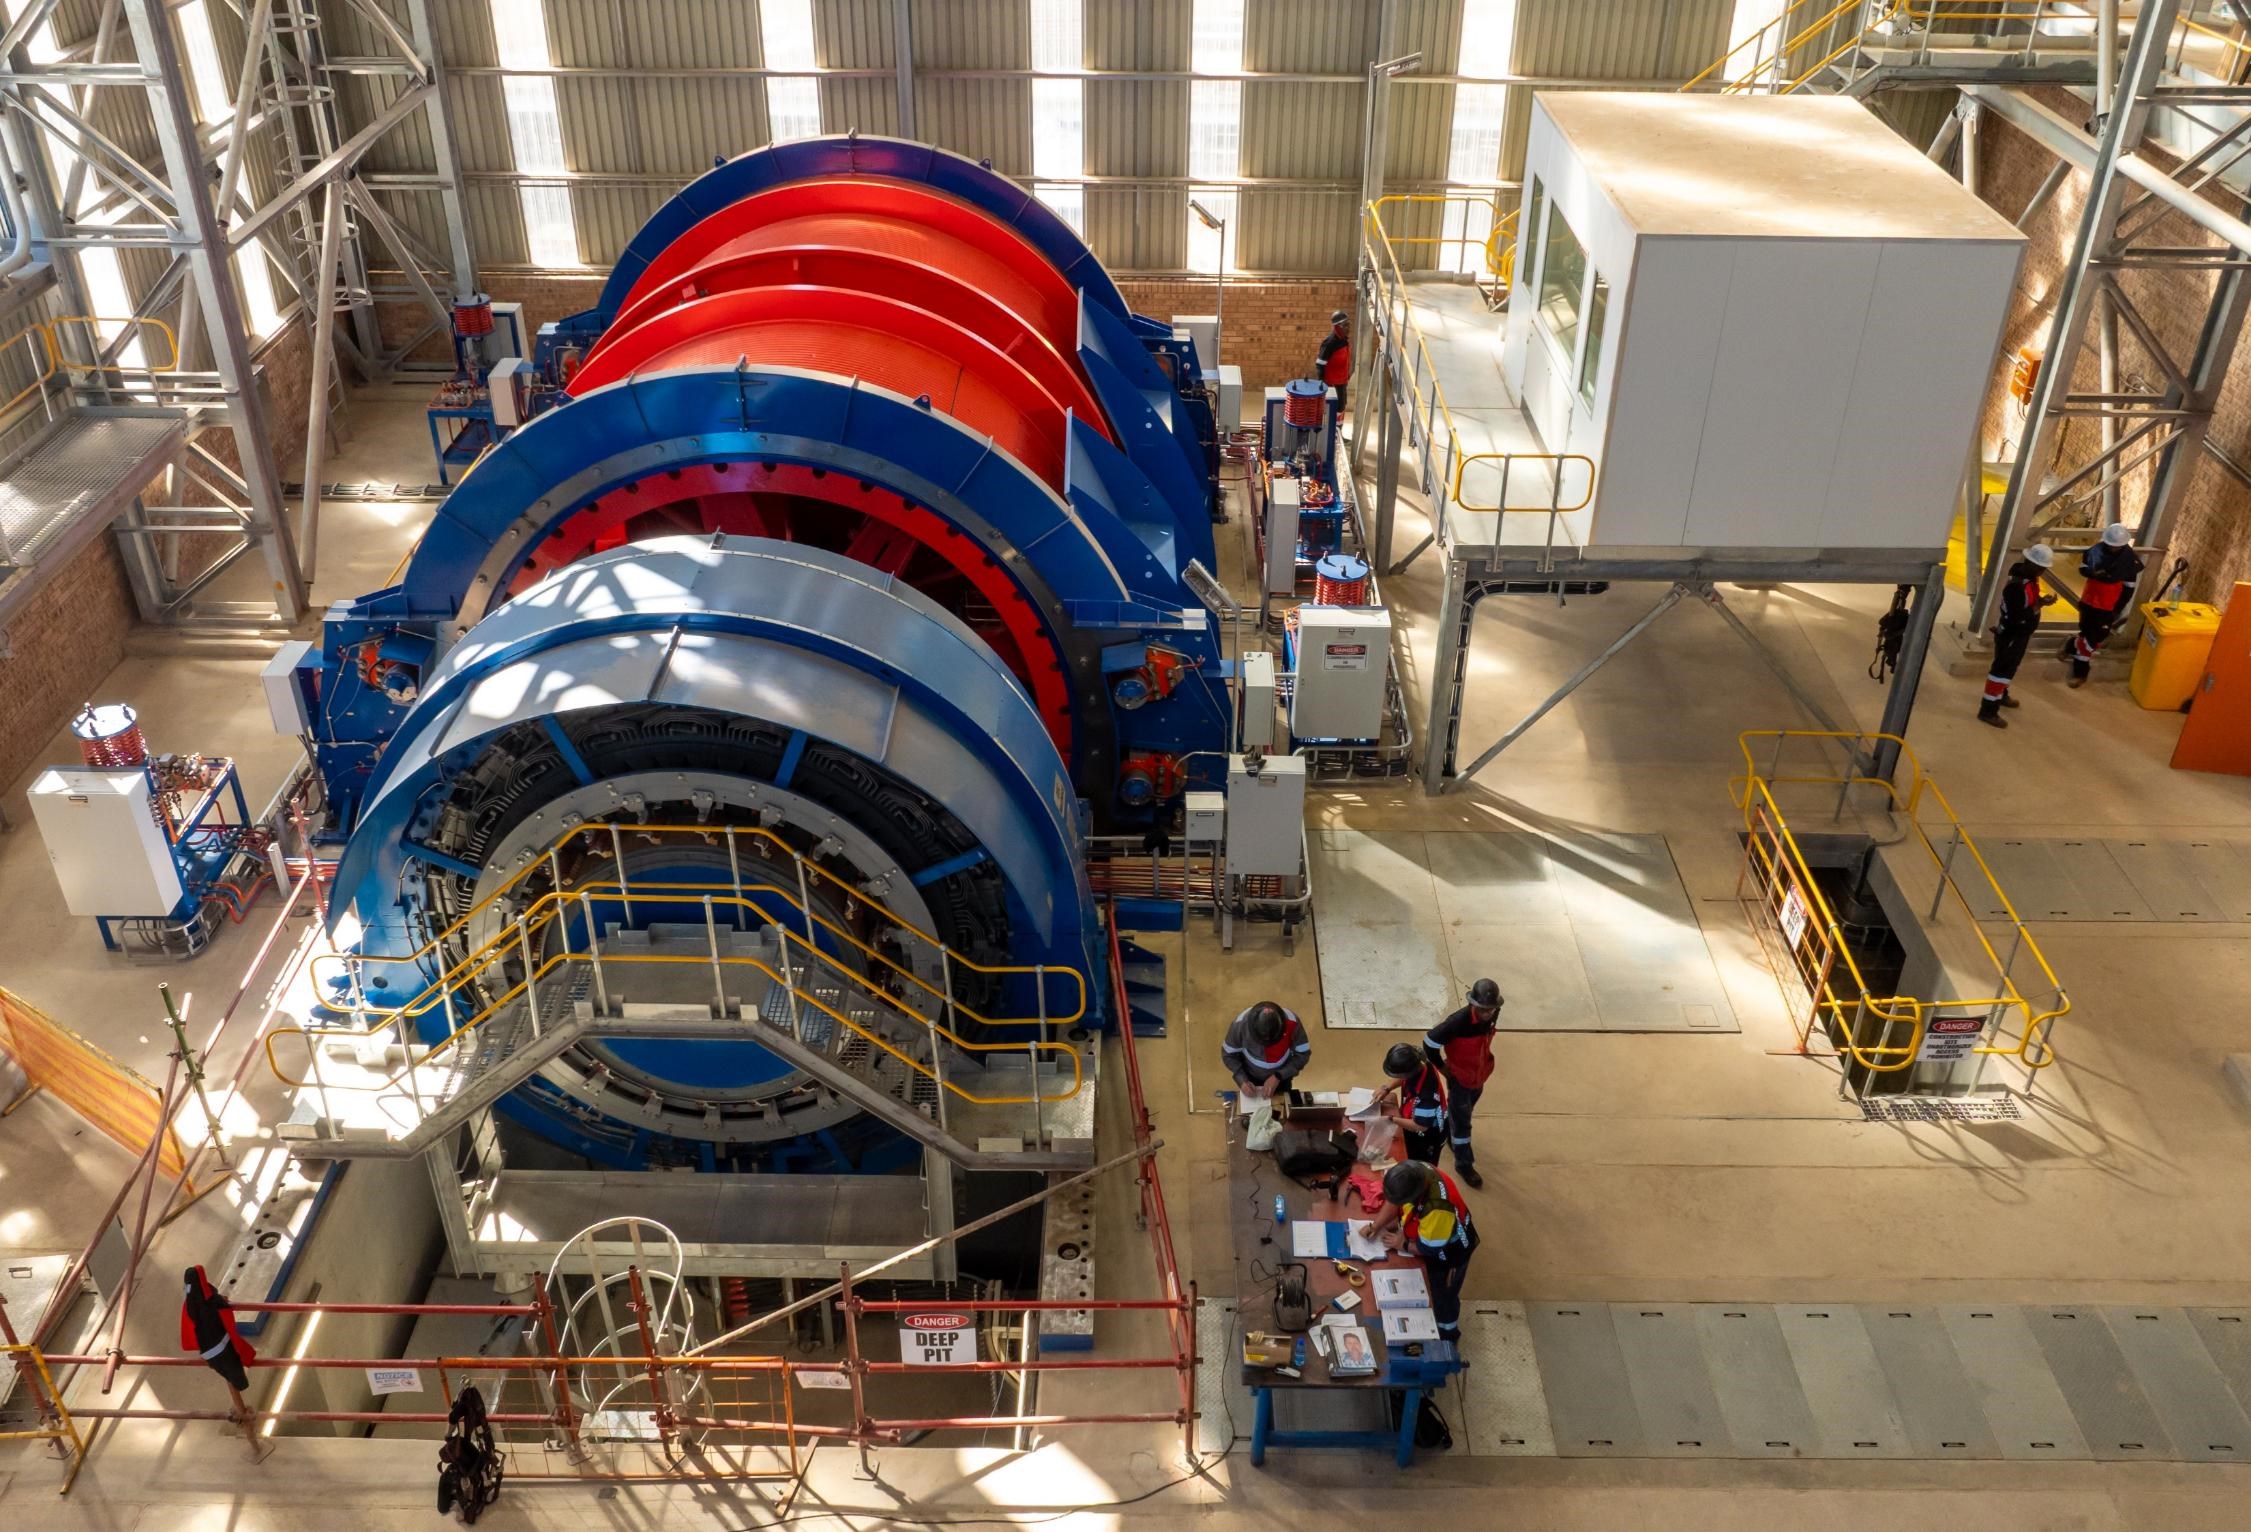
Africa's largest and greenest copper smelter at Kamoa-Kakula is expected to start up in November. The installation of the uninterruptible power supply system is almost complete, as shown in the foreground.
To view an enhanced version of this graphic, please visit:
https://images.newsfilecorp.com/files/3396/272406_84af4aec2403f89c_002full.jpg
Conference call for investors on Thursday, October 30, 2025
Ivanhoe Mines will hold an investor conference call to discuss the results on Thursday, October 30, 2025, at 10:30 a.m. Eastern time / 7:30 a.m. Pacific time. The conference call will conclude with a question-and-answer (Q&A) session. Media are invited to attend on a listen-only basis.
To view the webcast, use the link:
https://meetings.lumiconnect.com/400-472-545-399
Audience Phone Number:
Local - Toronto: (+1) 416-855-9085
Toll Free - North America: (+1) 800- 990-2777
An audio webcast recording of the conference call, together with supporting presentation slides, will be available on Ivanhoe Mines' website at www.ivanhoemines.com.
After issuance, the condensed consolidated interim financial statements and Management's Discussion and Analysis will be available at www.ivanhoemines.com and www.sedarplus.ca.
Read Ivanhoe's Q3 2025 Sustainability Review:
To view an enhanced version of this graphic, please visit:
https://images.newsfilecorp.com/files/3396/272406_84af4aec2403f89c_003full.jpg
During the third quarter of 2025, the group achieved a combined Lost Time Injury Frequency Rate (LTIFR) of 0.34 and a Total Recordable Injury Frequency Rate (TRIFR) of 1.03 per 1,000,000 hours worked. A breakdown of Ivanhoe's industry-leading health and safety performance can be found in the Q2 2025 Sustainability Review on the company's website:
https://www.ivanhoemines.com/investors/document-library/#sustainability
Principal projects and review of activities
1. Kamoa-Kakula Copper Complex
39.6%-owned by Ivanhoe Mines
Democratic Republic of Congo
The Kamoa-Kakula Copper Complex is operated as the Kamoa Holding joint venture between Ivanhoe Mines and Zijin Mining. The complex covers a licence area of 400 square kilometres and is approximately 25 kilometres southwest of the town of Kolwezi on the far western edge of the Central African Copperbelt.
Ivanhoe sold a 49.5% share interest in Kamoa Holding Limited (Kamoa Holding) to Zijin Mining and a 1% share interest in Kamoa Holding to privately owned Crystal River in December 2015. Kamoa Holding holds an 80% interest in the project, and the DRC government holds the remaining 20% interest. Ivanhoe and Zijin Mining, therefore, each hold an indirect 39.6% interest in Kamoa-Kakula, with Crystal River holding an indirect 0.8% interest. Kamoa-Kakula's full-time employee workforce is over 7,300, and approximately 90% are Congolese.
Copper production at Kamoa-Kakula commenced in May 2021, following the ahead-of-schedule completion of the Phase 1 concentrator. Since then, the Phase 2 and Phase 3 mine and concentrator expansions have also been successfully delivered ahead of schedule, ranking Kamoa-Kakula among the largest and highest-grade copper operations globally. The start-up of the 500,000 tonne-per-annum on-site direct-to-blister copper smelter is expected in Q4 2025, significantly lowering the carbon footprint and boosting the margins of Kamoa-Kakula's copper production.
Production since May 18, 2025, has been impacted by seismic activity and subsequent partial flooding at the Kakula Mine, resulting in curtailed production. Dewatering and rehabilitation work are underway. The Phase 3 operations, supplied by the Kamoa mines, continue uninterrupted.
Kamoa-Kakula summary of operating and financial data
| Q3 2025 | Q2 2025 | Q1 2025 | Q4 2024 | Q3 2024 | |
| Ore tonnes milled (000's tonnes) | 3,456 | 3,622 | 3,723 | 3,655 | 3,266 |
| Copper ore grade processed (%) | 2.47% | 3.58% | 4.10% | 4.26% | 4.14% |
| Copper recovery (%) | 82.7% | 85.4% | 87.4% | 86.6% | 85.3% |
| Copper in concentrate produced (tonnes) | 71,266 | 112,009 | 133,120 | 133,819 | 116,313 |
| Payable copper sold (tonnes)(1) | 61,528 | 101,714 | 109,963 | 112,811 | 103,106 |
| Cost of sales per pound ($ per lb.) | 3.23 | 2.85 | 1.87 | 1.94 | 1.80 |
| Cash cost (C1) ($ per lb.) | 2.62 | 1.89 | 1.69 | 1.75 | 1.69 |
| Realized copper price ($ per lb.) | 4.42 | 4.34 | 4.19 | 4.08 | 4.16 |
| Sales revenue before remeasurement ($'000) | 555,293 | 868,846 | 922,411 | 895,758 | 836,871 |
| Remeasurement of contract receivables ($'000) | 11,072 | 6,443 | 50,986 | (52,428) | (8,983) |
| Sales revenue after remeasurement ($'000) | 566,365 | 875,289 | 973,397 | 843,330 | 827,888 |
| EBITDA ($'000) | 195,597 | 325,181 | 594,337 | 431,802 | 469,735 |
| EBITDA margin (% of sales revenue) | 35% | 37% | 61% | 51% | 57% |
All figures in the above tables are on a 100%-project basis. Metal reported in concentrate is before refining losses or deductions associated with smelter terms. This MD&A includes "EBITDA", "Adjusted EBITDA", "EBITDA margin", "Pro-rata cash and cash equivalents", and "Cash cost (C1)", which are non-GAAP financial performance measures. For a detailed description of each of the non-GAAP financial performance measures used herein and a detailed reconciliation to the most directly comparable measure under IFRS Accounting Standards, please refer to the non-GAAP Financial Performance Measures and Pro-Rata Financial Ratios sections of the MD&A for the three and nine months ended September 30, 2025.
(1) Payable copper sold is net of the payability factor of circa 97%. Copper in concentrate produced net of the payability factor is noted in the non-GAAP Financial Performance Measures section of the MD&A for the three and nine months ended September 30, 2025.
C1 cash cost per pound of payable copper produced can be further broken down as follows:
| Q3 2025 | Q2 2025 | Q1 2025 | Q4 2024 | Q3 2024 | ||
| Mining | ($ per lb.) | 1.22 | 0.73 | 0.63 | 0.61 | 0.62 |
| Processing | ($ per lb.) | 0.50 | 0.34 | 0.29 | 0.30 | 0.26 |
| Logistics charges | ($ per lb.) | 0.38 | 0.49 | 0.41 | 0.40 | 0.42 |
| TC, RC, smelter charges | ($ per lb.) | 0.21 | 0.14 | 0.19 | 0.27 | 0.26 |
| General & Administrative | ($ per lb.) | 0.31 | 0.19 | 0.17 | 0.17 | 0.13 |
| Cash cost (C1) per pound of payable copper produced | ($ per lb.) | 2.62 | 1.89 | 1.69 | 1.75 | 1.69 |
The cost of power, which is allocated between mining and processing in the above cash cost split, can be split out as follows:
| Q3 2025 | Q2 2025 | Q1 2025 | Q4 2024 | Q3 2024 | ||
| Power costs included in Mining and Processing cost | ($ per lb.) | 0.35 | 0.20 | 0.24 | 0.22 | 0.19 |
| Power costs as a proportion of cash cost (C1) per pound of payable copper produced | (%) | 13.4% | 10.6% | 14.2% | 12.6% | 11.2% |
Cash cost (C1) is prepared on a basis consistent with the industry standard definitions by Wood Mackenzie cost guidelines, but is not a measure recognized under IFRS Accounting Standards. In calculating the C1 cash cost, the costs are measured on the same basis as the Company's share of profit from the Kamoa Holding joint venture, which is contained in the financial statements. C1 cash cost is used by management to evaluate operating performance and includes all direct mining, processing, and general and administrative costs. Smelter charges and freight deductions on sales to the final port of destination, which are recognized as a component of sales revenues, are added to C1 cash cost to arrive at an approximate cost of delivered, finished metal. C1 cash cost excludes royalties, production taxes, and non-routine charges as they are not direct production costs.
All figures are on a 100% project basis, and metal reported in concentrate is before refining losses or deductions associated with smelter terms.
Kamoa-Kakula produced 71,266 tonnes of copper in Q3 2025, recovery efforts advancing well
During the third quarter of 2025, the Phase 1, 2, and 3 concentrators milled a total of 3.46 million tonnes of ore, producing 71,266 tonnes of copper. Year-to-date copper production totaled 316,395 tonnes. As revised on June 11, 2025, Kamoa-Kakula's annual production guidance of 370,000 to 420,000 tonnes of copper is maintained. Mining of higher-grade areas on the western side of the Kakula Mine is expected from November.
Kamoa-Kakula summary of quarterly production data
| Q3 2025 | Q2 2025 | Q1 2025 | Q4 2024 | Q3 2024 | |
| Phase 1 & 2 | |||||
| Ore tonnes milled (000's tonnes) | 1,838 | 1,991* | 2,211 | 2,329 | 2,215 |
| Copper ore grade processed (%) | 2.50% | 4.12%* | 5.01% | 5.08% | 4.86% |
| Copper recovery (%) | 81.3% | 85.4%* | 88.3% | 87.0% | 86.6% |
| Copper in concentrate produced (tonnes) | 37,744 | 71,401* | 97,575 | 102,042 | 94,214 |
| Phase 3 | |||||
| Ore tonnes milled (000's tonnes) | 1,618 | 1,631 | 1,512 | 1,326 | 1,050 |
| Copper ore grade processed (%) | 2.44% | 2.92% | 2.76% | 2.82% | 2.64% |
| Copper recovery (%) | 84.2% | 85.5% | 85.1% | 85.1% | 79.9% |
| Copper in concentrate produced (tonnes) | 33,522 | 40,608 | 35,545 | 31,777 | 22,099 |
| Combined Phase 1, 2, and 3 | |||||
| Ore tonnes milled (000's tonnes) | 3,456 | 3,622 | 3,723 | 3,655 | 3,266 |
| Copper ore grade processed (%) | 2.47% | 3.58% | 4.10% | 4.26% | 4.14% |
| Copper recovery (%) | 82.7% | 85.4% | 87.4% | 86.6% | 85.3% |
| Copper in concentrate produced (tonnes) | 71,266 | 112,009 | 133,120 | 133,819 | 116,313 |
Data in bold denotes a quarterly record.
* Phase 1 & 2 production was impacted in the second quarter by seismic activity at the Kakula Mine as announced on May 20, 2025
As at September 30, 2025, Kamoa-Kakula's useable ore surface stockpiles totaled approximately 1.7 million tonnes at an estimated blended average grade of 2.02% copper. Contained copper in the stockpiles at the end of September totaled approximately 34,405 tonnes. At current run rates, surface stockpiles are expected to provide mill feed to the Phase 1 and Phase 2 concentrators until Q1 2026.
Kakula head grades to improve in Q4 2025 as dewatering activities re-open higher-grade mining areas
As announced on June 11, 2025, mining operations on the western side of the Kakula Mine restarted on June 7, 2025. Since mid-June, the mining rate has increased to an average rate of 350,000 tonnes per month (4.2 million tonnes on an annualized basis). To increase mining rates from the western side of the Kakula Mine, the cut-off grade has been lowered to 1.5% copper (previously 2.0%).
Mining on the western side of the Kakula Mine has been focused on higher-elevation areas in the north and southwest, where copper grades are lower than those of the higher-grade centre, which is currently submerged. From mid-November, mining crews plan to advance towards the centre of the western side of the Kakula Mine, improving head grades to between 3.5% and 4.5%.
The Phase 1 and 2 concentrators will continue to process ore from the western side of the Kakula Mine, as well as surface stockpiles, until Q1 2026, when the stockpiles are depleted. Thereafter, selective mining will commence within the existing workings on the eastern side of the Kakula Mine, which will augment rising production from higher-grade areas on Kakula's western side to underpin improved underground mining rates.
The Phase 3 concentrator milled 1.62 million tonnes of ore in the third quarter, producing 33,522 tonnes of copper. For a second consecutive quarter, the Phase 3 concentrator averaged a milling rate equivalent to 6.5 million tonnes annualized, which is 30% higher than the design capacity of 5.0 million tonnes per annum. The average quarterly feed grade for the Phase 3 concentrator was 2.44% copper. The cut-off grade was also lowered to 1.5% copper at the Kamoa Mine to achieve higher mining rates, providing sufficient feed for the Phase 3 concentrator and supplementary feed for the Phase 1 and 2 concentrators. For the foreseeable future, it is expected that the feed grade into the Phase 3 concentrator will continue to average approximately 2.5% copper.
Stage Two dewatering of the Kakula Mine is advancing to plan; Stage Three is on track to commence in November
The four Stage Two high-capacity submersible pumps were commissioned over the course of two weeks in August and September. The four pumps are operating at their design rate, totaling approximately 2,600 litres per second. Including the mobile Stage One pump stations located underground, the total pumping rate at the Kakula Mine has the potential to pump up to 6,400 litres per second, or 550 megalitres per day, subject to available underground access and grid stability.
Stage Two dewatering of the Kakula Mine is approximately 35% complete. Grid instability disrupted the Stage One dewatering pumps at the beginning of the fourth quarter, delaying the completion of Stage Two dewatering to early December.
To date, approximately 13 kilometres of lateral development have been rehabilitated. As the water level declines, the mining crews are primarily focused on rehabilitating the access drives required for repositioning the temporary Stage One underground pumping infrastructure, as well as the access towards the Stage Three pump stations, which are currently submerged.
It is expected that within the coming week, the central section of the Kakula Mine will be dewatered, splitting the flooded section into two. This will reopen access between the north and south declines, as shown in Figure 1. Shortly thereafter, the mining crews expect to start gaining access to the existing Stage Three pumping infrastructure in November. Each pump station will be refitted and recommissioned with new pump motors and associated electrical infrastructure.
Updated life-of-mine integrated development plan well underway for Q1 2026; targeting return of annualized copper production to over 550,000 tonnes
Work is well underway on an updated life-of-mine integrated development plan. The plan includes a full review of both the Kakula and Kamoa mine plans, with the target of increasing mining rates up to 17 million tonnes per year, prior to the Phase 4 expansion. The review includes updates to several technical assumptions, which continue to evolve as the dewatering advances, supported by several industry experts and qualified persons (QPs) engaged by Kamoa Copper since the seismic activity occurred. Completion of the life-of-mine integrated development plan is targeted by the end of Q1 2026.
Production rates are expected to steadily improve once the Kakula Mine is dewatered, with annualized copper production returning to over 550,000 tonnes over the medium term. Ivanhoe Mines also plans to provide, by the latest in Q1 2026, an update on Kamoa-Kakula's production guidance and recovery plan over the medium term.
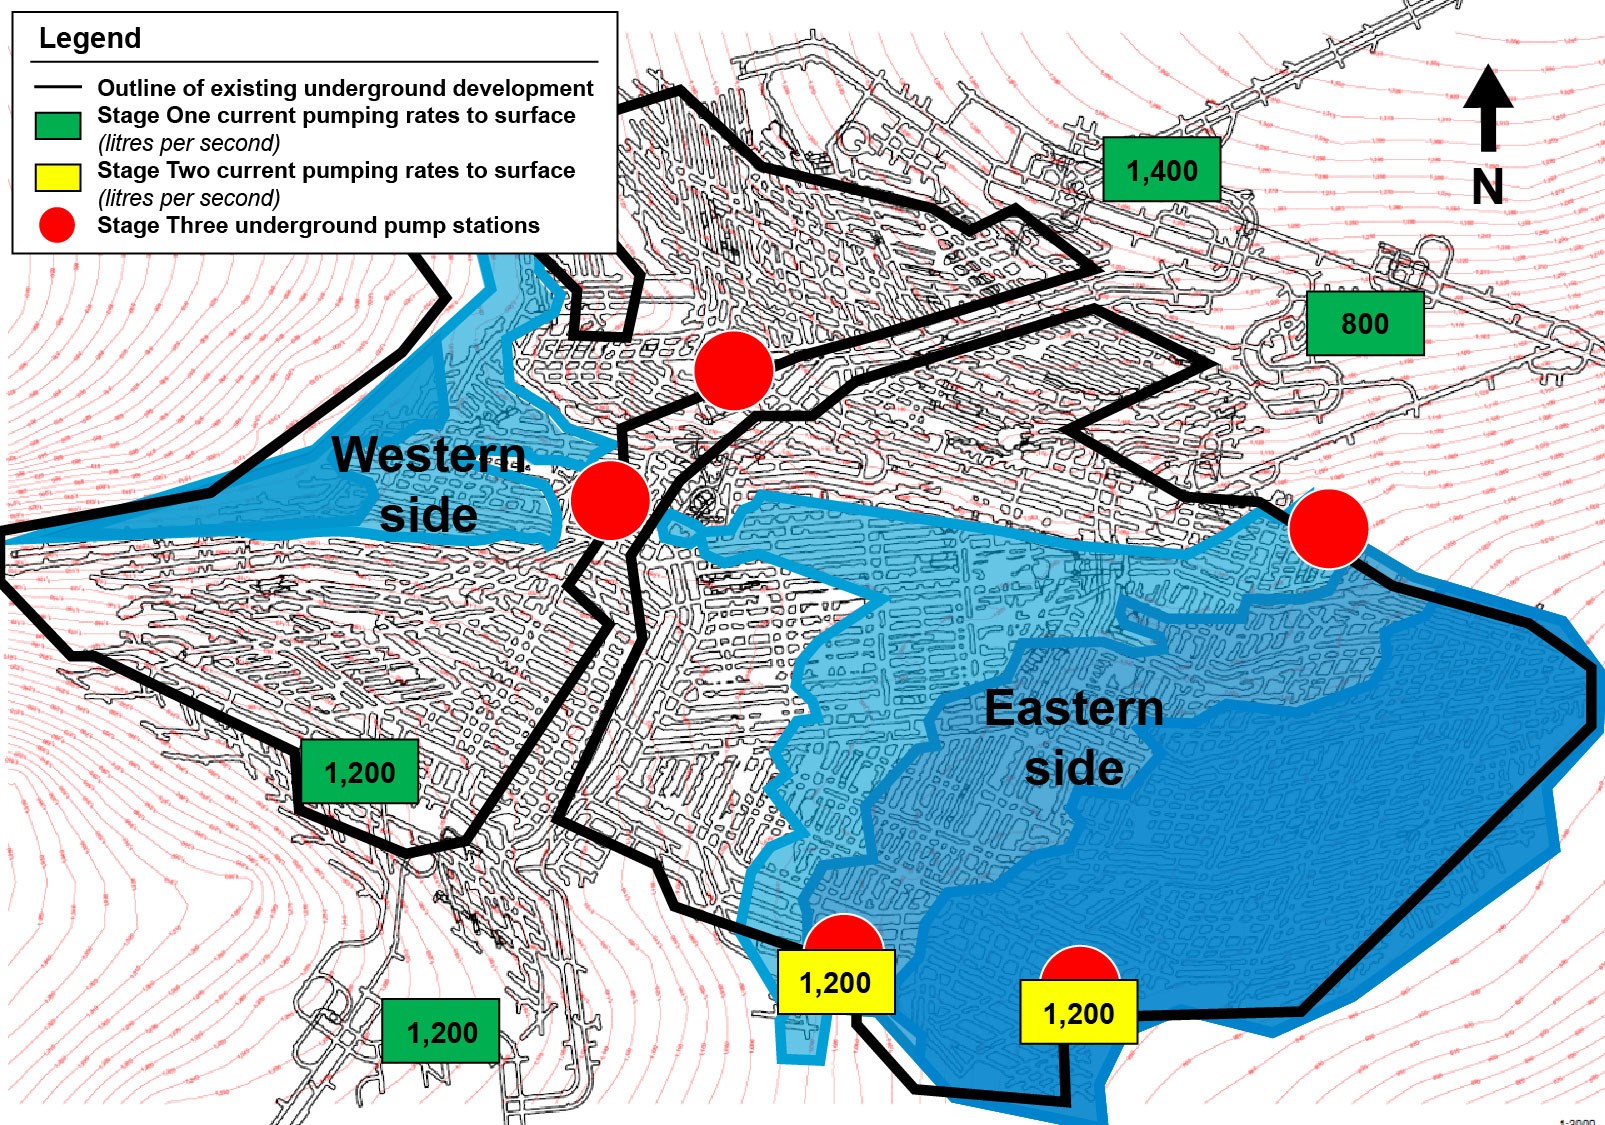
Figure 1. A schematic of the projected decrease in underground water levels at the Kakula Mine from early November (light blue) to early December 2025 (dark blue).
To view an enhanced version of this graphic, please visit:
https://images.newsfilecorp.com/files/3396/272406_84af4aec2403f89c_004full.jpg
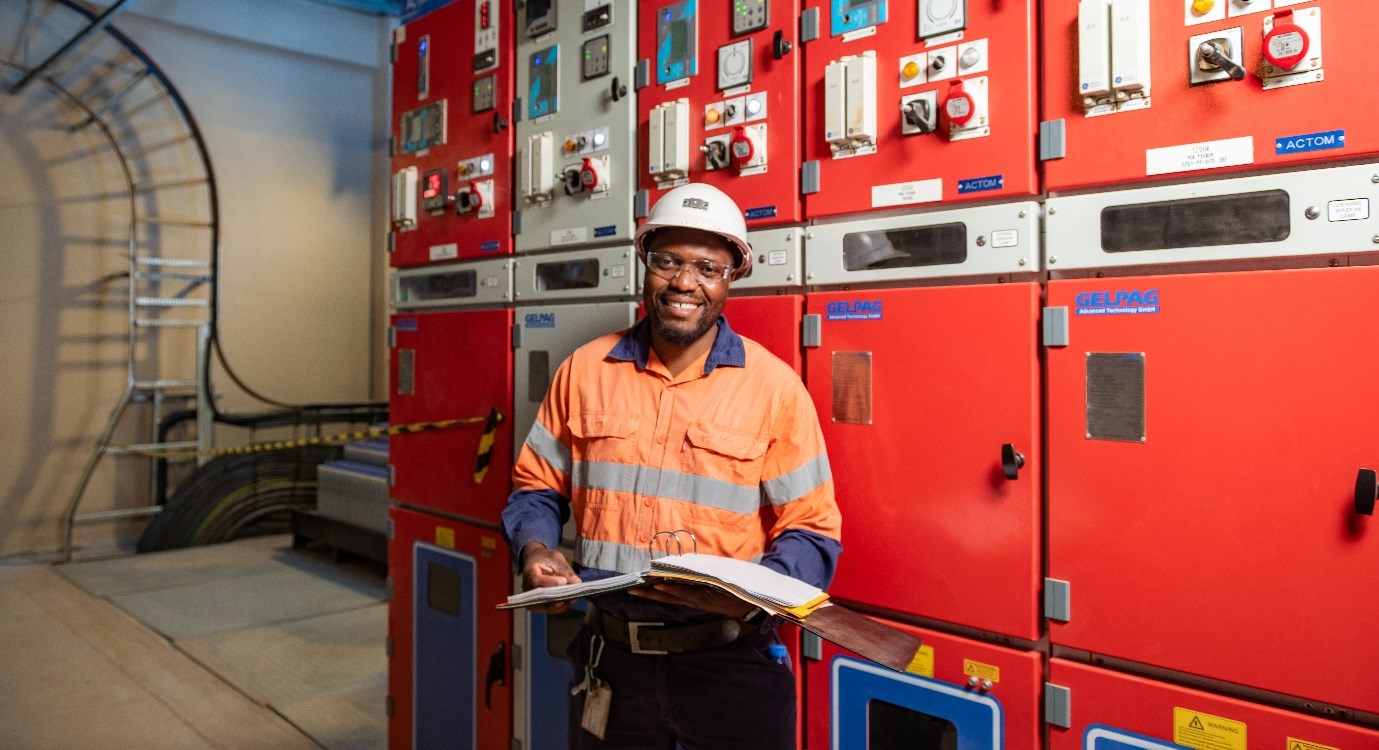
Themba Sibanda, quality control manager, at the Kakula South east vent shaft inspecting the dewatering pump activity.
To view an enhanced version of this graphic, please visit:
https://images.newsfilecorp.com/files/3396/272406_84af4aec2403f89c_005full.jpg
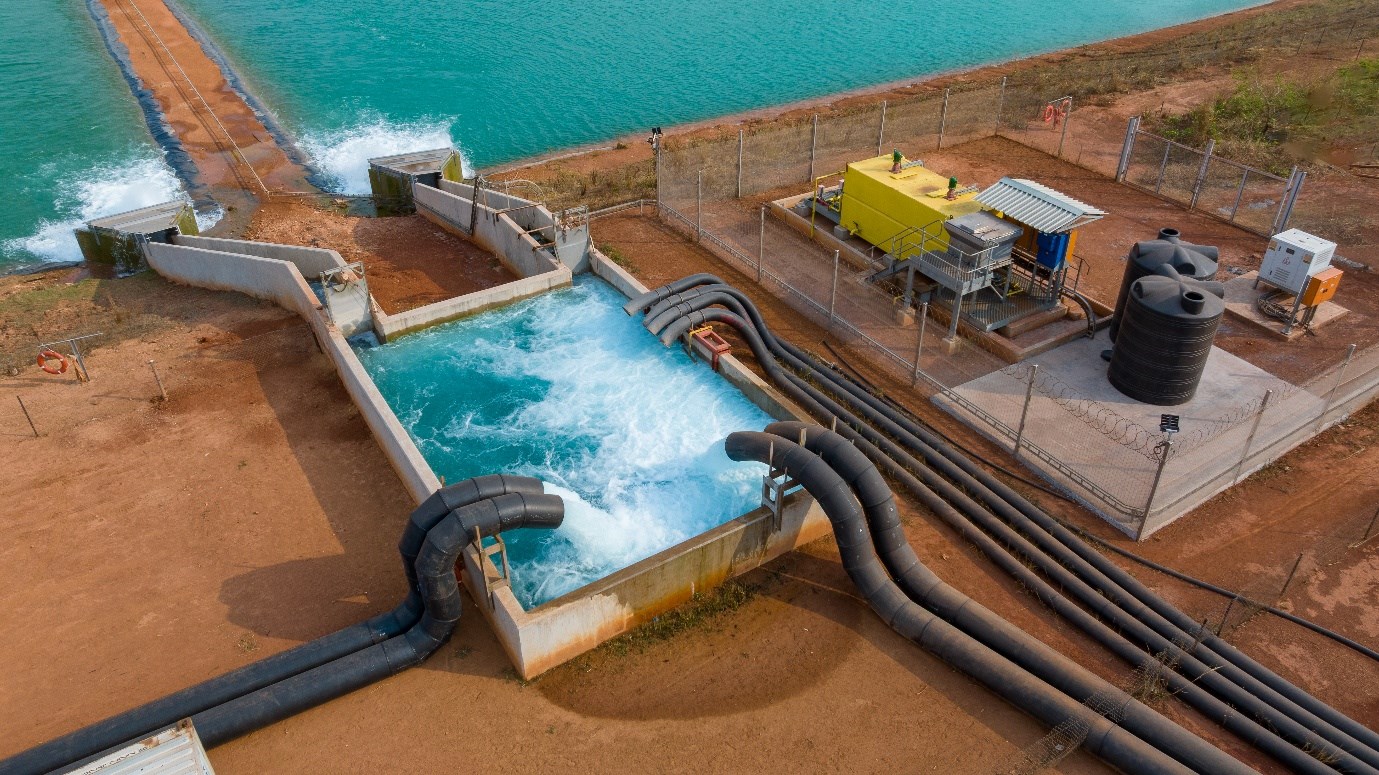
Water from the Stage Two dewatering activities is discharged into the Kakula South settling ponds for treatment.
To view an enhanced version of this graphic, please visit:
https://images.newsfilecorp.com/files/3396/272406_84af4aec2403f89c_006full.jpg
Smelter start-up scheduled in the coming weeks; installation of 60-megawatt, battery-powered, uninterruptible power supply (UPS) facility nearing completion
The heat-up of Kamoa-Kakula's state-of-the-art on-site, 500,000-tonne-per-annum direct-to-blister copper smelter is expected to commence in November 2025. Kamoa-Kakula's management team expects to prioritize the processing of concentrates produced by the Phase 1, 2, and 3 concentrators through the on-site smelter, with any excess concentrate toll-treated at the nearby Lualaba Copper Smelter (LCS) in Kolwezi.
The smelter start-up will commence as the installation of the UPS facility nears completion. The 60 MW UPS is designed to provide up to two hours of instantaneous back-up power to the smelter, protecting the operation from voltage fluctuations in the DRC grid. In addition to the UPS, there is a further 60 MW of dedicated diesel-powered, back-up generator capacity.
There is sufficient on-site copper concentrate inventory for the smelter start-up in November. At the end of September, Kamoa-Kakula's unsold copper in concentrate inventory totaled 59,000 tonnes, which includes 7,300 tonnes located at LCS. The first feed of concentrate into the smelter is expected approximately four to six weeks after heat-up commences. Total unsold copper in concentrate at the smelter, held in stockpiles and the smelting circuit, is expected to reduce to approximately 17,000 tonnes as the smelter reaches full ramp-up.
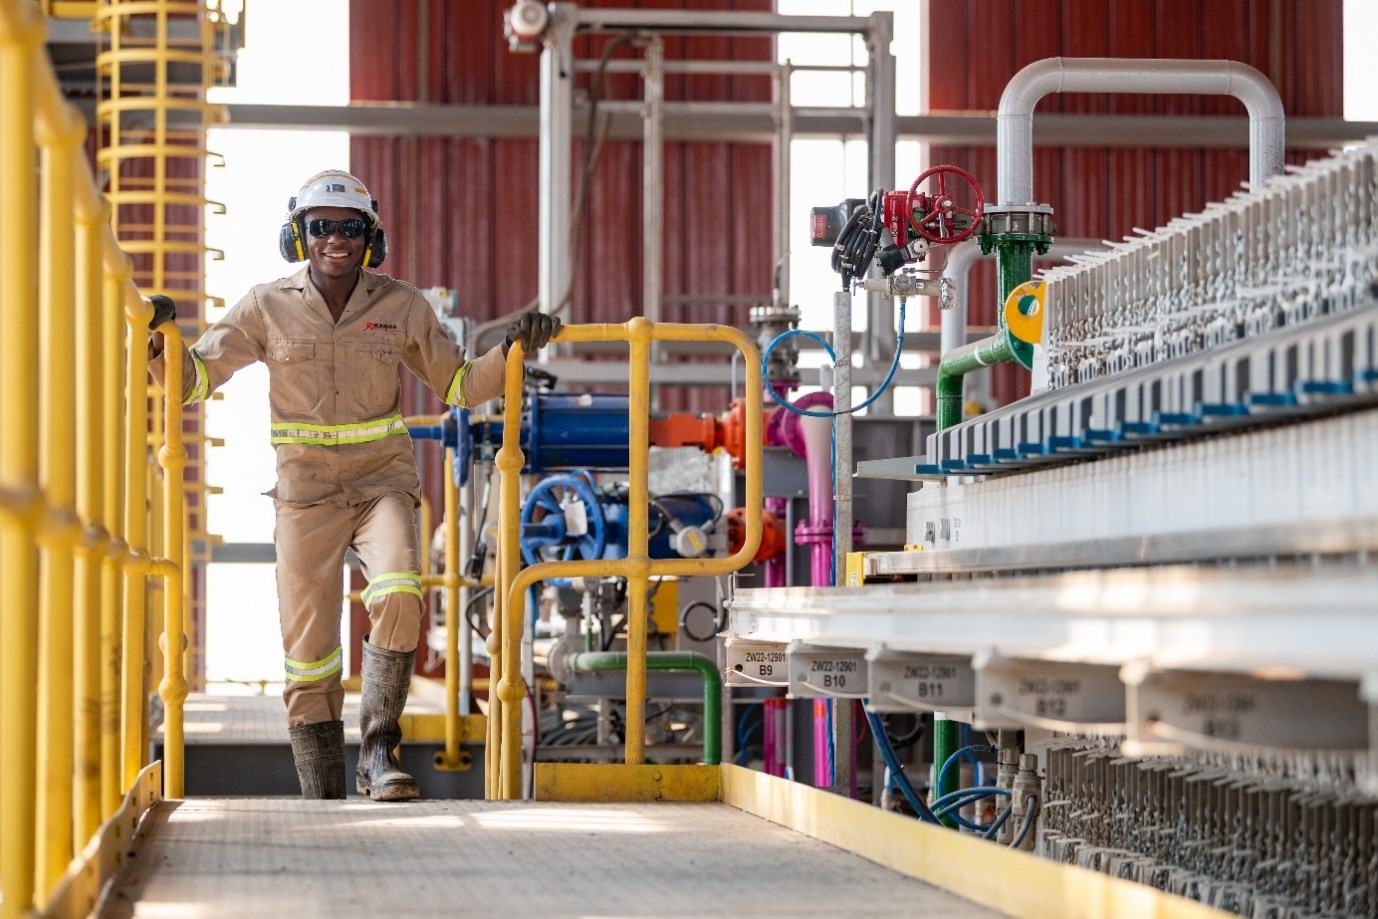
Idi Abudu Gabriel, assistant mechanic, at the smelter's slag processing plant.
To view an enhanced version of this graphic, please visit:
https://images.newsfilecorp.com/files/3396/272406_84af4aec2403f89c_007full.jpg
Kamoa-Kakula's Project 95 is approximately 57% complete, with completion expected in Q2 2026
Kamoa-Kakula's Project 95 is 57% complete, with completion now expected in early Q2 2026. The "Project 95" initiative for Kamoa-Kakula's Phase 1 and 2 concentrators aims to increase the overall recovery rate to 95%, up from the design recovery rate of 87%, based on a high-grade feed of 5% copper.
During the interim period, while the Kakula Mine is undergoing turnaround, a portion of the ore feed to the Phase 1 and 2 concentrators, sourced from both the Kakula and Kamoa mines, will be of lower grade. Kamoa-Kakula's engineering team aims to maintain a recovery rate from the lower-grade sources of at least 90%.
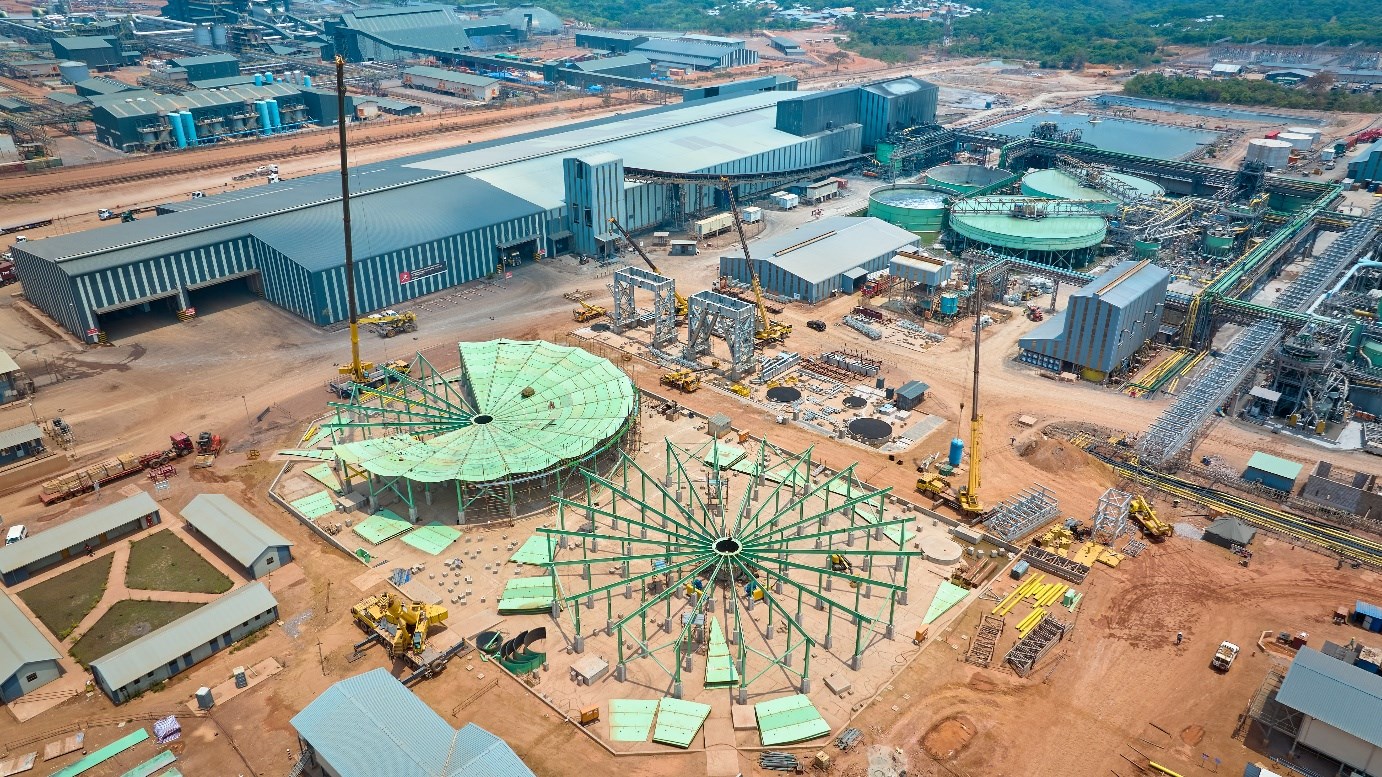
Project 95 construction works are advancing well, with completion expected in early Q2 2026. The foreground shows the civil works for the new thickeners, with the adjacent Phase 1 and 2 concentrator storage shed in the background, and the on-site copper smelter further behind.
To view an enhanced version of this graphic, please visit:
https://images.newsfilecorp.com/files/3396/272406_84af4aec2403f89c_008full.jpg
Kamoa-Kakula's 60-megawatt, on-site solar (PV) facility construction is progressing well
During late March and early April 2025, Kamoa Copper signed power purchase agreements (PPA) with CrossBoundary Energy DRC of Nairobi, Kenya, and La Societe Green World Energie SARL of Beijing, China, to provide up to 60 megawatts (MW) in baseload clean energy to Kamoa-Kakula's operations from an on-site solar facility. The facilities, which will be owned, operated, and funded by CrossBoundary Energy and Green World Energie, will comprise a total peak of 406 MW of solar photovoltaic (PV) capacity, with up to 1,107 megawatt hours (MWh) of battery energy storage system (BESS) capacity. Kamoa Copper will be the sole off-taker of the electricity produced by both facilities.
Construction of the two 30-MW solar facilities is progressing well. Both Independent Power Producers (IPPs) have completed engineering and the procurement of all long-lead order items. The first batches of BESS, inverters, and mounting structures have been shipped with 80 loads already offloaded at site. Civil construction is advancing well with foundation casting, access roads, and camp facilities nearing completion. Overall, both projects are 42% and 46% complete, with commercial operation expected in Q2 2026.
Kamoa-Kakula plans to expand its on-site solar facilities further over time, targeting a baseload capacity of up to 120 MW.
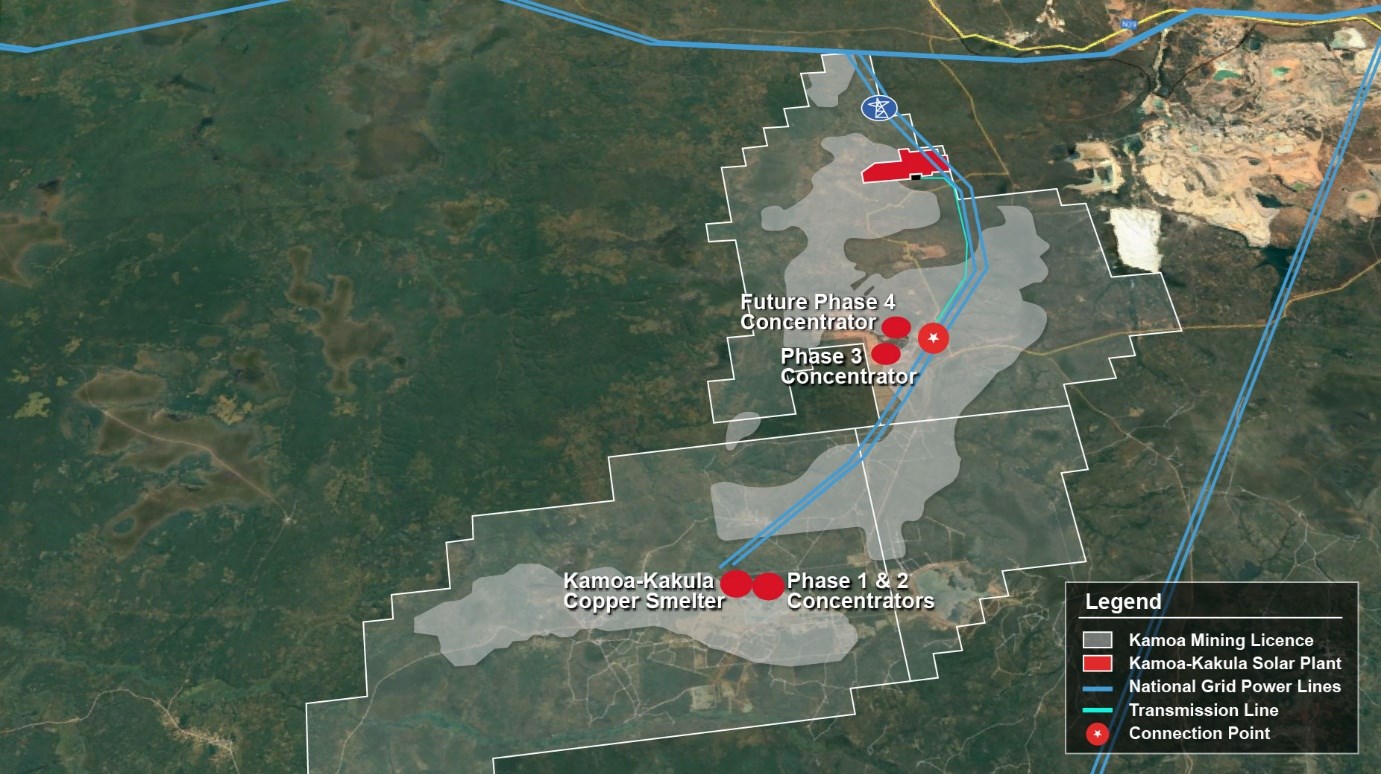
Figure 2. Map of Kamoa-Kakula's licence package, showing the existing powerlines (in blue) and the site of the on-site 60 MW solar PV power plant, battery storage, and substation (in red). Commercial operation of the facility is expected from Q2 2026.
To view an enhanced version of this graphic, please visit:
https://images.newsfilecorp.com/files/3396/272406_84af4aec2403f89c_009full.jpg
First synchronisation and the energization of refurbished Turbine #5 complete at Inga II hydroelectric facility
The installation of refurbished mechanical and electrical equipment at Turbine #5 at the Inga II hydroelectric facility was completed during the third quarter. Commissioning activities are now nearing completion following the synchronization and energization of the turbine, which took place early in the fourth quarter. Kamoa-Kakula is expected to be allocated imminently an initial 50 MW of hydroelectric power from Inga II, increasing to 100 MW in Q1 2026, and thereafter increasing to 150 MW as grid improvement initiatives are completed.
The grid improvement initiatives are primarily focused on upgrades to the substations at Inga (SCI) and Kolwezi (SCK). The first upgrade, consisting of resistor banks at the Inga substation, was completed in May 2025. Corresponding resistor upgrades at the Kolwezi substation are expected to be completed imminently, improving voltage stability to Kamoa-Kakula. In addition, the static compensator at the Kolwezi substation is scheduled to be completed in early Q1 2026, increasing the power delivery from Inga II to the Kamoa-Kakula, up to 100 MW. The remaining workstreams of upgrading the filter banks at SCI and SCK will occur in phases over the next 18 months, ultimately increasing the total power delivery from Inga II hydro facility up to 150 MW from H1 2027.
COPPER PRODUCTION, CAPITAL EXPENDITURE AND CASH COST GUIDANCE FOR 2025
| Kamoa-Kakula 2025 Guidance | |
| Contained copper in concentrate (tonnes) | 370,000 - 420,000 |
| Cash cost (C1) ($ per pound of payable copper produced) | 1.90 - 2.20 |
| Capital expenditure ($ million) | 1,320 - 1,500 |
Guidance figures are on a 100% project basis.
Kamoa-Kakula's 2025 guidance is based on several assumptions and estimates. It involves estimates of known and unknown risks, uncertainties, and other factors that may cause the actual results to differ materially.
The 2025 production guidance, as revised on June 11, 2025, takes into account the probable effect of seismic activity as reported on May 20, 2025, and associated interruptions in mining operations at the Kakula Mine. The Kamoa-Kakula Copper Complex produced 316,395 tonnes of copper in concentrate for the nine months ended September 30, 2025 and is on track to meet revised guidance.
The 2025 guidance for cash cost (C1) per pound of payable copper and capital expenditure was revised on July 30, 2025. Cash cost (C1) per pound of copper produced for the nine months ended September 30, 2025, averaged $1.97/lb. Operations are on track to meet the revised 2025 cash cost (C1) guidance range. The upper and lower ends of the 2025 capital expenditure guidance range have been lowered by $100 million, to $1,320 million - $1,500 million, with $910 million spent year to date.
Although mining in the western side of the Kakula Mine has restarted, risk factors remain, including the integrity of underground infrastructure once dewatered, the ability to ramp up underground operations, the ability to complete dewatering activities, and the time required to access the new mining areas. The updated 2025 guidance ranges for Kamoa-Kakula are based on an assessment of these factors that management believes are reasonable at this time, given all available information. Metal reported in concentrate is before refining losses or deductions associated with smelter terms.
Cash cost (C1) guidance is based primarily on assumptions, including tonnes of ore mined, feed grades of processed copper ore, concentrator recoveries, as well as the timing and ramp-up of the on-site smelter, among other variables.
Cash cost (C1) is a non-GAAP measure used by management to evaluate operating performance and includes all direct mining, processing, stockpile rehandling charges, and general and administrative costs. Smelter charges and freight deductions on sales to the final port of destination (typically China), which are recognized as a component of sales revenues, are added to cash cost (C1) to arrive at an approximate cost of delivered finished metal.
For historical comparatives and a reconciliation to the most directly comparable measure under IFRS, see the non-GAAP Financial Performance Measures section of the company's MD&A for the three and nine months ended September 30, 2025.
2. Kipushi Mine
62%-owned by Ivanhoe Mines
Democratic Republic of Congo
The ultra-high grade Kipushi underground zinc-copper-germanium-silver-lead mine in the DRC is located adjacent to the town of Kipushi on the Zambian border, approximately 30 kilometres southwest of Lubumbashi on the Central African Copperbelt. Kipushi is approximately 250 kilometres southeast of the Kamoa-Kakula Copper Complex. Ivanhoe acquired a 68% interest in the Kipushi Mine in November 2011, through Kipushi Holding, which is 100%-owned by Ivanhoe Mines. The balance of 32% in the Kipushi Mine was held by the DRC state-owned mining company, Gécamines. As per the updated joint venture agreement signed in late 2023, Gécamines' ownership increased to 38% in Q1 2025.
Ivanhoe, together with its joint-venture partner, restarted the Kipushi zinc mine in mid-2024, with the ramp-up to steady state operations continuing during the quarter. On November 17, 2024, His Excellency Félix Tshisekedi, President of the Democratic Republic of the Congo, along with a government delegation, officially reopened the Kipushi zinc mine. Ramp-up of Kipushi is ongoing, following the successful completion of the debottlenecking program in Q3 2025.
Kipushi summary of operating and financial data
| Q3 2025 | Q2 2025 | Q1 2025 | Q4 2024 | Q3 2024 | |
| Kipushi concentrator | |||||
| Ore tonnes milled (tonnes) | 168,862 | 153,342 | 151,403 | 119,619 | 108,065 |
| Feed grade of ore milled (%) | 37.81% | 33.37% | 32.16% | 31.72% | 32.12% |
| Zinc recovery (%) | 89.36% | 85.22% | 87.93% | 85.07% | 75.78% |
| Zinc in concentrate produced (tonnes) | 57,200 | 41,788 | 42,736 | 32,490 | 18,946 |
Data in bold denotes a quarterly record
| Q3 2025 | Q2 2025 | Q1 2025 | Q4 2024 | Q3 2024 | |
| Payable zinc sold (tonnes) | 49,744 | 43,348 | 30,108 | 16,999 | - |
| Cost of sales per pound ($ per lb.) | 1.11 | 1.05 | 1.23 | 1.38 | - |
| Cash cost (C1) ($ per lb.) | 0.95 | 0.96 | 0.93 | 1.13 | - |
| Realized zinc price ($ per lb.) | 1.27 | 1.23 | 1.29 | 1.38 | - |
| Sales revenue before remeasurement ($'000) | 126,855 | 92,875 | 79,713 | 41,600 | - |
| Remeasurement of contract receivables ($'000) | 2,548 | 3,882 | (2,693) | (782) | - |
| Sales revenue after remeasurement ($'000) | 129,403 | 96,757 | 77,020 | 40,818 | - |
| EBITDA ($'000) | 26,675 | 9,295 | 10,508 | 4,050 | - |
| EBITDA margin (% of sales revenue) | 21% | 10% | 14% | 10% | - |
C1 cash cost per pound of payable zinc sold can be further broken down as follows:
| Q3 2025 | Q2 2025 | Q1 2025 | Q4 2024 | ||
| Mining | ($ per lb.) | 0.18 | 0.16 | 0.16 | 0.26 |
| Processing | ($ per lb.) | 0.05 | 0.08 | 0.12 | 0.12 |
| Logistics charges | ($ per lb.) | 0.49 | 0.50 | 0.47 | 0.48 |
| Treatment charges | ($ per lb.) | 0.07 | 0.07 | 0.05 | 0.17 |
| Support services | ($ per lb.) | 0.16 | 0.15 | 0.13 | 0.10 |
| Cash cost (C1) per pound of payable zinc sold | ($ per lb.) | 0.95 | 0.96 | 0.93 | 1.13 |
Cash cost (C1) is prepared on a basis consistent with the industry standard definitions by Wood Mackenzie cost guidelines, but cash cost per pound for the Kipushi Mine has been presented on a per ton sold basis to eliminate the impact of unsold tonnes of zinc concentrate in inventory. Cash cost (C1) and cash cost per pound are not measures recognized under IFRS Accounting Standards. C1 cash cost is used by management to evaluate operating performance and includes all direct mining, processing, and general and administrative costs. Smelter charges and freight deductions on sales to the final port of destination, which are recognized as a component of sales revenues, are added to C1 cash cost to arrive at an approximate cost of delivered, finished metal. C1 cash cost excludes royalties, production taxes, and non-routine charges as they are not direct production costs.
All figures are on a 100% project basis, and metal reported in concentrate is before refining losses or deductions associated with smelter terms.
Kipushi concentrator produced a record 57,200 tonnes of zinc in Q3 2025, a 37% quarter-on-quarter increase.
Zinc production from the Kipushi concentrator notably improved during the second half of the third quarter, with multiple records achieved. The improvement in production rates was attributed to the completion of the debottlenecking program, as well as upgrades to the dense media separation (DMS) system upstream of the concentrator. Both workstreams were completed in August.
Engineering work on the debottlenecking program commenced in September 2024 to boost the concentrator throughput rate by 20% from 800,000 to 960,000 tonnes of ore per annum. The debottlenecking program was completed in early August 2025, both ahead of schedule and under budget. A seven-day planned shutdown of the concentrator to commission the newly installed debottlenecking equipment and upgrades to the DMS circuit was completed in mid-August.
Multiple concentrator records have since been achieved in the latter half of the third quarter. A record 6,064 tonnes of zinc in concentrate were produced over seven days in late August, equivalent to an annual production rate of over 315,000 tonnes of zinc, after accounting for availability. Sustaining this production rate would take the Kipushi Mine from the world's seventh-largest zinc mining operation today to the third-largest zinc mining operation, as illustrated in Figure 3.
Despite the improved production rates, operations continue to be impacted by grid instability. An additional six megawatts of back-up generator capacity are in the process of being installed and will be commissioned in the coming weeks. The new generators will increase the total onsite back-up power to 20 MW, sufficient to maintain operational continuity during periods of grid instability. The additional electrical infrastructure upgrades are well underway, with the additional generator capacity expected to be completed in Q4 2025, while completion of the main electrical intake substation is anticipated in Q1 2026.
In addition to delivering the debottlenecking program ahead of schedule and under budget, the Kipushi project team has done so with an industry-leading safety record. Throughout the construction of the Kipushi concentrator, which started in September 2022 and was completed in June 2024, as well as the recently completed debottlenecking program, the project team at Kipushi did not record a single lost time injury (LTI). This is an outstanding and incredibly rare industry achievement.
Total year-to-date production from the Kipushi concentrator is 141,724 tonnes of zinc in concentrate. Following improved production rates from the recently completed debottlenecking program, Kipushi's 2025 production guidance remains unchanged at between 180,000 and 240,000 tonnes of zinc.
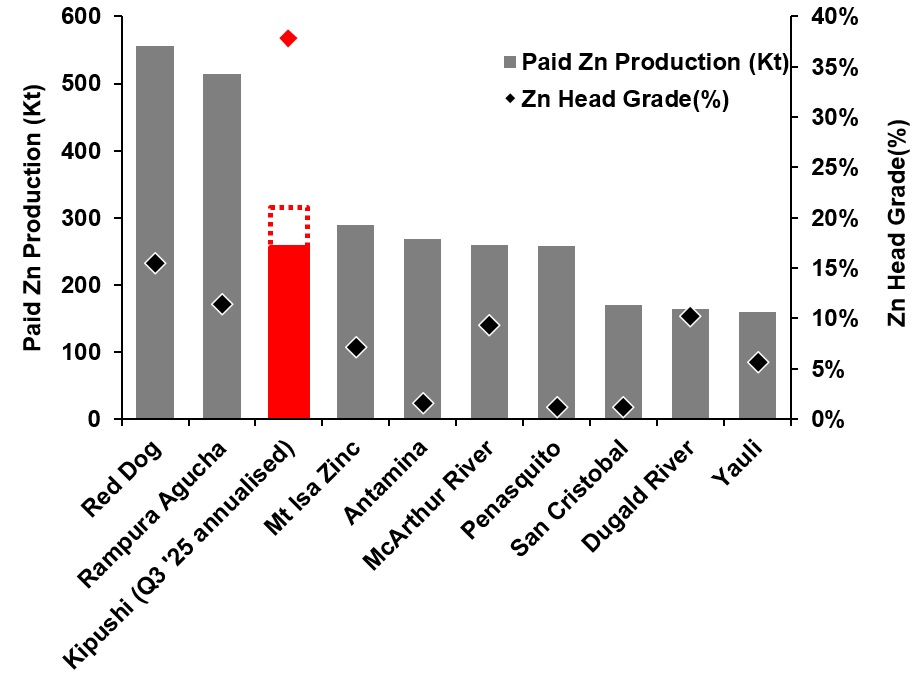
Figure 3. World's top 10 zinc mines in 2024, by paid zinc production per annum ('000 tonnes) with head grade (% zinc), with Kipushi's Q3 2025 production annualized.
To view an enhanced version of this graphic, please visit:
https://images.newsfilecorp.com/files/3396/272406_ivanhoe%20figure%203.jpg
Footnote: Capital IQ, 2025, Ivanhoe Mines. Kipushi production based on annualized Q3 2025 production, dotted red box represents Kipushi’s weekly production record set in Q3 2025; peer data is 2024 reported actuals where available.
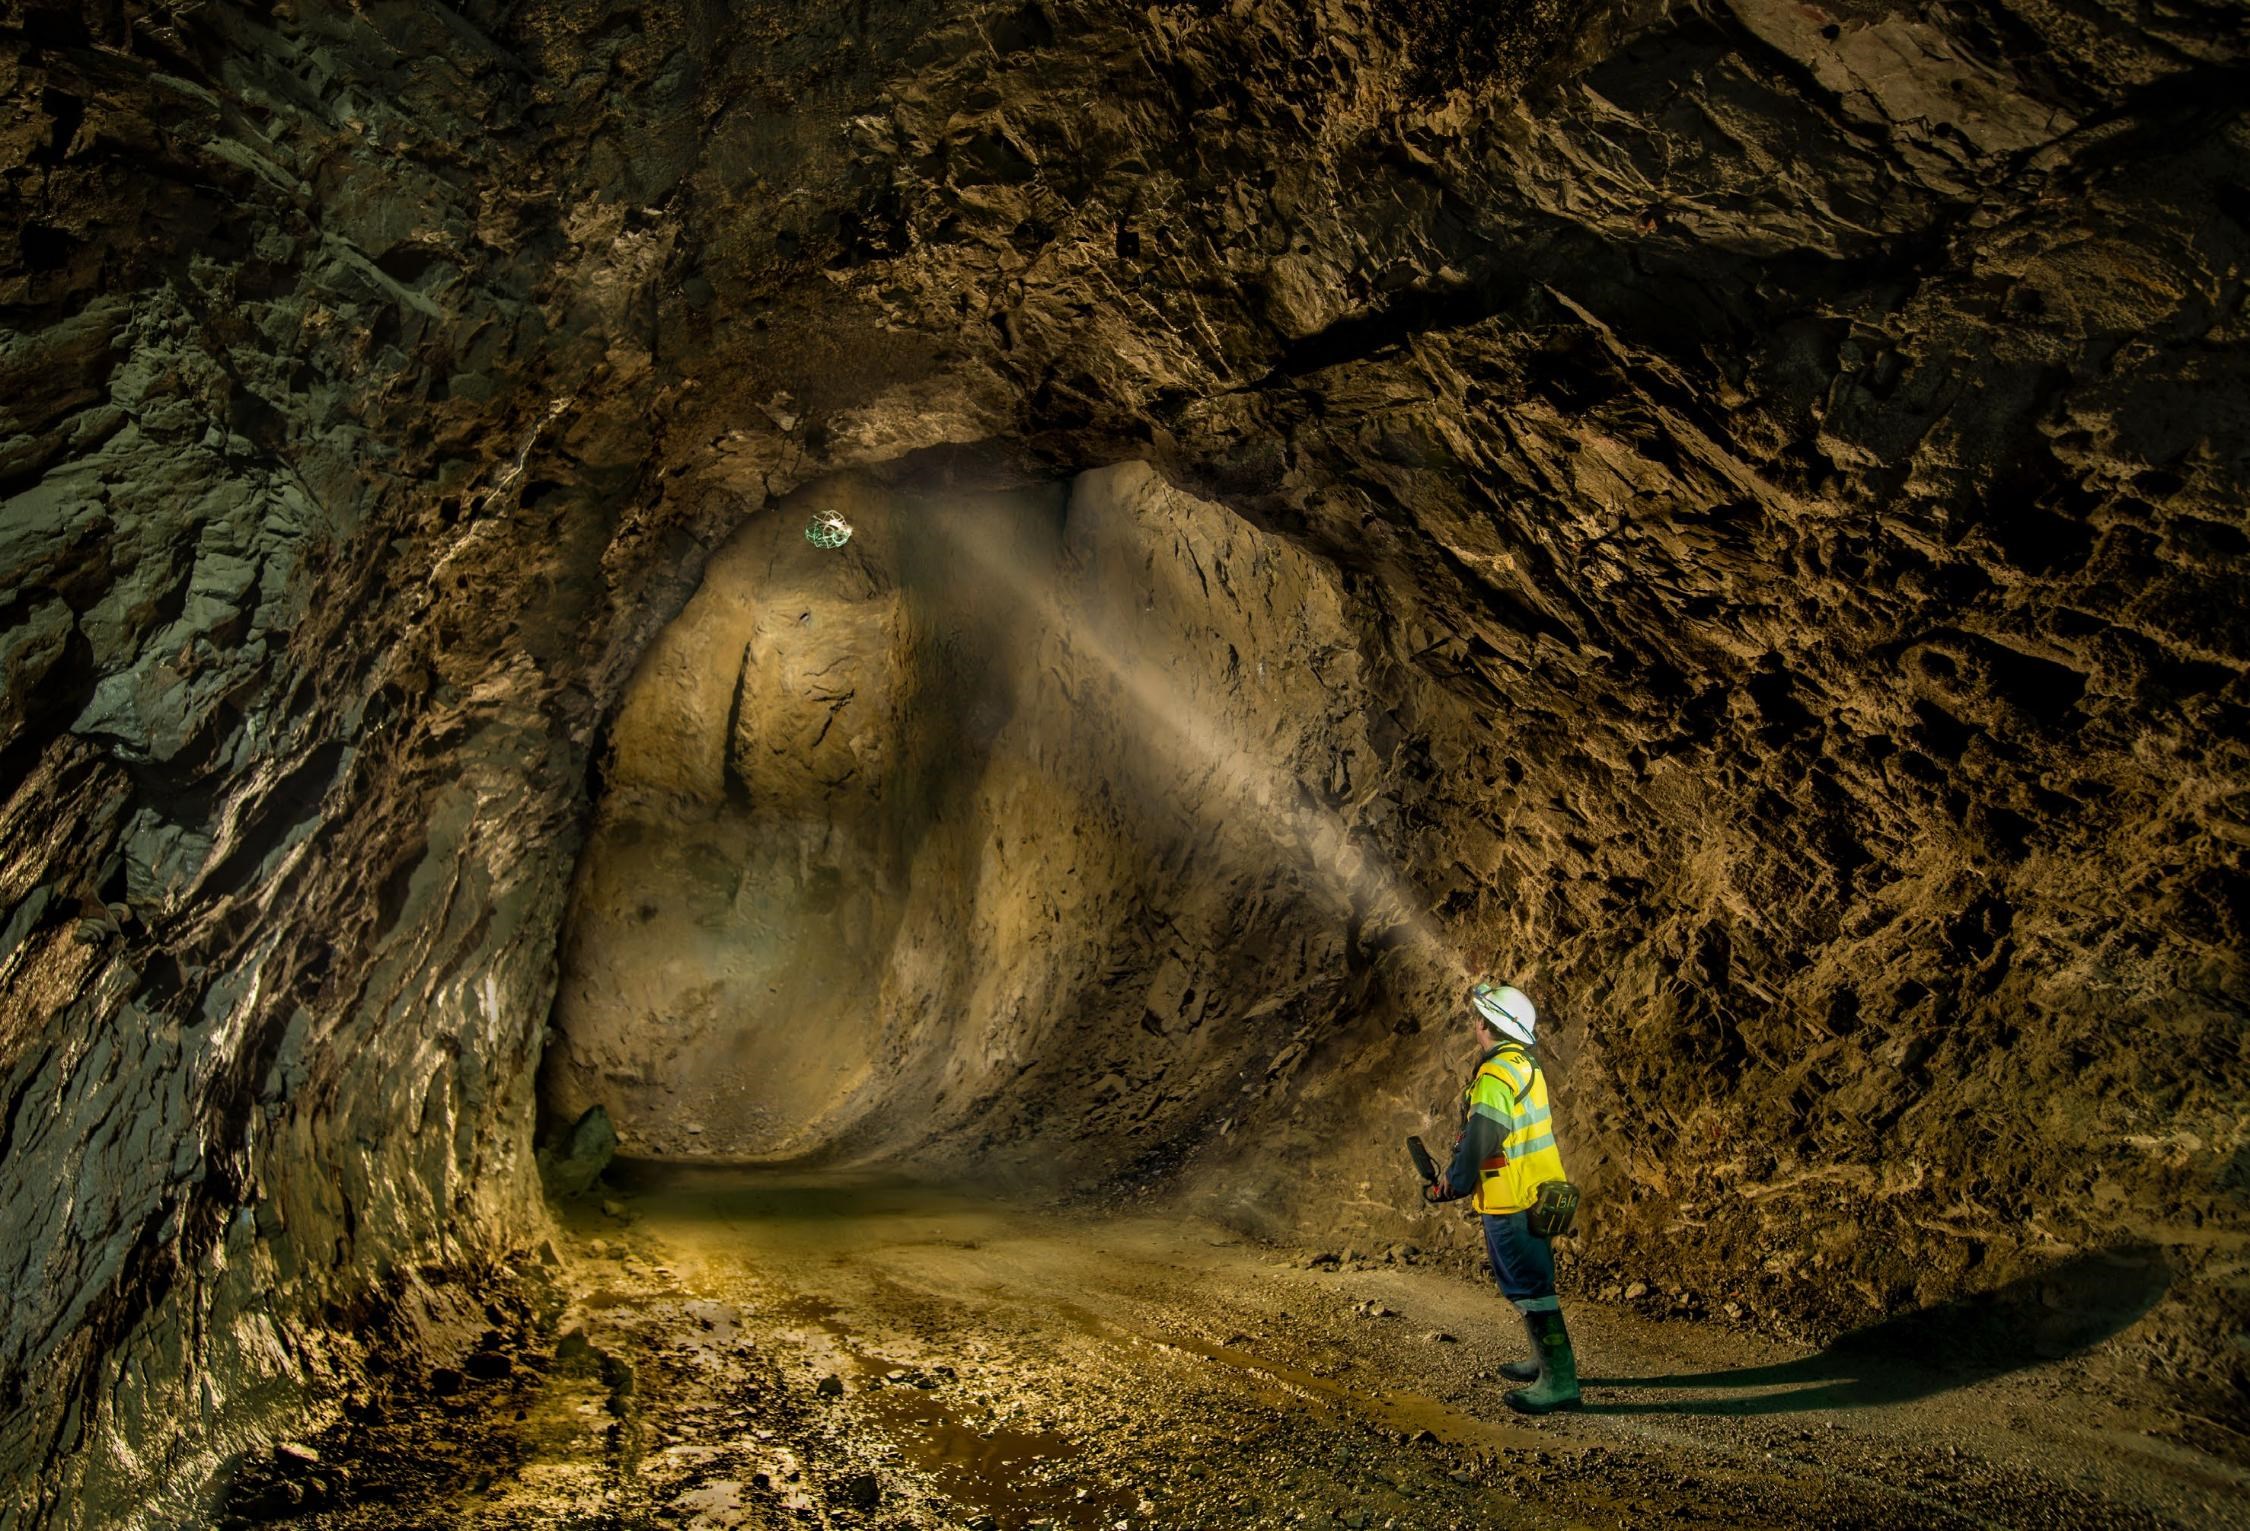
Underground Surveyor, Jose Cadillo, using an Elios 111 Lidar drone to quantify the monthly stope extraction at the 1,395-metre level of the Big Zinc orebody.
To view an enhanced version of this graphic, please visit:
https://images.newsfilecorp.com/files/3396/272406_84af4aec2403f89c_010full.jpg
ZINC PRODUCTION AND CASH COST GUIDANCE FOR 2025
| Kipushi 2025 Guidance | |
| Contained zinc in concentrate (tonnes) | 180,000 to 240,000 |
| Cash cost (C1) ($ per pound of payable zinc) | 0.90 to 1.00 |
| Capital Expenditure ($ million) | 80 |
Guidance figures are on a 100% project basis.
Kipushi's 2025 zinc production, capital expenditure and cash cost (C1) guidance is based on several assumptions and estimates of known and unknown risks, uncertainties, and other factors that may cause the actual results to differ materially, including the ramp-up of the concentrator, reliability of DRC grid power supply, the timing and successful ramp up following the debottlenecking program, and prevailing logistics rates, among other variables. Metal reported in concentrate is before treatment losses or payability deductions associated with smelter terms.
Kipushi Mine produced a total of 141,724 tonnes of zinc for the nine months ended September 30, 2025. The Kipushi mine's cash cost (C1) per pound of payable zinc sold averaged $0.95/lb. for the nine months ended September 30, 2025. Kipushi's operations are on track to meet the original 2025 guidance ranges for production and cash cost (C1). The Kipushi Mine's capital expenditure for the nine months ended September 30, 2025, is $63 million, and the 2025 capital expenditure guidance was increased by $10 million to $80 million.
Cash cost (C1) is a non-GAAP measure used by management to evaluate operating performance and includes all direct mining, processing, stockpile rehandling charges, and general and administrative costs. Smelter charges and freight deductions on sales to the final port of destination, which are recognized as a component of sales revenues, are added to cash cost (C1) to arrive at an approximate cost of delivered finished metal.
For historical comparatives and a reconciliation to the most directly comparable measure under IFRS, see the non-GAAP Financial Performance Measures section of the company's MD&A for the three and nine months ended September 30, 2025.
3. Platreef Mine
64%-owned by Ivanhoe Mines
South Africa
The Platreef Mine is located on the Northern Limb of the Bushveld Igneous Complex in Limpopo Province - approximately 280 kilometres northeast of Johannesburg and eight kilometres from the town of Mokopane in South Africa. The project is owned by Ivanplats (Pty) Ltd. (Ivanplats), which is 64%-owned by Ivanhoe Mines. A 26% interest is held by Ivanplats' historically disadvantaged, broad-based, black economic empowerment (B-BBEE) partners, which include 20 local host communities with approximately 150,000 people, project employees, and local entrepreneurs. The remaining 10% interest is held by a Japanese consortium, consisting of ITOCHU Corporation, Japan Oil, Gas and Metals National Corporation (JOGMEC), and Japan Gas Corporation.
Platinum-group metals (PGM) mineralization in the Northern Limb is primarily hosted within a 30-kilometre mineralized sequence called the Platreef. The Platreef Mine is contiguous with, and along strike from, Valterra's (formerly known as Anglo Platinum) Mogalakwena PGM operations. The Platreef Mine hosts an underground deposit of platinum-group metals, nickel, copper, and gold mineralization, called the Flatreef deposit. The Flatreef is a thick, relatively flat-lying and high-grade orebody, which is amenable to highly mechanized, highly productive, underground bulk mining methods.
Since 2007, Flatreef has become one of the largest undeveloped precious metals deposits globally, with 56 million ounces in platinum equivalent Indicated Mineral Resources and 74 million ounces in platinum equivalent Inferred Mineral Resources, at a 2.0 g/t platinum, palladium, rhodium, and gold (3PE + AU) cut-off. The Flatreef is also host to one of the world's largest undeveloped nickel sulphide mineral resources.
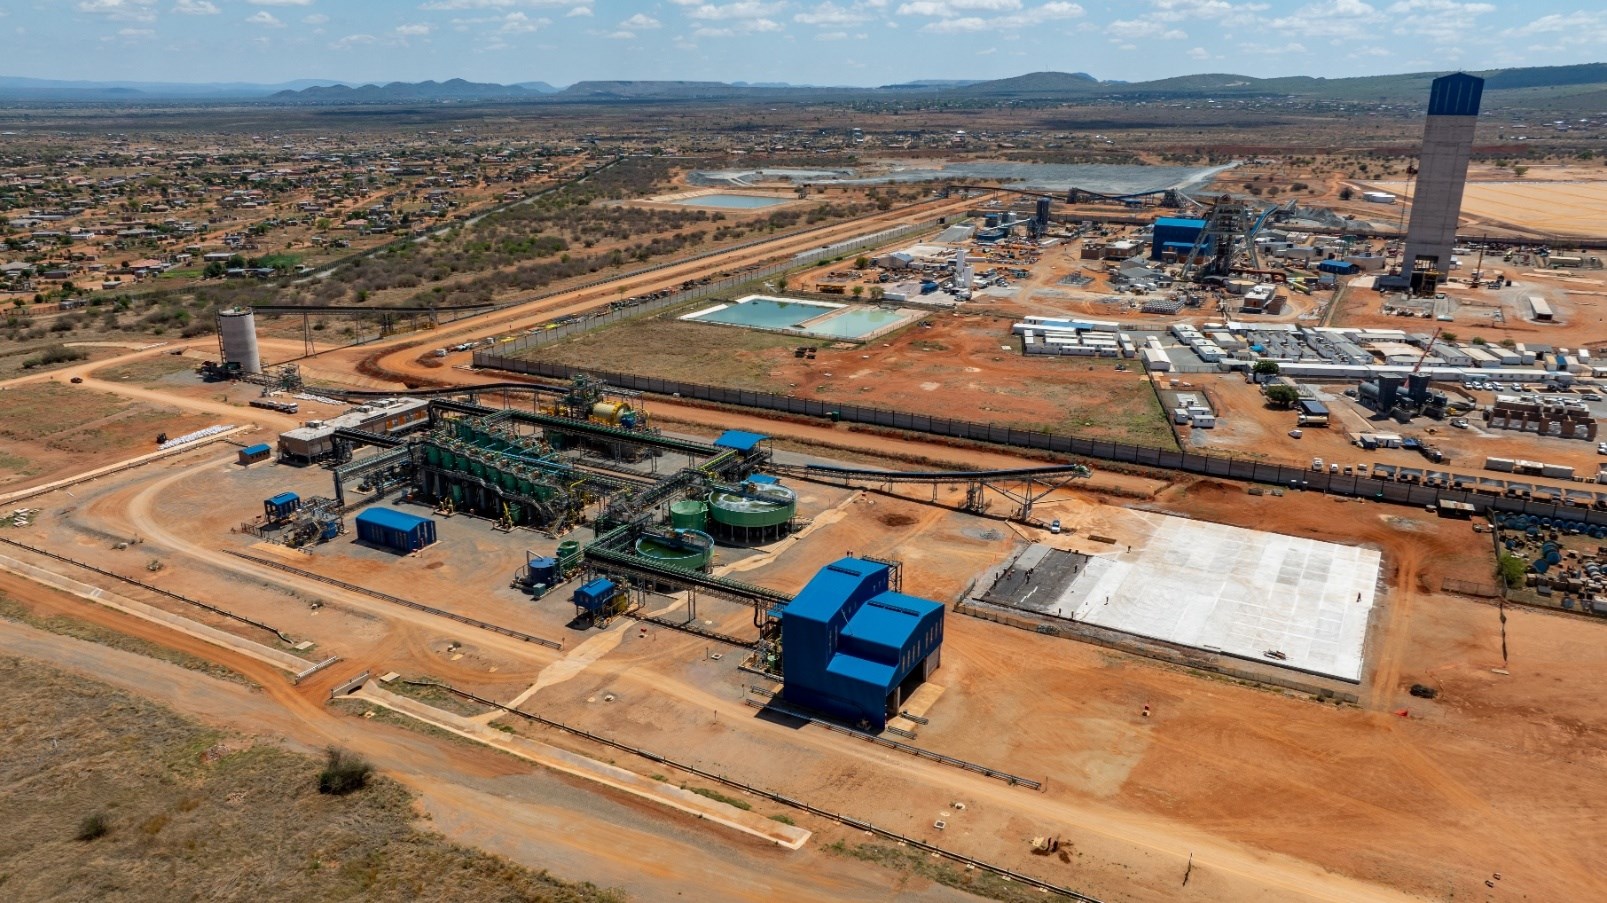
Aerial view of the Platreef Mine site, with Phase 1 concentrator in the foreground and the Shafts #1, #2 and #3, and associated surface infrastructure in the background.
To view an enhanced version of this graphic, please visit:
https://images.newsfilecorp.com/files/3396/272406_84af4aec2403f89c_012full.jpg
First feed of ore into the Platreef Mine's Phase 1 concentrator took place in October 2025
The Platreef Mine's Phase 1 concentrator commenced the final stages of hot commissioning on October 29, 2025 with the first feed of platinum-palladium-nickel-gold-rhodium-copper ore. The concentrator was completed on schedule in June 2024, and has been kept under a regular care and maintenance program since. The first production of concentrate is expected within the coming weeks.
As announced on May 8, 2025, underground development of the thick, high-grade Flatreef platinum-palladium-nickel-gold-rhodium-copper orebody on the 850-metre level commenced on April 30, 2025. Since then, to September 30, 2025, a total of 165 metres of reef development in ore has been completed, and of the total 17,125 tonnes of ore blasted, 10,215 tonnes have been hoisted to surface. Reef development on the 750-metre level has also recently commenced. Development ore continues to be hoisted to surface via Shaft #1 and stored in surface stockpiles. The lower-grade development ore stockpiles will be used to feed the 0.8 Mtpa Phase 1 concentrator during the initial stages of ramp-up.
Equipping of Shaft #3 continues to progress well and is on schedule for completion in Q1 2026. Long hole stoping (production mining) is expected to commence in early Q2 2026, once Shaft #3 is commissioned and is ready to hoist in March 2026.
The underground delineation drilling program, which commenced last year ahead of developing the first long-hole ore blocks, has progressed very well, with a total of 16,110 metres drilled to date. All assays reconcile well with Ivanplats' geological models and mine plan.
Recruitment continues ahead of the ramp-up of Phase 1, with the Ivanplats workforce now over 2,200 employees and contractors, including more than 70% locally based and 26% female. The workforce will continue to grow as the project team has recently started development work on Phase 2.
Project development on Phase 2 expansion is already underway, targeting completion in Q4 2027
The Ivanplats' project team has commenced work on Phase 2 development, with the concentrator expansion targeted for completion in Q4 2027. DRA Global of Perth, Australia, was recently appointed as the EPCM contractor for the mine and the 3.3-million-tonne-per-annum Phase 2 concentrator. DRA Global was the EPCM contractor that delivered the construction of the Phase 1 concentrator on schedule in June 2024. Earthworks on the Phase 2 concentrator site, located adjacent to the Phase 1 concentrator, are scheduled to commence in Q1 2026.
In addition, Shaft #2's concrete headgear is now completed, and the expansion of the shaft to a diameter of 10 metres will commence following the appointment of the contractor in Q4 2025. Raise boring of Shaft #2 to its initial diameter of 3.1 metres was completed in Q4 2024.
Negotiations for Platreef's Phase 2 project finance are advancing well.
In December 2023, Ivanplats concluded a senior debt facility with Société Générale and Nedbank Limited to fund the construction of Phase 1. An initial $70 million was drawn, with a further $30 million drawn in the second quarter of 2025.
Following the completion of the 4.1 Mtpa feasibility study, Ivanhoe Mines has been focused on arranging an enlarged project finance package for the majority of the expansion capital requirements for Phase 2.
Negotiations are advancing well for a $700 million Phase 2 senior project finance facility. Ivanhoe is anticipating that the new financing will be in place during Q1 2026.
Financing for the future Phase 3 expansion is expected to be underpinned by cash flow generated from Platreef's Phase 1 and 2 operations.
The Platreef Mine is set to be one of the largest and lowest-cost producers of platinum, palladium, rhodium, and gold, with nickel and copper byproducts.
On February 18, 2025, two independent studies were completed on the three-phase development of the Platreef Mine. This included an updated Feasibility Study on the Phase 2 expansion to 4.1 million tonnes per annum (Mtpa) of processing capacity, as well as a Preliminary Economic Assessment covering a new Phase 3 expansion to 10.7 Mtpa of processing capacity. The excellent results from both studies reinforce the multi-generational Platreef Mine's industry-leading margins.
The Platreef Mine is projected to be the lowest-cost primary platinum-group-metals producer globally. The Phase 2 life-of-mine total cash cost is estimated to be $599 per ounce of 3PE+Au, net of nickel and copper by-product credits. Life-of-mine total cash costs are projected to fall further to $511 per ounce of 3PE+Au following the Phase 3 expansion. This compares very favourably with a basket spot price of approximately $1,900 per ounce. of 3PE+Au, as at October 24, 2025. The Platreef Mine's low cash costs are primarily due to its unique thick orebody, which enables economies of scale, as well as the high grades of nickel and copper that are payable by-products.
Following the Phase 3 expansion, as shown in Figure 4, the Platreef Mine is expected to be one of the world's largest primary platinum group metal producers on a platinum-equivalent basis.
First production from the Phase 1 concentrator is expected in Q4 2025, ramping up to an annualized production of approximately 100,000 ounces of 3PE+Au. Development has already commenced on the Phase 2 expansion, which is expected to be completed 2 years later in Q4 2027. Annualized production increases almost five-fold following the Phase 2 expansion to over 460,000 ounces of 3PE+Au, plus approximately 9,000 tonnes of nickel and 6,000 tonnes of copper. The Phase 3 expansion further doubles annualized production to over 1 million ounces of 3PE+Au, plus approximately 22,000 tonnes of nickel and 13,000 tonnes of copper.
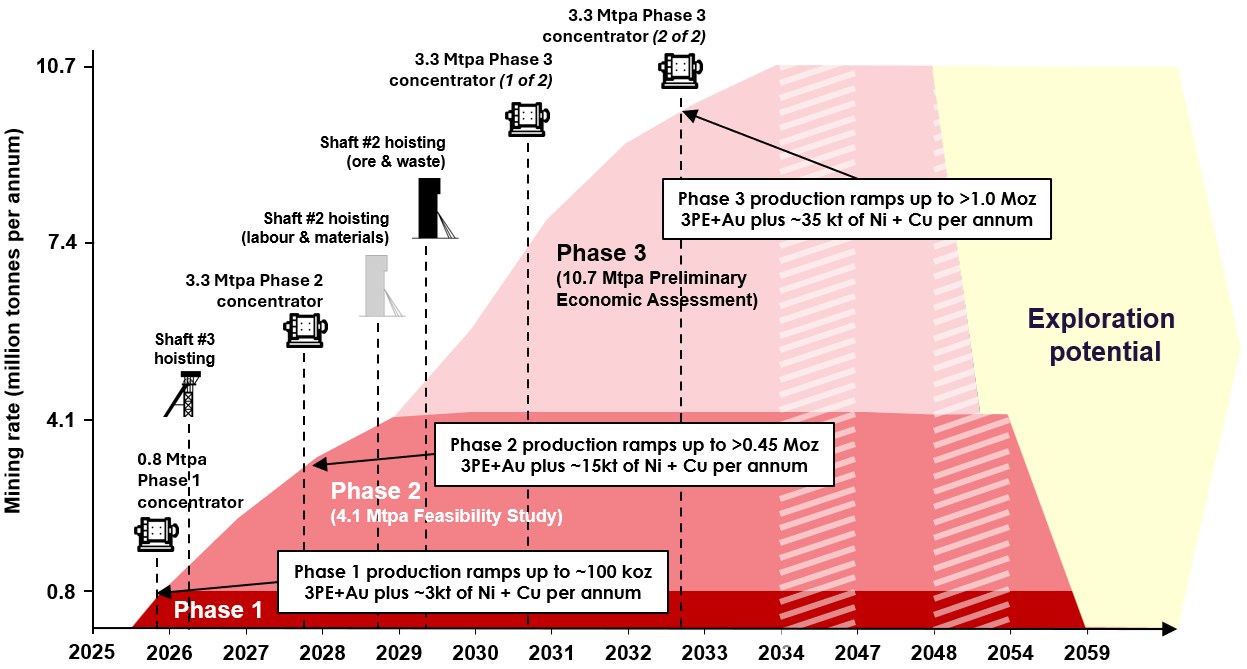
Figure 4: Phased development schematic of the Platreef Mine, showing the annualized mining rate over the life of mine.
To view an enhanced version of this graphic, please visit:
https://images.newsfilecorp.com/files/3396/272406_84af4aec2403f89c_013full.jpg
Shaft #3 head gear assembly and rock winder installation are advancing well, with the mechanical installation of the rock winder (pictured below) nearing completion. Shaft #3 is on schedule to be ready to hoist in Q1 2026.
To view an enhanced version of this graphic, please visit:
https://images.newsfilecorp.com/files/3396/272406_84af4aec2403f89c_014full.jpg
Significant increase in platinum and palladium prices boosts project value by over 50%
The year-to-date increases in the spot prices for platinum and palladium are approximately 78% and 60%, respectively. In reference to the sensitivity tables included in the 2025 Platreef Integrated Development Plan, which was filed on March 31, 2025, the net present value (NPV8%) of the Feasibility Study at spot prices would be 52% higher, or $2.1 billion. The NPV8% of the Preliminary Economic Assessment (PEA), which includes the Phase 3 expansion, would also increase at spot prices by 44% to $4.6 billion. This is based on platinum and palladium price assumptions of $1,550 and $1,450 per ounce, respectively, and excludes any changes in copper, gold, or rhodium prices.
Installation of a new underground crushing plant is advancing well. The new crusher is part of the Shaft #3 underground infrastructure that enables ore and waste to be crushed prior to it being hoisted to surface, reducing surface noise.
To view an enhanced version of this graphic, please visit:
https://images.newsfilecorp.com/files/3396/272406_84af4aec2403f89c_015full.jpg
4. Global Exploration Portfolio
Western Forelands Exploration Project, DRC
54%- to 100%-owned by Ivanhoe Mines
The Western Forelands Exploration Project consists of a licence package covering 2,390 km2 adjacent to the Kamoa-Kakula Copper Complex. The area of the Western Forelands licence package is approximately six times larger than that of the Kamoa-Kakula Copper Complex.
Drilling efforts during the third quarter focused on the existing Makoko District, which includes Makoko, Makoko West and Kitoko, as well as the new targets of Tshipaya and Kamilli, which are located on a new licence area acquired in late 2024, as shown in Figure 5. A total of 11,764 metres of drilling were completed, across 13 diamond holes and 30 reverse circulation holes.
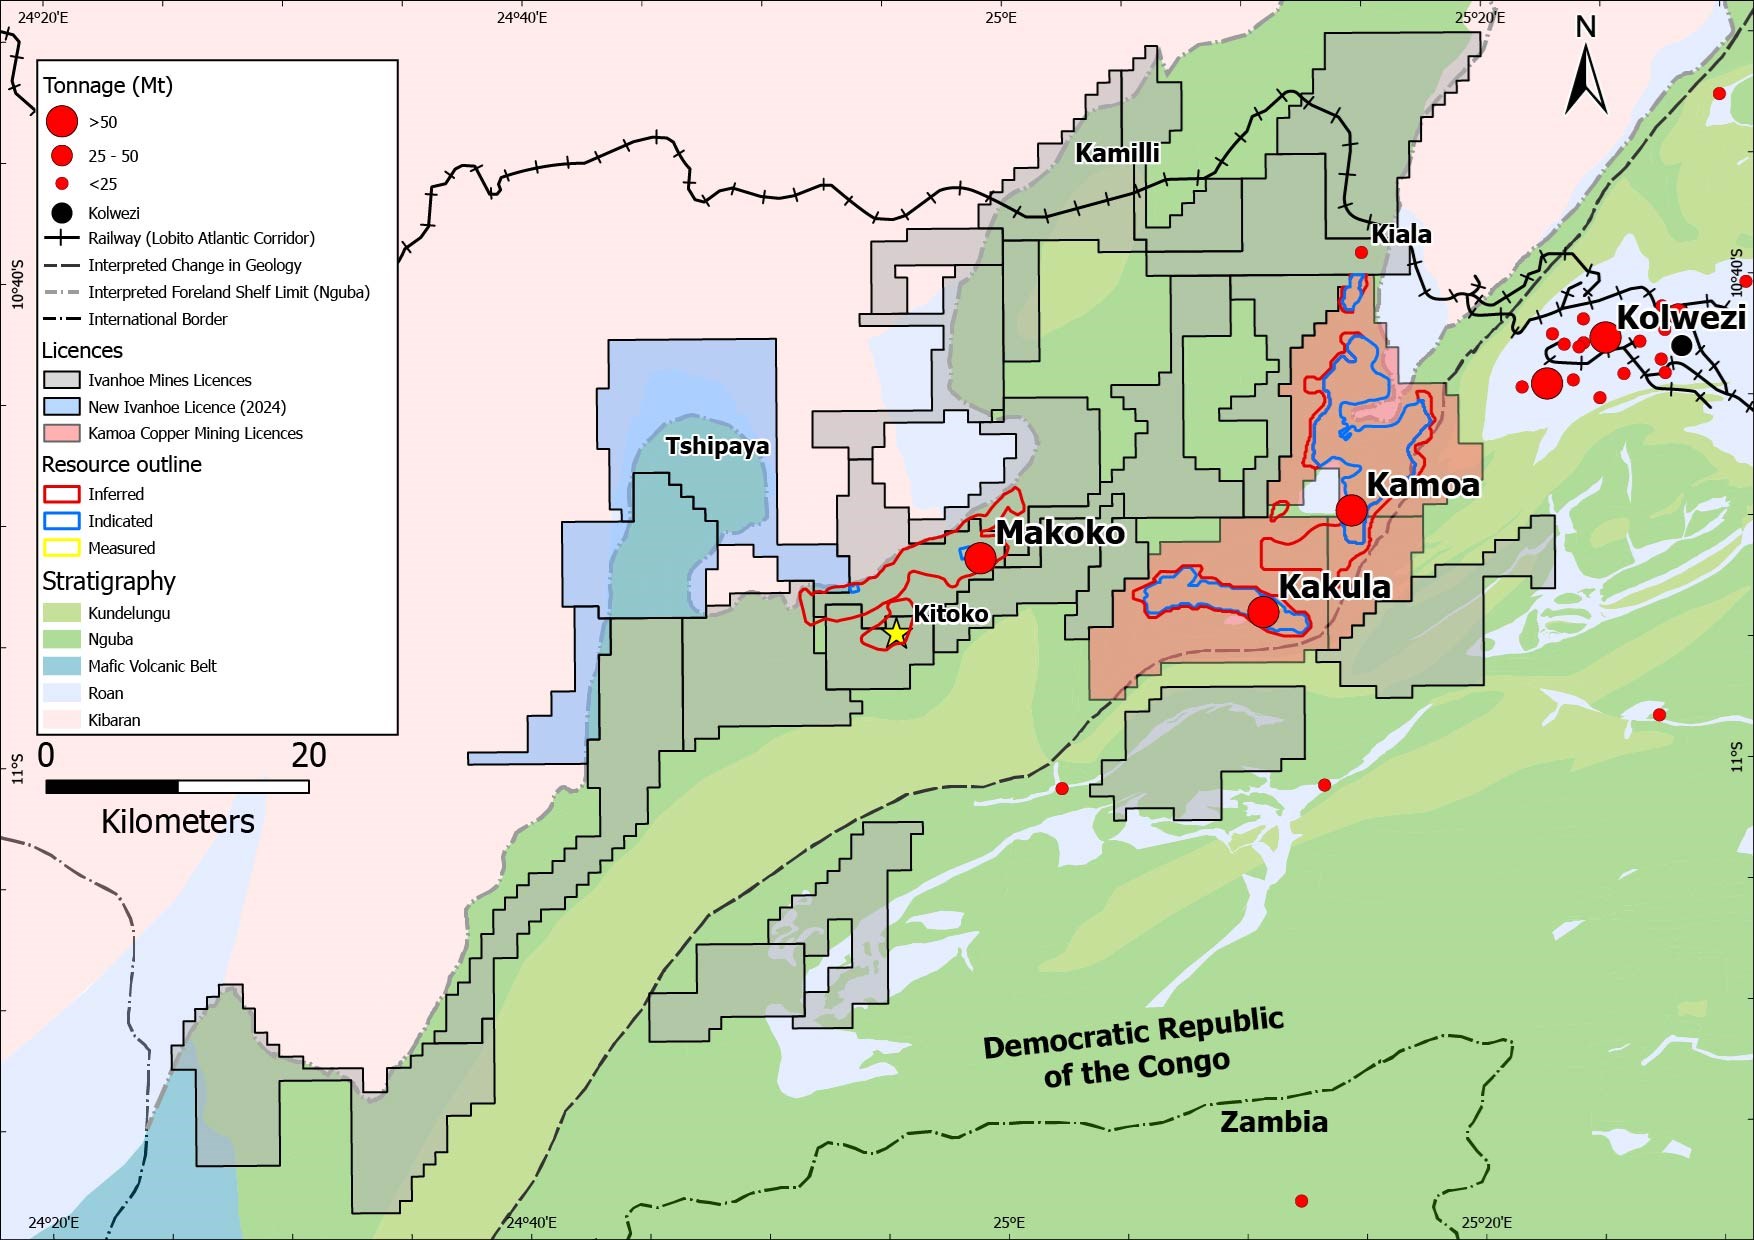
Figure 5. Map of the Western Forelands licence area, adjacent to Kamoa-Kakula and Kolwezi mining area
To view an enhanced version of this graphic, please visit:
https://images.newsfilecorp.com/files/3396/272406_84af4aec2403f89c_016full.jpg
The Makoko District drilling program was primarily focused on wide-spaced, step out drilling to continue to delineate the extent of mineralization. Notably, drilling to the east of the Makoko District has identified an extension of mineralization that will continue to be tested for continuity during the fourth quarter. For the third year in a row, preparations have been made to continue Makoko District drilling throughout the wet season, which is expected to commence imminently and last until May next year. An updated Mineral Resource for the Makoko District is planned for 2026.
Drilling at the Tshipaya target commenced in the quarter, with drilling targeted elevated copper geochemical anomalies from previously collected soil samples. In addition, stratigraphic holes were drilled to determine the thickness and characteristics of the Western Foreland shelf sedimentary sequence in this new region. Visual inspections of the core indicate that a copper mineralizing fluid system is active in this new region.
Also, in the Tshipaya region, a ground gravity survey began in August. Ground gravity surveys are effective, under the right conditions, at picking up subtle changes in rock densities. The survey was very effective at delineating the high-grade structures at Kiala in 2023.
Reverse circulation (RC) drilling at the Kamilli target was used to test and sample the primary rocks below the Kalahari sand cover. The Kalahari sand cover can be up to 40 metres thick, obscuring any geochemical signatures of mineralization below it. The samples collected are then analyzed by multi-element methods, which is the same method used to analyse soil samples, to identify geochemical targets under the sand cover. The reverse circulation drilling will continue for as long into the fourth quarter as possible, until access becomes inhibited due to the wet season.
An Audio-frequency Magnetotellurics (AMT) survey across the Western Foreland Shelf, which began in May, was completed in July. The results are currently being reviewed.
North-Western Province, Zambia
100%-owned by Ivanhoe Mines
Ivanhoe Mines was awarded a highly strategic 7,757 km² exploration licence package in Zambia's North-Western Province on April 14, 2025, over an area considered highly prospective for copper discoveries in Zambia. This significant landholding is over three times the size of Ivanhoe's Western Forelands Exploration Project and is ideally situated between the company's existing DRC assets and its Angolan exploration licences positioning Ivanhoe to unlock the next generation of copper discoveries in this underexplored region.
The new licences are underpinned by a compelling geological thesis that the prolific Central African Copperbelt extends southwest into Zambia and Angola below Kalahari sand cover. Ivanhoe's exploration team is targeting multiple high-potential mineralization styles, including Basement Domes, Katangan-age sediment-hosted copper systems, and iron-oxide-copper-gold (IOCG) systems.
During Q3 2025, Ivanhoe initiated stakeholder engagements for completion of Environmental Project Briefs (EPBs) across the licence area. The company has also acquired and initiated analysis of historical geophysical and geological data from previous operators. This work will be complemented by high-resolution government geophysical datasets once it is made available and follow-up ground geophysics programmes in 2026.
Field-based exploration including diamond drilling is expected to commence in Q2 2026 at the end of the 2026 rainy season, once approval of the EPBs by the Zambian Environmental Management Authority (ZEMA) has been granted.
Moxico and Cuando Cubango Provinces, Angola
100%-owned by Ivanhoe Mines
Ivanhoe Mines is leveraging its proven exploration expertise from the Western Forelands and Kamoa-Kakula to unlock a major new frontier in Angola. The company has secured approximately 22,000 km² of highly prospective exploration licences in the Moxico and Cuando Cubango provinces, one of the largest greenfield sediment-hosted copper exploration packages in the region.
Following the signing of a mining investment contract with Angola's National Agency for Mineral Resources on November 27, 2023, early-stage exploration included airborne magnetic and airborne gravity geophysical mapping of the full 22,000 km2 licence package in June 2024. Ivanhoe's team initiated fieldwork in August 2024 completing a 600 km² baseline soil geochemical sampling program. Field work has concentrated on the eastern licences, complemented by ground-based geophysical work, including Audio-frequency Magnetotellurics (AMT), Magnetotellurics (MT), and Passive Seismic surveys.
These efforts have already yielded promising results. Several high-priority drill targets have been identified, and two rigs were mobilized in Q3 2025 for a 6,400-metre stratigraphic diamond drilling program, with drilling set to begin in the fourth quarter. This marks a significant step forward in Ivanhoe's strategy to expand its copper footprint across Africa.
In the quarter, medical staff attached to Ivanhoe Mines' field team assisted the local administration in a vaccination drive reaching 41 villages in the Ninda district towards the Zambian border. 8 different types of vaccines were administered with 1,031 children under 5 years receiving Polio vaccinations, and 227 children received MMR vaccinations.
The Chu-Sarysu Basin Exploration Joint Venture, Central Kazakhstan
20%-owned by Ivanhoe Mines
Ivanhoe Mines has established a strategic exploration joint venture with UK-based Pallas Resources to unlock the potential of the Chu-Sarysu Copper Basin in Kazakhstan. The basin is recognised as the world's third-largest sediment-hosted copper district. The partnership covers a vast and highly prospective 16,708 km² licence area, enriched by a comprehensive archive of Soviet-era exploration data.
Under the agreement announced on February 12, 2025, Ivanhoe has committed to $18.7 million in exploration funding over an initial two-year period, with the option to increase its ownership stake to 80% through staged earn-in milestones.
Exploration activities commenced in Q1 2025, including the recruitment of a dedicated exploration team and the initiation of drilling and airborne geophysics programs. By July, two rigs were mobilized for a 17,500-metre maiden diamond drilling campaign, with 2,374 metres completed to date, including copper mineralisation visible in one of the holes two completed. In parallel, extensive geophysical and geochemical surveys are underway across the licence area, positioning the joint venture to rapidly advance its understanding of this underexplored, high-potential copper district.
Mokopane Feeder Project, South Africa
100%-owned by Ivanhoe Mines
Ivanhoe Mines is advancing exploration on the Northern Limb of South Africa's Bushveld Complex, adjacent to Ivanplats' flagship Platreef Mine. The company is targeting a significant gravity-high anomaly interpreted as a potential massive nickel-copper sulphide primary feeder zone for the region's rich mineralization, including the world-class Flatreef deposit.
Following the completion of comprehensive geological and geophysical data analysis in early 2024, Ivanhoe has identified multiple high-priority drill targets. A 6,000-metre diamond drilling program commenced in Q1 2025, with 3,300 metres completed across two holes to date.
In Q3, a downhole geophysical survey was completed on the initial 2,000-metre hole. A second hole, with a depth of 1,300 metres was also completed, with a downhole geophysics survey scheduled to start in the fourth quarter before the drill rig is remobilised to the next target site. These efforts are expected to further refine the geological model and unlock the broader potential of this highly prospective area.
SELECTED QUARTERLY FINANCIAL INFORMATION
The following table summarizes selected financial information for the prior eight quarters. Revenue from commercial production at the Kipushi Mine commenced in Q4 2024. All revenue from production at Kamoa-Kakula is recognized within the Kamoa Holding joint venture. Ivanhoe did not declare or pay any dividend or distribution in any financial reporting period.
| Three months ended | ||||
| September 30, | June 30, | March 31, | December 31, | |
| 2025 | 2025 | 2025 | 2024 | |
| $'000 | $'000 | $'000 | $'000 | |
| Revenue | 129,403 | 96,757 | 77,020 | 40,818 |
| Cost of sales | (122,151) | (100,217) | (81,771) | (51,563) |
| Share of profit from joint venture | 11,305 | 15,704 | 107,948 | 73,620 |
| Finance income | 43,855 | 43,583 | 41,623 | 56,041 |
| Deferred tax recovery | 3,169 | 7,842 | 4,374 | 12,663 |
| General administrative expenditure | (2,068) | (10,378) | (9,957) | (19,633) |
| Exploration and project evaluation expenditure | (10,324) | (8,585) | (9,145) | (15,845) |
| Finance costs | (20,920) | (4,947) | (7,838) | (6,849) |
| Share-based payments | (6,194) | (4,447) | (2,418) | (2,977) |
| Profit (loss) attributable to: | ||||
| Owners of the Company | 33,057 | 44,051 | 129,760 | 99,344 |
| Non-controlling interests | (2,505) | (8,726) | (7,560) | (11,338) |
| Total comprehensive income (loss) attributable to: | ||||
| Owners of the Company | 55,839 | 60,900 | 135,033 | 60,964 |
| Non-controlling interest | (3) | (7,066) | (7,161) | (15,158) |
| Basic profit per share | 0.02 | 0.03 | 0.10 | 0.07 |
| Diluted profit per share | 0.02 | 0.03 | 0.10 | 0.07 |
| Three months ended | ||||
| September 30, | June 30, | March 31, | December 31, | |
| 2024 | 2024 | 2024 | 2023 | |
| $'000 | $'000 | $'000 | $'000 | |
| Share of profit from joint venture | 83,507 | 89,616 | 45,165 | 49,272 |
| Finance income | 60,164 | 62,873 | 62,457 | 63,110 |
| Loss on fair valuation of embedded derivative liability | (4,171) | (20,727) | (139,271) | (39,961) |
| General administrative expenditure | (10,573) | (12,345) | (14,001) | (14,947) |
| Finance costs | (471) | (32,871) | (8,944) | (6,741) |
| Share-based payments | (7,504) | (8,505) | (8,933) | (7,715) |
| Exploration and project evaluation expenditure | (12,813) | (10,589) | (8,901) | (8,637) |
| Deferred tax recovery | 575 | 1,398 | 3,221 | 4,201 |
| Profit (loss) attributable to: | ||||
| Owners of the Company | 117,942 | 76,401 | (65,552) | 27,739 |
| Non-controlling interests | (9,760) | (9,885) | (3,858) | (1,980) |
| Total comprehensive income (loss) attributable to: | ||||
| Owners of the Company | 141,525 | 88,223 | (73,648) | 37,155 |
| Non-controlling interest | (7,469) | (8,672) | (4,728) | (1,003) |
| Basic profit (loss) per share | 0.09 | 0.06 | (0.05) | 0.02 |
| Diluted profit (loss) per share | 0.09 | 0.06 | (0.05) | 0.02 |
DISCUSSION OF RESULTS OF OPERATIONS
Review of the three months ended September 30, 2025 vs. September 30, 2024
The company recorded a profit for Q3 2025 of $31 million and a total comprehensive income of $56 million compared to a profit of $108 million and a total comprehensive income of $134 million for the same period in 2024. The decrease in profit is mainly due to the lower share of profit from the Kamoa Holding joint venture in Q3 2025, primarily due to lower volumes of copper in concentrate sold. Production at Kamoa-Kakula has been impacted by the seismic activity and subsequent flooding on the eastern side of the Kakula Mine since May 2025, which has resulted in production rates being curtailed, and lower volumes of copper in concentrate sold as a result.
The Kamoa-Kakula Copper Complex sold 61,528 tonnes of payable copper in Q3 2025 realizing revenue of $566 million for the Kamoa Holding joint venture, compared to 103,106 tonnes of payable copper sold for revenue of $828 million for the same period in 2024. The company recognized income in aggregate of $47 million from the joint venture in Q3 2025 and $141 million for the same period in 2024, which can be summarized as follows:
| Three months ended | ||
| September 30, | ||
| 2025 | 2024 | |
| $'000 | $'000 | |
| Company's share of profit from joint venture | 11,305 | 83,507 |
| Interest on loan to joint venture | 35,905 | 57,077 |
| Company's income recognized from joint venture | 47,210 | 140,584 |
The company's share of profit from the Kamoa Holding joint venture was $72 million less in Q3 2025 compared to the same period in 2024 and is broken down in the following table:
| Three months ended | ||
| September 30, | ||
| 2025 | 2024 | |
| $'000 | $'000 | |
| Revenue from contract receivables | 555,293 | 836,871 |
| Remeasurement of contract receivables | 11,072 | (8,983) |
| Revenue | 566,365 | 827,888 |
| Cost of sales | (438,230) | (408,919) |
| Gross profit | 128,135 | 418,969 |
| General and administrative costs | (54,966) | (22,260) |
| Amortization of mineral property | (4,584) | (4,507) |
| Profit from operations | 68,585 | 392,202 |
| Finance costs | (110,781) | (83,815) |
| Foreign exchange gain (loss) | 70,113 | (4,232) |
| Finance income and other | 5,926 | 5,737 |
| Profit before taxes | 33,843 | 309,892 |
| Current tax recovery (expense) | 47,648 | (125,852) |
| Deferred tax (expense) recovery | (55,469) | 34,093 |
| Profit after taxes | 26,022 | 218,133 |
| Non-controlling interest of Kamoa Holding | (3,184) | (49,431) |
| Total comprehensive income for the period attributable to the owners of the joint venture | 22,838 | 168,702 |
| Company's share of profit from joint venture (49.5%) | 11,305 | 83,507 |
Cost of sales of the joint venture includes costs relating to the dewatering of the Kakula mine incurred during the three months ended September 30, 2025, that were excluded from the inventory valuation in accordance with IAS 2 and classified within cost of sales for presentation purposes. These costs amounted to $10 million and were deemed abnormal as they did not contribute to production and were not capitalized.
The realized and provisional copper prices used for the remeasurement (mark-to-market) of contract receivables for the three months ended September 30, 2025, and for the same period in 2024, can be summarized as follows:
| Three months ended | ||
| September 30, | ||
| 2025 | 2024 | |
| $'000 | $'000 | |
| Realized during the period - open at the start of the period | ||
| Opening forward price ($/lb.)(1) | 4.50 | 4.32 |
| Realized price ($/lb.)(1) | 4.40 | 4.18 |
| Payable copper tonnes sold | 27,067 | 63,633 |
| Remeasurement of contract receivables ($'000) | (5,850) | (20,442) |
| Realized during the period - new copper sold in the current period | ||
| Provisional price ($/lb.)(1) | 4.41 | 4.15 |
| Realized price ($/lb.)(1) | 4.44 | 4.14 |
| Payable copper tonnes sold | 43,340 | 68,725 |
| Remeasurement of contract receivables ($'000) | 2,529 | (2,088) |
| Open at the end of the period - open at the start of the period | ||
| Opening forward price ($/lb.)(1) | 4.48 | - |
| Closing forward price ($/lb.)(1) | 4.72 | - |
| Payable copper tonnes sold | 11,126 | - |
| Remeasurement of contract receivables ($'000) | 5,877 | - |
| Open at the end of the period - new copper sold in current period | ||
| Provisional price ($/lb.)(1) | 4.51 | 4.23 |
| Closing forward price ($/lb.)(1) | 4.72 | 4.41 |
| Payable copper tonnes sold | 18,188 | 34,382 |
| Remeasurement of contract receivables ($'000) | 8,516 | 13,547 |
| Total remeasurement of contract receivables ($'000) | 11,072 | (8,983) |
(1) Calculated on a weighted average basis
The finance costs recognized in the Kamoa Holding joint venture can be broken down as follows:
| Three months ended | ||
| September 30, | ||
| 2025 | 2024 | |
| $'000 | $'000 | |
| Interest on shareholder loans | 72,501 | 118,364 |
| Interest on provisional and advance payment facilities | 35,363 | 32,121 |
| Interest on syndicated loans | 11,508 | - |
| Interest on bank loans and overdraft facilities | 8,637 | 10,113 |
| Lease liability unwinding | 1,670 | 1,769 |
| Interest on equipment financing facilities | 1,446 | 2,370 |
| Rehabilitation unwinding | 1,411 | - |
| Interest capitalized as borrowing costs | (21,755) | (80,922) |
| 110,781 | 83,815 | |
Ivanhoe's exploration and project evaluation expenditure amounted to $10 million in Q3 2025 and $13 million for the same period in 2024. Exploration and project evaluation expenditure for Q3 2025 related mainly to exploration at Ivanhoe's Western Forelands exploration licences.
Finance income for Q3 2025 amounted to $44 million and was $16 million less than for the same period in 2024 ($60 million). Included in finance income is the interest earned on loans to the Kamoa Holding joint venture to fund past development which amounted to $36 million for Q3 2025, and $57 million for the same period in 2024, and decreased due to the effects of the subscription and set-off agreement entered into by Kamoa Holding and its shareholders in December 2024.
The company sold 49,744 tonnes of payable zinc produced by the Kipushi Mine in the third quarter of 2025, realizing revenue of $129 million at a cost of sales of $122 million. The cost of sales for the quarter also included depreciation and amortization of $18 million.
The realized, provisional, and forward zinc prices used for the remeasurement (mark-to-market) of contract receivables of Kipushi for the three months ended September 30, 2025, can be summarized as follows:
| Q3 2025 | Q2 2025 | |
| $'000 | $'000 | |
| Realized during the period - open at the start of the period | ||
| Opening forward price ($/lb.)(1) | 1.26 | 1.29 |
| Realized price ($/lb.)(1) | 1.25 | 1.31 |
| Payable zinc tonnes sold | 25,986 | 9,690 |
| Remeasurement of contract receivables ($'000) | (864) | 425 |
| Realized during the period - new zinc sold in the current period | ||
| Provisional price ($/lb.)(1) | 1.27 | 1.19 |
| Realized price ($/lb.)(1) | 1.30 | 1.20 |
| Payable zinc tonnes sold | 20,281 | 21,800 |
| Remeasurement of contract receivables ($'000) | 1,466 | 484 |
| Open at the end of the period - new zinc sold in the current period | ||
| Provisional price ($/lb.)(1) | 1.31 | 1.20 |
| Closing forward price ($/lb.)(1) | 1.34 | 1.26 |
| Payable zinc tonnes sold | 29,464 | 21,547 |
| Remeasurement of contract receivables ($'000) | 1,946 | 2,973 |
| Total remeasurement of contract receivables ($'000) | 2,548 | 3,882 |
(1) Calculated on a weighted average basis
Review of the nine months ended September 30, 2025 vs. September 30, 2024
The company recorded a profit of $188 million and a total comprehensive income of $238 million for the nine months ended September 30, 2025, compared to a profit of $105 million and a total comprehensive income of $135 million for the same period in 2024. The main contributor to the profit for both the nine months ended September 30, 2025 and for the same period in 2024 was the company's share of profit from the Kamoa Holding joint venture of $135 million and $218 million respectively. The profit for the nine months ended September 30, 2024, included a loss on fair valuation of embedded derivative liability of $164 million.
The company sold 123,200 tonnes of payable zinc produced by the Kipushi Mine in the nine months ended September 30, 2025 realizing revenue of $303 million at a cost of sales of $304 million. Kipushi's margin is expected to improve as production increases. The cost of sales for the nine months ended September 30, 2025, also included depreciation and amortization of $48 million.
The company's share of profit from the Kamoa Holding joint venture for the nine months ended September 30, 2025, was impacted by the seismic activity on the eastern side of the Kakula Mine in May 2025, which resulted in the suspension of underground mining activities at the Kakula Mine until June 7, 2025, as well as the resulting flooding of the underground mine.
The Kamoa-Kakula Copper Complex sold 273,205 tonnes of payable copper in the nine months ended September 30, 2025 realizing revenue of $2.42 billion for the Kamoa Holding joint venture, compared to 284,161 tonnes of payable copper sold for revenue of $2.26 billion for the same period in 2024. The company recognized income in aggregate of $240 million from the joint venture in the nine months ended September 30, 2025 (2024: $389 million), which can be summarized as follows:
| Nine months ended | ||
| September 30, | ||
| 2025 | 2024 | |
| $'000 | $'000 | |
| Company's share of profit from joint venture | 134,957 | 218,288 |
| Interest on loan to joint venture | 104,912 | 170,591 |
| Company's income recognized from joint venture | 239,869 | 388,879 |
The joint venture recorded an impairment of $68 million in the nine months ended September 30, 2025, of which $59 million was based on the assessment performed during the second quarter, in which specific assets, including fleet, pumps, and other assets impacted by the seismic activity and resulting water inflow, were identified that may be lost or irrecoverable. The impairment recognized in the nine months ended September 30, 2025, also includes $9 million relating to damage caused by a generator fire that occurred in January 2025. The insurance claims relating to these impaired assets are under assessment. No further impairment was recorded during the three months ended September 30, 2025.
Cost of sales of the joint venture includes certain costs incurred during the nine months ended September 30, 2025, that were excluded from the inventory valuation in accordance with IAS 2 and classified within cost of sales for presentation purposes. These costs, amounting to $100 million were deemed abnormal as they did not contribute to production and were not capitalized.
The company's share of profit from the Kamoa Holding joint venture was $135 million for the nine months ended September 30, 2025, compared to a profit of $218 million for the same period in 2024, the breakdown of which is summarized in the following table:
| Nine months ended | ||
| September 30, | ||
| 2025 | 2024 | |
| $'000 | $'000 | |
| Revenue from contract receivables | 2,346,550 | 2,263,184 |
| Remeasurement of contract receivables | 68,501 | 97 |
| Revenue | 2,415,051 | 2,263,281 |
| Cost of sales | (1,531,687) | (1,015,688) |
| Gross profit | 883,364 | 1,247,593 |
| General and administrative costs | (129,573) | (96,000) |
| Amortization of mineral property | (14,379) | (10,343) |
| Profit from operations | 739,412 | 1,141,250 |
| Finance costs | (223,010) | (228,674) |
| Foreign exchange gain (loss) | 53,372 | (25,220) |
| Finance income and other | 16,647 | 10,846 |
| Impairment | (68,202) | - |
| Profit before taxes | 518,219 | 898,202 |
| Current tax expense | (202,436) | (327,171) |
| Deferred tax recovery (expense) | 13,366 | 16,705 |
| Profit after taxes | 329,149 | 587,736 |
| Non-controlling interest of Kamoa Holding | (56,509) | (146,750) |
| Total comprehensive income for the period attributable to the owners of the joint venture | 272,640 | 440,986 |
| Company's share of profit from joint venture (49.5%) | 134,957 | 218,288 |
The realized and provisional copper prices used for the remeasurement (mark-to-market) of contract receivables for the nine months ended September 30, 2025, and for the same period in 2024, can be summarized as follows:
| Nine months ended | ||
| September 30, | ||
| 2025 | 2024 | |
| $'000 | $'000 | |
| Realized during the period - open at the start of the period | ||
| Opening forward price ($/lb.)(1) | 4.01 | 3.86 |
| Realized price ($/lb.)(1) | 4.14 | 3.81 |
| Payable copper tonnes sold | 79,985 | 35,966 |
| Remeasurement of contract receivables ($'000) | 21,811 | (4,014) |
| Realized during the period - new copper sold in the current period | ||
| Provisional price ($/lb.)(1) | 4.29 | 4.15 |
| Realized price ($/lb.)(1) | 4.36 | 4.13 |
| Payable copper tonnes sold | 243,891 | 249,780 |
| Remeasurement of contract receivables ($'000) | 32,914 | (9,436) |
| Open at the end of the period - new copper sold in current period | ||
| Provisional price ($/lb.)(1) | 4.51 | 4.23 |
| Closing forward price ($/lb.)(1) | 4.72 | 4.41 |
| Payable copper tonnes sold | 29,313 | 34,382 |
| Remeasurement of contract receivables ($'000) | 13,776 | 13,547 |
| Total remeasurement of contract receivables ($'000) | 68,501 | 97 |
(1) Calculated on a weighted average basis
The finance costs recognized in the Kamoa Holding joint venture for the nine months ended September 30, 2025 can be broken down as follows.
| Nine months ended | ||
| September 30, | ||
| 2025 | 2024 | |
| $'000 | $'000 | |
| Interest on shareholder loans | 211,839 | 347,622 |
| Interest on provisional and advance payment facilities | 110,696 | 79,893 |
| Interest on syndicated loans | 34,126 | - |
| Interest on bank loans and overdraft facilities | 23,385 | 15,183 |
| Rehabilitation unwinding | 4,423 | - |
| Lease liability unwinding | 5,105 | 5,373 |
| Interest on equipment financing facilities | 4,846 | 7,693 |
| Interest capitalized as borrowing costs | (171,410) | (227,090) |
| 223,010 | 228,674 | |
Ivanhoe's exploration and project evaluation expenditure amounted to $28 million for the nine months ended September 30, 2025, and $32 million for the same period in 2024. Exploration and project evaluation expenditure for 2025 related mainly to exploration at Ivanhoe's Western Forelands exploration licences.
Finance income amounted to $129 million for the nine months ended September 30, 2025, and $185 million for the same period in 2024. Included in finance income is the interest earned on loans to the Kamoa Holding joint venture to fund past development that amounted to $105 million for the nine months ended September 30, 2025, and $171 million for the same period in 2024 and decreased due to the effects of the subscription and set-off agreement entered into by Kamoa Holding and its shareholders in December 2024.
Financial position as at September 30, 2025, vs. December 31, 2024
The company's total assets increased by $1,664 million, from $5,738 million as at December 31, 2024, to $7,402 million as at September 30, 2025. The increase in total assets was mainly attributable to the increase in cash and cash equivalents by $938 million, the increase in the company's investment in the Kamoa Holding joint venture by $307 million and the increase in property, plant and equipment of $345 million as project development continued at the Platreef Mine.
Cash and cash equivalents increased by $938 million, from $117 million as at December 31, 2024, to $1,056 million as at September 30, 2025. The increase is attributable to the receipt of proceeds from the Senior Notes in January 2025, which amounted to $730 million net of transaction costs, as well as the receipt of proceeds from the private placement in September 2025 which amounted to $544 million net of transaction costs. The company spent $239 million on project development and acquiring other property, plant, and equipment, $86 million on its operating activities and advanced equity contributions of $66 million to the Kamoa Holding joint venture during the nine months ended September 30, 2025 .
The company's investment in the Kamoa Holding joint venture increased by $307 million from $3,034 million as at December 31, 2024, to $3,340 million as at September 30, 2025. The company's investment in the Kamoa Holding joint venture can be broken down as follows:
| September 30, | December 31, | |
| 2025 | 2024 | |
| $'000 | $'000 | |
| Company's share of net assets in joint venture | 2,092,755 | 1,890,974 |
| Loan advanced to joint venture | 1,247,653 | 1,142,742 |
| Total investment in joint venture | 3,340,408 | 3,033,716 |
The company's share of the net assets in the Kamoa Holding joint venture can be broken down as follows:
| September 30, 2025 | December 31, 2024 | |||
| 100% | 49.5% | 100% | 49.5% | |
| $'000 | $'000 | $'000 | $'000 | |
| Assets | ||||
| Property, plant and equipment | 6,769,684 | 3,350,994 | 6,122,292 | 3,030,535 |
| Indirect taxes receivable | 939,117 | 464,863 | 651,915 | 322,698 |
| Current inventory | 796,539 | 394,287 | 564,685 | 279,519 |
| Mineral property | 748,839 | 370,675 | 763,217 | 377,792 |
| Long-term loan receivable | 426,732 | 211,232 | 374,485 | 185,370 |
| Other receivables | 413,912 | 204,886 | 371,077 | 183,683 |
| Trade receivables | 230,227 | 113,962 | 280,795 | 138,993 |
| Cash and cash equivalents | 124,575 | 61,665 | 100,641 | 49,817 |
| Run of mine stockpile | 161,158 | 79,773 | 318,688 | 157,751 |
| Right-of-use asset | 43,211 | 21,389 | 51,764 | 25,623 |
| Income taxes receivable | 34,234 | 16,946 | 9,227 | 4,567 |
| Deferred tax asset | 27,064 | 13,397 | 27,594 | 13,659 |
| Prepaid expenses | 10,639 | 5,266 | 17,377 | 8,602 |
| Non-current deposits | 3,127 | 1,548 | 1,872 | 927 |
| Liabilities | ||||
| Shareholder loans | (2,520,823) | (1,247,807) | (2,308,984) | (1,142,947) |
| Advance payment facilities | (963,183) | (476,776) | (681,345) | (337,266) |
| Trade and other payables | (812,957) | (402,414) | (711,936) | (352,407) |
| Term loan facilities | (658,637) | (326,025) | (668,508) | (330,911) |
| Deferred tax liability | (269,308) | (133,307) | (323,546) | (160,155) |
| Overdraft facility | (272,382) | (134,829) | (232,475) | (115,075) |
| Rehabilitation provision | (126,100) | (62,420) | (123,668) | (61,216) |
| Provisional payment facilities | (107,323) | (53,125) | (78,993) | (39,102) |
| Dividends payable | (100,327) | (49,662) | - | - |
| Other provisions | (78,039) | (38,629) | (47,146) | (23,337) |
| Lease liability | (44,978) | (22,264) | (52,093) | (25,786) |
| Non-controlling interest | (547,213) | (270,870) | (606,788) | (300,360) |
| Net assets of the joint venture | 4,227,788 | 2,092,755 | 3,820,147 | 1,890,974 |
Before commencing commercial production in July 2021, the Kamoa Holding joint venture principally used loans from its shareholders to develop the Kamoa-Kakula Copper Complex through investing in development costs and other property, plant, and equipment.
Advance payment facilities represent financing arrangements linked to Kamoa-Kakula's offtake agreements with its customers. Each customer has provided advance payment facilities which are repaid by offsetting amounts payable in terms of provisional invoices in accordance with the terms of each agreement. Kamoa-Kakula received $800 million in advance payments under these facilities during the nine months ended September 30, 2025.
Overdraft facilities represent drawn unsecured financing facilities from DRC financial institutions at an attractive cost of capital, utilized to augment cash generated from operations for Kamoa-Kakula's continued expansion and working capital. Total current overdraft facilities amount to $337 million, with an interest rate of approximately 6.5%.
The term loan facilities of the Kamoa Holding joint venture can be summarized as follows:
| September 30, | December 31, | ||
| Description | Repayment terms | 2025 | 2024 |
| $'000 | $'000 | ||
| Syndicated term facility | Repayable in eight equal quarterly installments starting from March 31, 2026 | 401,896 | 403,568 |
| Facility agreement | Full repayment on June 25, 2026 | 197,374 | 199,911 |
| Equipment financing facilities | Installments on each quarterly facility repayment date, with $40 million repayable in the next 12 months | 39,737 | 65,029 |
| Bank of Africa facility agreement | Repayable in 18 monthly installments starting June 21, 2025, with final payment due November 2026 | 19,630 | - |
| Total term loan facilities | 658,637 | 668,508 |
The repayments of the advanced payment facilities of the Kamoa Holding joint venture can be summarized as follows:
| More than | |||||
| 0-3 months | 3-6 months | 6-12 months | 12-24 months | 24 months | |
| $'000 | $'000 | $'000 | $'000 | $'000 | |
| As at September 30, 2025 | 38,183 | 19,048 | 57,143 | 314,286 | 534,524 |
Kamoa Copper concluded working capital and overdraft facilities with Ecobank and United Bank for Africa for $15 million and $50 million respectively in October 2025. Also in October, Kamoa Copper concluded a 2-year term facility of $500 million with Standard Bank, ABSA, RMB and Africa Finance Corporation, of which $370 million was drawn in October 2025.
The cash flows of the Kamoa Holding joint venture can be summarized as follows:
| Three months ended | Nine months ended | |||
| September 30, | September 30, | |||
| 2025 | 2024 | 2025 | 2024 | |
| $'000 | $'000 | $'000 | $'000 | |
| Net cash (used in) generated from operating activities before change in working capital items | (19,875) | 266,662 | 768,036 | 911,263 |
| Change in working capital items | 158,709 | (193,352) | (222,592) | (265,948) |
| Net cash used in investing activities | (354,804) | (522,970) | (918,573) | (1,622,033) |
| Net cash generated from financing activities | 36,831 | 214,626 | 357,505 | 1,024,519 |
| Effect of foreign exchange rates on cash | 568 | (1,538) | (349) | 1,246 |
| Net cash (outflow) inflow | (178,571) | (236,572) | (15,973) | 49,047 |
| Cash and cash equivalents (1) - beginning of the period | 30,764 | 180,330 | (131,834) | (105,289) |
| Cash and cash equivalents (1) - end of the period | (147,807) | (56,242) | (147,807) | (56,242) |
(1) Cash and cash equivalents in the above table are shown net of overdraft facilities.
The Kamoa Holding joint venture's net increase in property, plant and equipment from December 31, 2024, to September 30, 2025, amounted to $647 million and can be further broken down as follows:
| Three months ended | Nine months ended | |||
| September 30, | September 30, | |||
| 2025 | 2024 | 2025 | 2024 | |
| $'000 | $'000 | $'000 | $'000 | |
| Kamoa Holding joint venture | ||||
| Expansion capital | 230,546 | 468,216 | 630,440 | 1,397,523 |
| Sustaining capital | 108,580 | 90,526 | 279,855 | 219,545 |
| 339,126 | 558,742 | 910,295 | 1,617,068 | |
| Depreciation capitalized | 14,321 | 13,581 | 44,786 | 39,974 |
| Total capital expenditure | 353,447 | 572,323 | 955,081 | 1,657,042 |
| Borrowing costs capitalized | 21,755 | 80,924 | 171,410 | 227,092 |
| Total additions to property, plant, and equipment for Kamoa Holding | 375,202 | 653,247 | 1,126,491 | 1,884,134 |
| Less depreciation, impairment, disposals, and foreign exchange translation | (163,459) | (94,110) | (479,099) | (260,709) |
| Net increase in property, plant, and equipment of Kamoa Holding | 211,743 | 559,137 | 647,392 | 1,623,425 |
The net increase in Ivanhoe's property, plant, and equipment amounted to $345 million, with additions of $246 million to project development and other property, plant, and equipment. Of this total, $182 million pertained to development costs and other acquisitions of property, plant and equipment at the Platreef Mine, while $63 million pertained to acquisitions of property, plant, and equipment at the Kipushi Mine.
The main components of the additions to property, plant and equipment - including capitalized development costs - at the Platreef Mine and Kipushi Mine for the nine months ended September 30, 2025, and for the same period in 2024, are set out in the following tables:
| Three months ended | Nine months ended | |||
| September 30, | September 30, | |||
| 2025 | 2024 | 2025 | 2024 | |
| $'000 | $'000 | $'000 | $'000 | |
| Platreef Mine | ||||
| Phase 2 construction | 29,283 | 25,075 | 77,659 | 96,105 |
| Site costs | 15,681 | 1,478 | 38,245 | 3,731 |
| Salaries and benefits | 9,215 | 8,014 | 27,737 | 17,035 |
| Administrative and other expenditure | 4,409 | 3,352 | 11,731 | 8,308 |
| Phase 1 construction | 3,611 | 30,841 | 9,797 | 49,728 |
| Depreciation | 2,774 | 2,170 | 7,798 | 6,314 |
| Studies and contracting work | 2,018 | 1,048 | 5,235 | 2,671 |
| Social and environmental | 899 | 1,319 | 2,807 | 2,548 |
| Total development costs | 67,890 | 73,297 | 181,009 | 186,440 |
| Other additions to property, plant and equipment | 32 | 1,172 | 967 | 8,373 |
| Total additions to property, plant and equipment for Platreef | 67,922 | 74,469 | 181,976 | 194,813 |
| Three months ended | Nine months ended | |||
| September 30, | September 30, | |||
| 2025 | 2024 | 2025 | 2024 | |
| $'000 | $'000 | $'000 | $'000 | |
| Kipushi Mine | ||||
| Initial and expansion capital | 2,151 | 37,961 | 24,740 | 185,007 |
| Sustaining capital | 11,903 | - | 38,006 | - |
| 14,054 | 37,961 | 62,746 | 185,007 | |
| Depreciation capitalized | - | 1,305 | - | 4,530 |
| Total capital expenditure | 14,054 | 39,266 | 62,746 | 189,537 |
| Total additions to property, plant and equipment for Kipushi | 14,054 | 39,266 | 62,746 | 189,537 |
The company's total liabilities increased by $867 million to $1,769 million as at September 30, 2025, from $902 million as at December 31, 2024, with the increase mainly due to the issuance $750 million 7.875% Senior Notes due 2030 as well as an increase in borrowings during the period.
On January 23, 2025, the company issued debt securities with an aggregate principal of $750 million (Senior Notes) and a maturity date of January 23, 2030. The Senior Notes carry a coupon of 7.875% per annum payable semi-annually in arrears on January 23 and July 23 each year, commencing on July 23, 2025. The Senior Notes are senior unsecured borrowings of the company and are guaranteed by the company's subsidiaries, Kipushi Holding Limited and Ivanhoe Mines US LLC. The Senior Notes are listed on The International Stock Exchange, Guernsey and traded on the Global Exchange Market. The gross proceeds from the Senior Notes will be used for general corporate purposes, including capital expenditure associated with the company's projects, and to pay certain fees and expenses related to the Offering. Interest is payable semi-annually in arrears at a rate of 7.875% per annum on January 23 and July 23 of each year, commencing on July 23, 2025.
Transaction costs of $20 million associated with the Senior Notes were capitalized against the principal amount and an amount of $19 million remains unamortized as at September 30, 2025. The effective interest rate of the Senior Notes was deemed to be 8.6467%. Interest of $43 million was incurred for the nine months ended September 30, 2025.
The company's borrowings increased by $55 million mainly due to the receipt of $30 million by Platreef under its Senior Debt facility, $12 million received by Ivanhoe Marketing under its revolving credit facility with Rand Merchant Bank (RMB) and $20 million received by Kipushi under its offtaker facility agreement with Mercuria.
LIQUIDITY AND CAPITAL RESOURCES
The company had $1,056 million in cash and cash equivalents as at September 30, 2025. At this date, the company had consolidated working capital surplus of approximately $972 million, compared to a working capital surplus of approximately $60 million as at December 31, 2024.
The company's capital expenditure can be summarized as follows:
| Capital Expenditure | YTD 2025 Actuals | 2025 Guidance | 2026 Guidance |
| ($' million) | ($' million) | ($' million) | |
| Kamoa-Kakula | |||
| Phase 3 and other expansion capital | 630 | 900 - 1,000 | |
| Sustaining capital | 280 | 420 - 500 | |
| 910 | 1,320 - 1,500 | 800 - 1,300 | |
| Platreef | |||
| Phase 1 initial capital | 27 | 70 | - |
| Phase 2 capital | 147 | 180 - 210 | 350 - 380 |
| 174 | 250 - 280 | 350 - 380 | |
| Kipushi | |||
| Initial and expansion capital | 25 | 30 | - |
| Sustaining capital | 38 | 50 | 50 |
| 63 | 80 | 50 |
Figures in the above table are presented on a 100% basis.
The 2025 capital expenditure guidance for Kamoa-Kakula has been reduced by $100 million from $1,420 million - $1,600 million, and the 2026 capital expenditure guidance has been increased from $700 - $1,200 million.
The Platreef Mine's capital expenditure guidance range for 2025 and 2026 is kept unchanged. First production of concentrate from Platreef's Phase 1 concentrator is expected in November, with the Phase 2 expansion proceeding as contemplated in the feasibility study completed in February this year, which outlines an increase in the total processing capacity to approximately 4.1 Mtpa with a new 3.3-Mtpa Phase 2 concentrator module from Q4 2027.
Kipushi's debottlenecking program was completed in August 2025, both ahead of schedule and under budget. Sustaining capital at Kipushi is expected to exceed initial guidance for the year by approximately $10 million to cater for the accelerated construction of the second tailings facility paddock in preparation for the increased production and guidance has been increased as a resultt.
Ivanhoe's exploration budget for 2025 was originally set at approximately $75 million, with $50 million of that amount earmarked for exploration activities focused on the Western Forelands Exploration Project. It is currently forecasted that expenditure for the year will be under budget for a total of approximately $45 million.
PRO-RATA FINANCIAL RATIOS
The following pro-rata financial ratios have been calculated by aggregating the contributions of the company with the contributions from the Kamoa-Kakula joint venture, pro-rata to the company's effective shareholding in the Kamoa-Kakula joint venture.
| (in millions of $, except ratios) | September 30, | December 31, |
| 2025 | 2024 | |
| Pro-rata total debt | 1,949.0 | 1,016.3 |
| Pro-rata cash | 1,109.6 | 163.5 |
| Pro-rata net debt | 839.4 | 852.8 |
| Pro-rata net debt to Adjusted EBITDA (1) | 1.47x | 1.36x |
(1) Pro-rata net debt to Adjusted EBITDA ratio is a non-GAAP financial measure. Pro-rata net debt to Adjusted EBITDA ratio is pro-rata net debt divided by Adjusted EBITDA for the twelve months ended at the reporting period, expressed as the number of times Adjusted EBITDA needs to be earned to repay the pro-rata net debt.
The company's pro-rata total debt is summarized as follows:
| September 30, | December 31, | |
| 2025 | 2024 | |
| $'millions | $'millions | |
| Consolidated indebtedness of the Company: | ||
| Senior notes | 743.4 | - |
| Senior debt facility | 93.7 | 63.4 |
| Advance payment facilities | 120.0 | 120.0 |
| Other borrowings | 199.3 | 175.0 |
| 1,156.4 | 358.4 | |
| Pro-rata indebtedness of Kamoa Holding joint venture | ||
| Term loan facilities | 260.8 | 264.7 |
| Advance payment facilities | 381.4 | 269.8 |
| Provisional payment facilities | 42.5 | 31.3 |
| Overdraft facilities | 107.9 | 92.1 |
| 792.6 | 657.9 | |
| Pro-rata total debt | 1,949.0 | 1,016.3 |
The pro-rata cash and cash equivalents of the company are summarized as follows:
| September 30, | December 31, | |
| 2025 | 2024 | |
| $'millions | $'millions | |
| Consolidated cash and cash equivalents of the Company | 1,055.6 | 117.3 |
| Pro-rata cash and cash equivalents of Kamoa Holding joint venture | 54.0 | 46.2 |
| Pro-rata cash and cash equivalents | 1,109.6 | 163.5 |
The pro-rata net debt of the company is summarized as follows:
| September 30, | December 31, | |
| 2025 | 2024 | |
| $'millions | $'millions | |
| Pro-rata total debt | 1,949.0 | 1,016.3 |
| Pro-rata cash and cash equivalents | 1,109.6 | 163.5 |
| Pro-rata net debt | 839.4 | 852.8 |
The Adjusted EBITDA of the company for the twelve months ended September 30, 2025, is summarized as follows:
| Twelve months ended | |||||
| September 30, | |||||
| 2025 | Q3 2025 | Q2 2025 | Q1 2025 | Q4 2024 | |
| $'millions | $'millions | $'millions | $'millions | $'millions | |
| Profit after taxes | 276.1 | 30.6 | 35.3 | 122.2 | 88.0 |
| Finance income | (185.1) | (43.9) | (43.6) | (41.6) | (56.0) |
| Current and deferred tax | (26.1) | (2.5) | (7.2) | (4.0) | (12.4) |
| Finance costs | 40.4 | 20.9 | 4.9 | 7.8 | 6.8 |
| Unrealized foreign exchange loss (gain) | (2.4) | (6.6) | 0.7 | 0.7 | 2.8 |
| Depreciation | 49.4 | 14.7 | 11.3 | 11.9 | 11.5 |
| Amortization of mineral property | 17.0 | 4.1 | 5.2 | 2.3 | 5.4 |
| EBITDA | 169.3 | 17.3 | 6.6 | 99.3 | 46.1 |
| Share of profit from joint venture net of tax | (208.5) | (11.3) | (15.7) | (107.9) | (73.6) |
| Company's share of EBITDA from Kamoa-Kakula joint venture (1) | 594.3 | 76.3 | 127.8 | 231.3 | 158.9 |
| Non-cash share-based payments | 16.9 | 4.3 | 4.6 | 3.7 | 4.3 |
| Adjusted EBITDA | 572.0 | 86.6 | 123.3 | 226.4 | 135.7 |
(1) The Company's attributable share of EBITDA from the Kamoa-Kakula joint venture is calculated using the Company's effective shareholding in Kamoa Copper SA (39.6%), Ivanhoe Mines Energy DRC SARL (49.5%), Kamoa Holding Limited (49.5%), Kamoa Services (Pty) Ltd (49.5%) and the Kamoa Centre of Excellence (49.5%).
SUMMARY OF DEBT FACILITIES
On January 23, 2025, the company issued debt securities with an aggregate principal of $750 million, being the Senior Notes, and a maturity date of January 23, 2030. The Senior Notes carry a coupon of 7.875% per annum payable semi-annually in arrears on January 23 and July 23 each year, commencing on July 23, 2025. The Senior Notes are senior unsecured borrowings of the Company and are guaranteed by the Company's subsidiaries, Kipushi Holding Limited and Ivanhoe Mines US LLC. The Senior Notes are listed on The International Stock Exchange, Guernsey and traded on the Global Exchange Market. The gross proceeds from the Senior Notes will be used for general corporate purposes, including capital expenditure associated with the Company's projects, and to pay certain fees and expenses related to the Offering. Interest is payable semi-annually in arrears at a rate of 7.875% per annum on January 23 and July 23 of each year, commencing on July 23, 2025. Transaction costs of $20.3 million associated with the Senior Notes were capitalized against the principal amount and an amount of $18.6 million remains unamortized as at September 30, 2025. The effective interest rate of the senior notes was deemed to be 8.6467%. Interest of $43 million was incurred for the nine months ended September 30, 2025.
On or after January 23, 2027, the company has the right to redeem all or part of the Senior Notes at the following redemption prices, expressed as a percentage of the principal amount, plus any unpaid accrued interest.
| Redemption price | |||
| Period of 12 months from January 23, 2027 | 103.9375% | ||
| Period of 12 months from January 23, 2028 | 101.9688% | ||
| Period of 12 months from January 23, 2029 | 100.0000% | ||
On August 12, 2025, Kipushi entered into an offtaker facility agreement with Mercuria Energy Trading SA (Mercuria). Mercuria made $20 million available to Kipushi to finance the development, construction and operation of the Kipushi Mine. Kipushi drew down on the full facility in September 2025. The facility is repayable in 24 equal monthly instalments starting six months after the agreement date and incurs interest at Term SOFR + 5%.
On December 10, 2024, Kipushi entered into a $50 million revolving credit facility agreement with RMB. Under the terms of the agreement, RMB provided a $50 million revolving loan facility to Kipushi to finance costs and expenditures related to the Project. Kipushi drew $26 million from the facility on December 13, 2024. The facility incurs interest at the applicable Term SOFR plus a margin of 4.5% per annum. Interest is repayable on the last day of each interest period (being either 1, 3 or 6 months), with the facility repayable in full in December 2026 (unless repayment is extended in accordance with the terms of the agreement). Repayment may, upon mutual agreement of Kipushi and RMB, be extended by successive 12-month periods. Ivanhoe Mines Ltd. has provided a corporate guarantee under this loan agreement.
On October 25, 2024, Ivanhoe Marketing and RMB entered into a $75 million revolving credit facility agreement. Under the terms of the agreement, RMB provided a $75 million revolving loan facility to Ivanhoe Marketing to finance general corporate purposes and working capital requirements. Ivanhoe Marketing drew $40 million from the facility in 2024 and a further $11.5 million in the second quarter of 2025. The facility incurs interest at the applicable Term SOFR plus a margin of 3.25% per annum. Interest is repayable on the last day of each interest period (being either 1, 3 or 6 months), with the facility repayable in full in October 2025. Repayment may, upon mutual agreement of Ivanhoe Marketing and RMB, be extended by successive 12-month periods. Ivanhoe Mines Ltd. guarantees all amounts due to RMB under this facility agreement.
During the second quarter of 2024, Kipushi entered into a $50 million facility agreement with FirstBank DRC SA (FirstBank). Under the terms of the agreement, FirstBank provided a $50 million facility to Kipushi to finance costs related to the development of the project. Kipushi drew down on the full facility on the date of the agreement. The facility incurs interest at 3-month Term SOFR plus a margin of 4.5% per annum. Interest is repayable every three months, with the facility repayable in full in May 2025, but repayment may automatically be extended by a further consecutive 12 months unless either party to the agreement gives written confirmation that there shall be no such automatic extension of the date.
On December 22, 2023, Ivanplats entered into a common terms and senior secured facility agreement between, amongst others, Société Générale and Nedbank Limited (acting through its Nedbank Corporate and Investment Banking Division) (Nedbank) as lenders; Ivanplats as borrower; Ivanplats Holding S.À.R.L, ITC and Ivanhoe Mines SA (Pty) Ltd. as guarantors; Ivanhoe Mines Ltd. as sponsor; and Nedbank Limited as global facility agent (as amended and amended and restated from time to time, the "Platreef Senior Debt Financing Agreement"). Under the Platreef Senior Debt Financing Agreement, the lenders thereunder make available to Ivanplats a senior secured facility in an aggregate principal amount of up to $150 million (the Platreef Senior Debt). The Platreef Senior Debt incurs an initial interest at the applicable Term SOFR (subject to a zero floor) plus 4.80%. The initial rate of interest shall apply until the earlier of the Completion Date (as defined in and subject to the conditions of the Platreef Senior Debt Financing Agreement) and the Target Refinancing Date (July 31, 2026), after which the interest rate shall be Term SOFR + 4.65% per annum from the Completion Date (if the Target Refinancing Date has not occurred) or Term SOFR + 6.50% per annum from the Target Refinancing Date. Ivanplats drew on $70 million of the Platreef Senior Debt on November 6, 2024 and a further $30 million on May 23, 2025. The remaining $50 million of the facility was cancelled in full by Ivanplats on October 3, 2025.
On August 4, 2023, the company entered into an $18 million loan agreement with Investec Bank Limited, a South African financial institution, in respect of its aircraft. Interest on the loan is incurred at SOFR + a margin of 3.65% per annum and is payable monthly in arrears. The principal amount is repayable monthly in 60 equal installments. The Company repaid $2.6 million of the principal amount and $0.8 million in interest during the nine months ended September 30, 2025.
The Company has a mortgage bond outstanding on its offices in London, United Kingdom, of £3.2 million ($4.4 million). The bond was fully repayable on August 28, 2025. As at September 30, 2025, negotiations around the facility were still ongoing with Citibank. On October 6, 2025, the facility was renewed with a maturity date of September 30, 2030. All other terms of the facility remained unchanged. The bond is secured by the property, and incurs interest at a rate of one month Sterling Overnight Index Average (SONIA) plus 1.90% payable monthly in arrears. Only interest will be payable until maturity.
In 2013, the company became a party to a loan payable to ITC Platinum Development Limited, which had a carrying value and contractual value of $40 million as at September 30, 2025. The loan is repayable once the Platreef Mine has residual cash flow, which is defined in the loan agreement as gross revenue generated by the Platreef Mine, less all operating costs attributable thereto, including all mining development and operating costs. The loan incurs interest of term SOFR applicable to United States Dollars on a 3-month deposit plus 2.26%. Interest is not compounded.
The company has an implied commitment in terms of spending on work programs submitted to regulatory bodies to maintain the good standing of exploration and exploitation permits at its mineral properties. The following table sets forth the Company's long-term obligations:
| Contractual obligations as at September 30, 2025 | Payments Due By Period | ||||
| Total | Less than 1 year | 1-3 years | 4-5 years | After 5 years | |
| $'000 | $'000 | $'000 | $'000 | $'000 | |
| Debt | 1,565,409 | 257,340 | 326,793 | 950,742 | 30,534 |
| Lease commitments | 904 | 437 | 467 | - | - |
| Total contractual obligations | 1,566,313 | 257,777 | 327,260 | 950,742 | 30,534 |
Debt in the above table represents the senior notes, the senior debt facility, the advance payment facilities, the RMB loan facilities, mortgage bond owing to Citibank, the loan payable to ITC Platinum Development Limited, the loan from FirstBank, the aircraft loan as described above.
NON-GAAP FINANCIAL PERFORMANCE MEASURES
Cash cost (C1) per pound is a non-GAAP financial measure. These are disclosed to enable investors to better understand the performance of Kamoa-Kakula and Kipushi in comparison to other copper and zinc producers respectively who present results on a similar basis.
Cash cost (C1) is prepared on a basis consistent with the industry standard definitions by Wood Mackenzie cost guidelines but is not measures recognized under IFRS Accounting Standards. In calculating the C1 cash cost for Kamoa-Kakula, the costs are measured on the same basis as the company's share of profit from the Kamoa Holding joint venture that is contained in the financial statements. C1 cash cost is used by management to evaluate operating performance and includes all direct mining, processing, and general and administrative costs. Smelter charges and freight deductions on sales to the final port of destination, which are recognized as a component of sales revenues, are added to C1 cash cost to arrive at an approximate cost of finished metal. C1 cash cost and C1 cash cost per pound exclude royalties, production taxes, and non-routine charges as they are not direct production costs.
Reconciliation of Kamoa-Kakula's cost of sales to C1 cash cost, including on a per pound basis:
| Three months ended | Nine months ended | |||
| September 30, | September 30, | |||
| 2025 | 2024 | 2025 | 2024 | |
| $'000 | $'000 | $'000 | $'000 | |
| Cost of sales | 438,230 | 408,919 | 1,531,687 | 1,015,688 |
| General and administrative expenditure | 57,490 | 22,260 | 131,241 | 96,000 |
| Logistics, treatment and refining charges | 50,681 | 119,980 | 262,909 | 344,495 |
| Depreciation | (113,987) | (73,918) | (358,996) | (210,660) |
| Costs classified as abnormal due to seismic activity | (9,533) | - | (99,597) | - |
| General and administrative expenditures of other group entities | (7,000) | (772) | (11,690) | (2,893) |
| Royalties and production taxes | (41,693) | (66,515) | (179,246) | (187,985) |
| Non-cash adjustments to inventory | 44,395 | 16,816 | 87,110 | 21,213 |
| Power rebate | (3,512) | (4,208) | (10,637) | (13,163) |
| Extraordinary taxes | (11,363) | (60) | (12,323) | (21,917) |
| C1 cash costs | 403,708 | 422,502 | 1,340,458 | 1,040,778 |
| Cost of sales per pound of payable copper sold ($ per lb.) | 3.23 | 1.80 | 2.54 | 1.62 |
| C1 cash costs per pound of payable copper produced ($ per lb.) | 2.62 | 1.69 | 1.97 | 1.60 |
| Payable copper produced in concentrate (tonnes) | 69,682 | 113,313 | 308,285 | 295,471 |
Figures in the above table are for the Kamoa-Kakula joint venture on a 100% basis.
Reconciliation of Kipushi's cost of sales to C1 cash cost, including on a per-pound basis:
| Three months ended | Nine months ended | |||
| September 30, | September 30, | |||
| 2025 | 2024 | 2025 | 2024 | |
| $'000 | $'000 | $'000 | $'000 | |
| Cost of sales | 122,151 | - | 304,139 | - |
| Logistics and treatment charges | 13,759 | - | 36,397 | - |
| General and administrative expenditure | 374 | - | 808 | - |
| Royalties and production taxes | (12,330) | - | (32,984) | - |
| Depreciation and amortization | (18,470) | - | (47,565) | - |
| General and administrative expenditures of other group entities | (933) | - | (3,254) | - |
| C1 cash costs | 104,551 | - | 257,541 | - |
| Cost of sales per pound of payable zinc sold ($ per lb.) | 1.11 | - | 1.12 | - |
| C1 cash costs per pound of payable zinc sold ($ per lb.) | 0.95 | - | 0.95 | - |
| Payable zinc sold in concentrate (tonnes) | 49,744 | - | 123,200 | - |
EBITDA, Adjusted EBITDA, and EBITDA margin, normalized profit after tax, and normalized profit per share
EBITDA and Adjusted EBITDA are non-GAAP financial measures. Ivanhoe believes that Kamoa-Kakula's EBITDA and Kipushi's EBITDA are valuable indicators of each mine's respective ability to generate liquidity by producing operating cash flow to fund their working capital needs, service debt obligations, fund capital expenditures, and distribute cash to its shareholders. EBITDA and Adjusted EBITDA are also frequently used by investors and analysts for valuation purposes. Kamoa-Kakula's EBITDA, Kipushi's EBITDA, and the EBITDA and Adjusted EBITDA for the Company are intended to provide additional information to investors and analysts and do not have any standardized definition under IFRS Accounting Standards and should not be considered in isolation or as a substitute for measures of performance prepared per IFRS Accounting Standards. EBITDA and Adjusted EBITDA exclude the impact of cash cost of financing activities and taxes, and the effects of changes in operating working capital balances and impairments, and therefore are not necessarily indicative of operating profit or cash flow from operations as determined under IFRS Accounting Standards. Other companies may calculate EBITDA and Adjusted EBITDA differently.
The EBITDA margin is an indicator of Kamoa-Kakula's and Kipushi's respective overall health and denotes their respective profitability, which is calculated by dividing EBITDA by revenue. The EBITDA margin is intended to provide additional information to investors and analysts, does not have any standardized definition under IFRS Accounting Standards, and should not be considered in isolation or as a substitute, for measures of performance prepared per IFRS Accounting Standards.
Reconciliation of profit after tax to Kamoa-Kakula's EBITDA:
| Three months ended | Nine months ended | |||
| September 30, | September 30, | |||
| 2025 | 2024 | 2025 | 2024 | |
| $'000 | $'000 | $'000 | $'000 | |
| Profit after taxes | 26,022 | 218,133 | 329,149 | 587,736 |
| Depreciation | 118,571 | 78,425 | 373,375 | 221,003 |
| Impairment (1) | - | - | 68,202 | - |
| Current and deferred tax expense | 7,821 | 91,759 | 189,070 | 310,466 |
| Finance costs | 110,781 | 83,815 | 223,010 | 228,674 |
| Unrealized foreign exchange (gain) loss | (73,043) | 3,226 | (62,637) | 22,864 |
| Other taxes | 11,363 | 60 | 12,323 | 21,917 |
| Finance income | (5,918) | (5,683) | (17,377) | (10,775) |
| EBITDA | 195,597 | 469,735 | 1,115,115 | 1,381,885 |
(1) The impairment recognized for the nine months ended September 30, 2025 comprises of $59 million attributable to the seismic activity at the Kakula Mine during the second quarter and $9 million related to the generator fire that occurred in January 2025.
Figures in the above table are for the Kamoa-Kakula joint venture on a 100% basis.
Reconciliation of loss after tax to Kipushi's EBITDA:
| Three months ended | Nine months ended | |||
| September 30, | September 30, | |||
| 2025 | 2024 | 2025 | 2024 | |
| $'000 | $'000 | $'000 | $'000 | |
| Segmented profit (loss) after taxes | 7,580 | (760) | (3,634) | (1,901) |
| Depreciation and amortization | 18,470 | - | 47,565 | - |
| Finance costs | 8,465 | - | 22,932 | - |
| Current and deferred tax expense | (1,987) | - | (14,152) | 424 |
| Finance income | (597) | (553) | (1,801) | (1,758) |
| Unrealized foreign exchange (gain) loss | (5,257) | 333 | (4,433) | 1,747 |
| EBITDA | 26,674 | (980) | 46,477 | (1,488) |
Reconciliation of profit after tax to Ivanhoe's EBITDA and adjusted EBITDA:
| Three months ended | Nine months ended | |||
| September 30, | September 30, | |||
| 2025 | 2024 | 2025 | 2024 | |
| $'000 | $'000 | |||
| Profit (loss) after taxes | 30,552 | 108,182 | 188,077 | 105,288 |
| Finance income | (43,855) | (60,164) | (129,061) | (185,494) |
| Depreciation | 14,711 | 1,010 | 37,921 | 2,456 |
| Amortization of mineral property | 4,096 | - | 11,635 | - |
| Current and deferred tax (recovery) expense | (2,489) | 644 | (13,671) | (1,733) |
| Finance costs | 20,920 | 471 | 33,705 | 42,286 |
| Unrealized foreign exchange loss | (6,664) | (1,319) | (5,339) | 7,053 |
| EBITDA | 17,271 | 48,824 | 123,267 | (30,144) |
| Share of profit from joint venture net of tax | (11,305) | (83,507) | (134,957) | (218,288) |
| Company's share of EBITDA from Kamoa-Kakula joint venture(1) | 76,337 | 184,720 | 439,087 | 552,997 |
| Non-cash share-based payments | 4,333 | 5,764 | 12,553 | 20,563 |
| Loss on fair valuation of embedded derivative liability | - | 4,171 | - | 164,169 |
| Adjusted EBITDA | 86,636 | 159,972 | 439,950 | 489,297 |
The company's attributable share of adjusted EBITDA from the Kamoa-Kakula joint venture is calculated using the company's effective shareholding in Kamoa Copper SA (39.6%), Ivanhoe Mines Energy DRC SARL (49.5%), Kamoa Holding Limited (49.5%), Kamoa Services (Pty) Ltd (49.5%), and the Kamoa Centre of Excellence (49.5%).
DISCLOSURE OF TECHNICAL INFORMATION
Disclosures of a scientific or technical nature at the Kamoa-Kakula Copper Complex, the Platreef Mine and the Kipushi Mine, other than stockpiles, in this press release have been reviewed and approved by Steve Amos, who is considered, by virtue of his education, experience, and professional association, a Qualified Person under the terms of NI 43-101. Mr. Amos is not considered independent under NI 43-101 as he is Ivanhoe Mines' Executive Vice President, Projects. Mr. Amos has verified the technical data disclosed in this press release.
Disclosures of a scientific or technical nature regarding the stockpiles in this press release have been reviewed and approved by Joshua Chitambala, who is considered, by virtue of his education, experience, and professional association, a Qualified Person under the terms of NI 43-101. Mr. Chitambala is not considered independent under NI 43-101 as he is the Resource Manager for Ivanhoe Mines. Mr. Chitambala has verified the other technical data regarding the surface stockpiles disclosed in this press release.
Disclosures of a scientific or technical nature regarding the Western Forelands Exploration Project in this press release have been reviewed and approved by Tim Williams, who is considered, by virtue of his education, experience, and professional association, a Qualified Person under the terms of NI 43-101. Mr. Williams is not considered independent under NI 43-101 as he is the Vice President, Geosciences, at Ivanhoe Mines. Mr. Williams has verified the technical data regarding the Western Forelands Exploration Project disclosed in this press release.
Ivanhoe has prepared an independent, NI 43-101-compliant technical report for the Kamoa-Kakula Copper Complex, the Platreef Mine, and the Kipushi Mine, each of which is available on the company's website and under the company's SEDAR+ profile at www.sedarplus.ca
Kamoa-Kakula Integrated Development Plan 2023 Technical Report, filed on March 16, 2023, prepared by OreWin Pty Ltd., China Nerin Engineering Co. Ltd., DRA Global, Epoch Resources, Golder Associates Africa, Metso Outotec Oyj, Paterson and Cooke, SRK Consulting Ltd., and The MSA Group.
The Kipushi 2022 Feasibility Study, filed on March 4, 2022, prepared by OreWin Pty Ltd., MSA Group (Pty) Ltd., SRK Consulting (South Africa) (Pty) Ltd, and METC Engineering.
The Platreef Integrated Development Plan 2025, filed on March 31, 2025, prepared by OreWin Pty Ltd., Mine Technical Services, SRK Consulting Inc., DRA Projects (Pty) Ltd, and Golder Associates Africa.
These technical reports include relevant information regarding the effective dates and the assumptions, parameters, and methods of the mineral resource estimates on the Platreef Mine, the Kipushi Mine, and the Kamoa-Kakula Copper Complex cited in this press release, as well as information regarding data verification, exploration procedures, and other matters relevant to the scientific and technical disclosure contained in this press release in respect of the Platreef Mine, Kipushi Mine, and Kamoa-Kakula Copper Complex.
Information contact
Follow Robert Friedland (@robert_ivanhoe) and Ivanhoe Mines (@IvanhoeMines_) on Twitter.
Investors
Vancouver: Matthew Keevil +1 604 558 1034
London: Tommy Horton +44 7866 913 207
Media
Tanya Todd +1 604 331 9834
Website www.ivanhoemines.com
Forward-looking statements
Certain statements in this news release constitute "forward-looking statements" or "forward-looking information" within the meaning of applicable securities laws. Such statements and information involve known and unknown risks, uncertainties, and other factors that may cause the actual results, performance, or achievements of the company, its projects, or industry results, to be materially different from any future results, performance, or achievements expressed or implied by such forward-looking statements or information. Such statements can be identified using words such as "may", "would", "could", "will", "intend", "expect", "believe", "plan", "anticipate", "estimate", "scheduled", "forecast", "predict" and other similar terminology, or state that certain actions, events, or results "may", "could", "would", "might" or "will" be taken, occur or be achieved. These statements reflect the company's current expectations regarding future events, performance, and results and speak only as of the date of this release.
Such statements include, without limitation: (i) statements that at current run rates, surface stockpiles at Kamoa-Kakula are expected to provide mill feed to the Phase 1 and Phase 2 concentrators until Q1 2026; (ii) statements that from mid-November, mining crews plan to advance towards the centre of the western side of the Kakula Mine, improving head grades to between 3.5% and 4.5%; (iii) statements that the Phase 1 and 2 concentrators will continue to process ore from the western side of the Kakula Mine, as well as surface stockpiles, until Q1 2026, when the stockpiles are depleted and that thereafter, selective mining will commence within the existing workings on the eastern side of the Kakula Mine, which will augment rising production from higher-grade areas on Kakula's western side to underpin improved underground mining rates; (iv) statements that the feed grade into the Phase 3 concentrator will continue to average approximately 2.5% copper for the foreseeable future; (v) statements that Ivanhoe Mines will provide an update on Kamoa-Kakula's production guidance and recovery plan over the medium term by the latest Q1 2026; (vi) statements with respect to the projected decrease in underground water levels at the Kakula Mine through to end of November 2025; (vii) statements that the heat-up of Kamoa-Kakula's state-of-the-art on-site, 500,000-tonne-per-annum direct-to-blister copper smelter is expected to commence in November 2025 and that Kamoa-Kakula's management team expects to process the majority of concentrates produced by the Phase 1, 2, and 3 concentrators through the on-site smelter, with any excess concentrate toll-treated at the nearby Lualaba Copper Smelter in Kolwezi; (viii) statements that total unsold copper in concentrate at the smelter, held in stockpiles and the smelting circuit, is expected to reduce to approximately 17,000 tonnes as the smelter reaches full ramp-up; (ix) statements that Kamoa-Kakula's Project 95 is expected to be completed in early Q2 2026; (x) statements that commercial operation of the BESS at Kamoa-Kakula is expected from Q2 2026; (xi) statements that Kamoa-Kakula plans to expand its on-site solar facilities further over time, targeting a baseload capacity of up to 120 MW; (xii) statements that Kamoa-Kakula is expected to be allocated imminently an initial 50 MW of hydroelectric power from Inga II, increasing to 100 MW in Q1 2026, and thereafter incrementally increasing to 150 MW as grid improvement initiatives are completed; (xiii) statements that the remaining workstreams of upgrading the filter banks at SCI and SCK will occur in phases over the next 18 months, ultimately increasing the total power delivery from Inga II hydro facility up to 150 MW from H1 2027; (xiv) statements that the additional electrical infrastructure upgrades at Kipushi are well underway, with the additional generator capacity expected to be completed in Q4 2025, while completion of the main electrical intake substation expected in Q1 2026; (xv) statements that the development ore stockpiles at Platreef will feed the 0.8 Mtpa Phase 1 concentrator during the initial stages of ramp-up; (xvi) statements that long hole stoping (production mining) is expected to commence in early Q2 2026, once Shaft #3 is commissioned and is ready to hoist towards the end of Q1 2026; (xvii) statements that Ivanplats' project team have commenced work on Phase 2 development, with the concentrator expansion targeted for completion in Q4 2027; (xviii) statements that expansion of the shaft to a diameter of 10 metres will commence in Q1 2026; (xix) statements that negotiations are advancing well for a $700 million Phase 2 senior project finance facility and that Ivanhoe is anticipating that the new financing will be in place during Q1 2026; (xx) statements that financing for the future Phase 3 expansion is expected to be underpinned by cash flow generated from Platreef's Phase 1 and 2 operations; (xxi) statements that following the Phase 3 expansion, as shown in Figure 4, the Platreef Mine is expected to be one of the world's largest primary platinum group metal producers on a platinum-equivalent basis; (xxii) statements that field-based exploration activities in Zambia are expected to commence after the rainy season ends in Q2 2026; and (xxiii) statements that expenditure for the year will be under budget for a total of approximately $55 million.
Also, all of the results of the 4.1 Mtpa FS, the 10.7 Mtpa PEA, the Kamoa-Kakula 2023 IDP, the Platreef 2022 feasibility study, and the Kipushi 2022 feasibility study constitute forward-looking statements or information and include future estimates of internal rates of return, net present value, future production, estimates of cash cost, proposed mining plans and methods, mine life estimates, cash flow forecasts, metal recoveries, estimates of capital and operating costs and the size and timing of phased development of the projects.
Furthermore, concerning this specific forward-looking information concerning the operation and development of the Kamoa-Kakula Copper Complex, Platreef Project and Kipushi Mine, and the exploration of the Western Forelands Exploration Project, the Mokopane Feeder Exploration Project and the Chu-Sarya Basin Exploration JV, the company has based its assumptions and analysis on certain factors that are inherently uncertain. Uncertainties include: (i) the adequacy of infrastructure; (ii) geological characteristics; (iii) metallurgical characteristics of the mineralization; (iv) the ability to develop adequate processing capacity; (v) the price of copper, nickel, zinc, platinum, palladium, rhodium and gold; (vi) the availability of equipment and facilities necessary to complete development and exploration; (vii) the cost of consumables and mining and processing equipment; (viii) unforeseen technological and engineering problems; (ix) accidents or acts of sabotage or terrorism; (x) currency fluctuations; (xi) changes in regulations; (xii) the compliance by joint venture partners with terms of agreements; (xiii) the availability and productivity of skilled labour; (xiv) the regulation of the mining industry by various governmental agencies; (xv) the ability to raise sufficient capital to develop such projects; (xvi) changes in project scope or design; (xvii) recoveries, mining rates and grade; (xviii) political factors; (xviii) water inflow into the mine and its potential effect on mining operations; and (xix) the consistency and availability of electric power.
Forward-looking statements and information involve significant risks and uncertainties, should not be read as guarantees of future performance or results, and will not necessarily be accurate indicators of whether such results will be achieved. Many factors could cause actual results to differ materially from the results discussed in the forward-looking statements or information, including, however not limited to, the factors discussed above and under the "Risk Factors" heading in the company's MD&A for the three and nine months ended September 30, 2025, in the company's current annual information form, and elsewhere in this release, as well as unexpected changes in laws, rules or regulations, or their enforcement by applicable authorities; the failure of parties to contracts with the company to perform as agreed; social or labour unrest; changes in commodity prices; and the failure of exploration programs or studies to deliver anticipated results or results that would justify and support continued exploration, studies, development or operations.
Although the forward-looking statements contained in this release are based upon what management of the company believes are reasonable assumptions, the company cannot assure investors that actual results will be consistent with these forward-looking statements. These forward-looking statements are made as of the date of this release and are expressly qualified in their entirety by this cautionary statement. Subject to applicable securities laws, the company does not assume any obligation to update or revise the forward-looking statements contained herein to reflect events or circumstances occurring after the date of this release.
The company's actual results could differ materially from those anticipated in these forward-looking statements as a result of the factors outlined in the "Risk Factors" section in the company's MD&A for the three and nine months ended September 30, 2025, in the company's current annual information and elsewhere in this release.
ADDITIONAL INFORMATION
Additional information regarding the company, including the company's Annual Information Form, is available on SEDAR+ at www.sedarplus.ca.
![]()
To view the source version of this press release, please visit https://www.newsfilecorp.com/release/272406
Source: Ivanhoe Mines Ltd.