The stage one, six million-tonne-per-annum (6 Mtpa) operation at Kakula, with estimated development capital of US$1.1 billion, yields an after-tax NPV8% of US$5.4 billion and an IRR of 47% over a 25-year mine life
The Kakula Mine's first stage will average 6.8% copper over the first 5 years, with mine-site cash costs of US$0.43/lb copper
Ivanhoe also announces an updated independent preliminary economic assessment (PEA) for an expanded Kakula-Kamoa production rate of 18 Mtpa, supplied initially by a 6 Mtpa mine at Kakula, followed by two 6 Mtpa mines at Kansoko and Kakula West, and a world-scale direct-to-blister smelter
The PEA envisions the staged mine expansions and smelter will be funded from internal cash flows and yields an after-tax NPV8% of US$10.0 billion and an IRR of 41%
Once the expanded PEA production rate of 18 Mtpa is achieved, Kamoa-Kakula is projected to become the world's second largest copper mine, with peak annual production of more than 700,000 tonnes of copper
Cape Town, South Africa--(Newsfile Corp. - February 6, 2019) - Robert Friedland, Co-Chairman of Ivanhoe Mines (TSX: IVN) (OTCQX: IVPAF), announced today in a keynote address at the 25th annual Mining Indaba that the company and its Chinese partners, Zijin Mining Group and Crystal River Global Limited, welcome the extremely positive findings of an independent pre-feasibility study (PFS) for the development of the Kakula copper mine and an updated, expanded preliminary economic assessment (PEA) for the overall development plan of the Kamoa and Kakula copper discoveries at the Kamoa-Kakula Project on the Central African Copperbelt, in the Democratic Republic of Congo (DRC).
"It has been a remarkable 25 years since my first keynote presentation at the very first Mining Indaba, in this beautiful city of Cape Town, South Africa. In that inaugural speech in 1994, we shared with delegates how African Minerals, the founding, corporate trailblazer for Ivanhoe Mines, was focused on its quest for major discoveries in and around Southern Africa's legendary mineral fields," said Mr. Friedland.
"Now, after more than a quarter of a century of exceptional field work by our team of visionary and tenacious exploration geologists, we are about to make the 'Great Leap Forward' from one of the modern world's top mine finders to one of the world's leading producers of copper - as well as palladium, platinum, zinc, nickel, gold, silver and rhodium from the other two major mining projects that Ivanhoe is developing in Southern Africa.
"To all of our African Brothers and Sisters, you now can clearly see the fruits of the incredibly intensive efforts by our people over the past two decades, while overcoming countless challenges, to initially discover, then extensively expand, the Kamoa and Kakula resource base with a massive drilling and engineering effort.
"The Kamoa-Kakula Project now stands as the 'Beacon that Shines Light' on the fundamental importance of stable and transparent legal and fiscal frameworks. Looking back on the last 25 years, we reiterate the obvious fact that mining is a very long-term business that requires stability to attract capital. Future generations of young Congolese people will massively benefit from the establishment of a stable and predictable fiscal environment to attract foreign investment.
"Today, together with our strategic shareholder CITIC Metal, our Co-Chairman Yufeng "Miles" Sun, our Chinese joint-venture partner Zijin Mining, and the newly elected DRC government, led by His Excellency Félix Antoine Tshisekedi Tshilombo, we are proud to share with the world these outstanding, independently-prepared, engineering studies conducted over the past two years.
"These studies clearly prove our long-standing conviction that Kamoa-Kakula is firmly on track to become one of the absolute greatest copper mining complexes in the world, helping to restore Katanga's rightful position as the world's largest copper producing region. This would not have happened without the extraordinary efforts of the Ivanhoe discovery team and our investment of more than US$800 million in exploration and development.
"We now look forward to working with the new government of the DRC and the Congolese people to develop Kamoa-Kakula to its full potential, generating widely shared economic benefits that will help to uplift local communities, and provide skills training to help ensure that young Congolese can qualify for the thousands of meaningful direct and indirect jobs that will be created."
Today's PFS and updated PEA build on the outstanding results of the previous PEA announced in November 2017. The PFS has advanced the detailed design and engineering in that earlier study and has confirmed the viability of the project. As well, the re-scoped and expanded PEA shows the potential to develop the project to a larger scale and with a larger production capacity.
The Kamoa-Kakula Project has been independently ranked as the world's largest high-grade copper discovery by international mining consultant Wood Mackenzie of London in the United Kingdom.
The PFS and PEA encompass two development scenarios:
Pre-feasibility study for stage one Kakula mine development. The Kakula 2019 PFS evaluates the development of a stage one, 6 Mtpa underground mine and surface processing complex at the Kakula Deposit - a 2016 discovery that occurred just three years ago.
Expanded, subsequent development to three producing mines. The Kamoa-Kakula 2019 PEA also includes an option for an integrated, 18 Mtpa, three-stage development, beginning with initial production from the Kakula Mine, to be followed by a subsequent, separate underground mining operation at the nearby Kansoko and Kakula West mines, along with the construction of a direct-to-blister smelter. A further four separate mines will be developed in the Kamoa North area as resources are mined out, to maintain the production rate at 18 Mtpa.
The Kakula 2019 PFS and Kamoa-Kakula 2019 PEA were independently prepared by Amec Foster Wheeler E&C Services Inc. (a division of Wood PLC) of Reno, USA; DRA Global of Johannesburg, South Africa; KGHM Cuprum R&D Centre Ltd. of Wroclaw, Poland; OreWin Pty Ltd. of Adelaide, Australia; Stantec Consulting International LLC of Arizona, USA, and SRK Consulting Inc. of Johannesburg, South Africa.
The Kamoa-Kakula 2019 PEA is preliminary in nature and includes an economic analysis that is based, in part, on Inferred Mineral Resources. Inferred Mineral Resources are considered too speculative geologically for the application of economic considerations that would allow them to be categorized as Mineral Reserves - and there is no certainty that the results will be realized. Mineral Resources do not have demonstrated economic viability and are not Mineral Reserves.
A National Instrument 43-101 technical report will be filed on SEDAR at www.sedar.com and on the Ivanhoe Mines website at www.ivanhoemines.com within 45 days of the issuance of this news release. The technical report also will include an updated Kamoa pre-feasibility study, which evaluates the development of the Kansoko Mine as a stand-alone 6 Mtpa underground mine and surface processing complex that would be supplied with ore from the planned development of the Kansoko Sud and Kansoko Centrale areas of the Kamoa Deposit. The Kamoa 2019 PFS will restate the findings of the Kamoa 2017 PFS with economics based on updated assumptions.

Map of the Kamoa-Kakula mining licence showing the Kakula and Kansoko mining areas, as well as Kakula West, Kamoa North, and a portion of Ivanhoe's adjacent, 100%-owned Western Foreland exploration-licences area.
To view an enhanced version of this map, please visit:
https://orders.newsfilecorp.com/files/3396/42671_1589eb07840f79c5_002full.jpg
"The new PFS and PEA, independently prepared by six of the world's top engineering firms, reinforces the fact that Kamoa-Kakula is unquestionably the world's best undeveloped copper discovery," said Mr. Friedland. "Kamoa-Kakula is unique as it combines ultra-high copper grades in thick, shallow and flat-lying orebodies ─ allowing for large-scale, highly-productive, mechanized underground mining operations. Kakula is projected to have an average grade of 6.8% copper over the initial five years of operations, and 6.4% copper over the first 10 years ─ grades that are orders of magnitude higher than the majority of the world's other major copper mines.
"This mine is getting built. And, most importantly, it is being built to international best practices that will be a showcase for responsible mine development.
"As good as the economic numbers are in this PFS for Kakula, you simply cannot apply conventional discounted cash flow analysis to Tier One projects like Kamoa-Kakula and expect to get a sensible answer on long-term value. Massive, high-grade deposits like we have found at Kamoa-Kakula ─ which have the potential to produce large quantities of copper for multiple generations ─ are very long-term plays. The real value is generated over time, in the phased expansions.
"Ten years ago at the World Copper Conference in Santiago, Chile, we announced to the world that Ivanhoe Mines had "made a major copper discovery of historic importance" in a previously unrecognized area that was beyond the western end of the Copperbelt in the Congo, and that "Kamoa will become a world-class mining camp of great importance to the Democratic Republic of Congo."
"Today, together with our partners, Zijin Mining and the government of the DRC, and the outstanding work by our exceptionally talented team at Kamoa-Kakula, comprised mainly of bright, young Congolese men and women, we are making these bold predictions come true.
"We invite institutional investors and analysts to visit the DRC, meet the people, and see first-hand how our team is transforming the original Kamoa discovery we announced 10 years ago into a state-of-the-art mining operation with the potential to become one of the world's three largest copper mines, with peak annual production of more than 700,000 tonnes of copper.

Photo. Robert Friedland greeting Kamoa-Kakula employees during a site visit.
To view an enhanced version of this photo, please visit:
https://orders.newsfilecorp.com/files/3396/42671_1589eb07840f79c5_003full.jpg
Mr. Johansson, Chief Executive Officer and President of Ivanhoe Mines, said that discussions for financing the construction of the initial 6 Mtpa mine at Kakula are progressing well with China-based financial institutions. CITIC Metal, Ivanhoe's largest shareholder, is assisting with the discussions.
Mr. Johansson also noted that today's economic assessments do not factor in the recent exploration success at Kamoa North, which is a prospective new mining area. The current study also does not factor in the ongoing drilling programs on new targets at Kamoa-Kakula or the company's 100%-owned Western Foreland exploration area. Additional exploration successes that already have occurred may well have a significant positive influence on the size, value, and timing of the overall development plan; as such, the Kamoa-Kakula development plans will be continuously reassessed and amended as the project moves forward to reflect ongoing exploration success.
"The 18 million-tonne-per-annum development scenario clearly shows the economic potential for a phased development plan for Kamoa-Kakula to become one of the largest copper mines in existence," said Mr. Johansson. "However, as evidenced by our remarkable discovery hole drilled at Kamoa North announced last week ─ the thickest high-grade intersection yet at Kamoa-Kakula returning 13.05% copper over 22.3 metres starting at a depth of only 190 metres below surface ─ we are confident that there are more high-grade copper discoveries to be made in the area and the ultimate scale of operations at Kamoa-Kakula can be much larger. We see no geological limitation to the goal of eventually producing one million tonnes of copper per year.
"While our engineers are focused on expediting the development of the initial Kakula Mine, our geological team remains focused on unlocking the full potential of the Kamoa-Kakula and Western Foreland copper districts. We plan to keep the drills turning as we continue our search for the next Kakula, or perhaps an even better discovery.
Mr. Johansson also said that the implementation of community-support initiatives at Kamoa-Kakula are central to mine-planning considerations. "Ivanhoe and Zijin are proud of our community-support initiatives that include fish and chicken farming, agricultural projects, and the construction of new schools, houses, clinics, roads and power infrastructure.
"We already have made significant improvements in the lives of the Congolese people living in the communities near Kamoa-Kakula that will help promote and define their children's health and education for the foreseeable future."

Photo. Secondary students in one of the new schools built in a village near the Kamoa-Kakula Project, as part of the project's community relations program.
To view an enhanced version of this photo, please visit:
https://orders.newsfilecorp.com/files/3396/42671_1589eb07840f79c5_004full.jpg
HIGHLIGHTS
Initial 6 Mtpa mine at Kakula
The Kakula 2019 PFS analyzes the development of an initial 6 Mtpa Kakula Mine at the Kakula Deposit in the southerly portion of the Kamoa-Kakula Project's discovery area. For this option, the PFS envisages an average annual production rate of 291,000 tonnes of copper at a mine-site cash cost of US$0.46 per pound (lb) copper and total cash cost of US$1.11/lb copper for the first 10 years of operations, and copper annual production of up to 360,000 tonnes by year four.
An initial capital cost of US$1.1 billion for this option would result in an after-tax net present value at an 8% discount rate (NPV8%) of US$5.4 billion. The internal rate of return of 46.9% and project payback period of 2.6 years confirm the compelling economics for the Kamoa-Kakula Project's stage one of production.
Kakula benefits from an ultra-high, average feed grade of 6.8% copper over the first five years of operations, and 5.5% copper on average over a 25-year mine life.
Basic engineering is underway, expected to be completed around mid-year, running in parallel with a definitive feasibility study expected to be completed around year-end.
Development of twin underground declines has been completed at Kakula, with ongoing underground development activities, including access drives and ventilation raises. In addition, a box cut for a ventilation decline on the southern side of the Kakula orebody is nearing completion.
Modular, integrated, expanded development option of Kakula and Kamoa deposits, mining a total of 18 Mtpa, with construction of a direct-to-blister smelter
The Kamoa-Kakula 2019 PEA presents the alternative development option of a three-phase, sequential operation on Kamoa-Kakula's high-grade copper deposits.
Initial production would occur at a rate of 6 Mtpa from the Kakula Mine, before increasing to 12 Mtpa with mill feed from the Kansoko Mine. A third 6 Mtpa mine then will be developed at Kakula West, bringing total production rate to 18 Mtpa. As resources at Kakula and Kansoko are mined, the PEA envisages that production would begin at several mines in the Kamoa North area to maintain 18 Mtpa throughput over a 37-year mine life.
For the three-phase sequential operation, the PEA envisages US$1.1 billion in initial capital costs. Future expansion at the Kansoko Mine, Kakula West Mine and subsequent extensions could be funded by cash flows from the Kakula Mine, resulting in an after-tax net present value at an 8% discount rate (NPV8%) of US$10.0 billion and an internal rate of return of 41%.
Under this approach, the PEA also includes the construction of a direct-to-blister flash copper smelter at the Kakula plant site with a capacity of one million tonnes of copper concentrate per annum to be funded from internal cash flows. This would be completed in year five of operations, achieving significant savings in treatment charges and transportation costs.
The 18 Mtpa scenario delivers average annual production of 382,000 tonnes of copper at a total cash cost of US$0.93/lb copper during the first 10 years of operations and production of 740,000 tonnes by year 12. At this future production rate, Kamoa-Kakula would rank as the world's second largest copper mine.
Figure 1 describes the expanded development scenario for the Kamoa-Kakula 2019 PEA and Figure 2 shows an overview of deposits included within the Kakula 2019 PFS (6 Mtpa case), Kamoa 2019 PFS (6 Mtpa) and Kamoa-Kakula 2019 PEA (18 Mtpa). Additional exploration success at Kakula West, Kamoa North or regional exploration targets may well have a significant, positive influence on the size, value and timing of the overall development plan.

Figure 1. Kamoa-Kakula 18 Mtpa PEA long-term development plan.
To view an enhanced version of Figure 1, please visit:
https://orders.newsfilecorp.com/files/3396/42671_1589eb07840f79c5_005full.jpg
Figure by OreWin 2019.

Figure 2. Overview of deposits included within the Kakula 2019 PFS (6 Mtpa ─ outlined in red box), Kamoa 2019 PFS (6 Mtpa ─ outlined in blue box) and Kamoa-Kakula 2019 PEA (outlined in green box).
To view an enhanced version of Figure 2, please visit:
https://orders.newsfilecorp.com/files/3396/42671_1589eb07840f79c5_006full.jpg
Figure by OreWin 2019.
Summary of the PFS's key results for an initial Kakula Mine
Very-high-grade, stage-one production is projected to have a grade of 7.1% copper in the second year of production and an average grade of 6.4% copper over the initial 10 years of operations, resulting in estimated average annual copper production of 291,000 tonnes.
Annual copper production is estimated at 360,000 tonnes in year four.
Initial capital cost, including contingency, is estimated at US$1.1 billion.
Average total cash cost of US$1.11/lb copper during the first 10 years, inclusive of royalties.
After-tax NPV, at an 8% discount rate, of US$5.4 billion.
After-tax internal rate of return (IRR) of 46.9%, and a payback period of 2.6 years.
Kakula is expected to produce a very-high-grade copper concentrate in excess of 55% copper, with extremely low arsenic levels.
Key initial projections from the Kakula 2019 PFS
The study assesses the potential development of the Kakula Deposit as a 6 Mtpa mining and processing complex. The Kakula mill would be constructed in two smaller phases of 3 Mtpa each as the mining operations ramp-up to full production of 6 Mtpa. The life-of-mine production scenario provides for 119.7 million tonnes to be mined at an average grade of 5.48% copper, producing 9.8 million tonnes of high-grade copper concentrate, containing approximately 12.4 billion pounds of copper.
The economic analysis uses a consensus, long-term copper price of US$3.10/lb and returns an after-tax NPV at an 8% discount rate of US$5.4 billion. It has an after-tax IRR of 46.9% and a payback period of 2.6 years.
The estimated initial capital cost, including contingency, is US$1.1 billion. The capital expenditure for off-site power, which is included in the initial capital cost, includes advances to the DRC state-owned electricity company, Société Nationale d'Electricité (SNEL), to upgrade two hydropower plants (Koni and Mwadingusha) to provide the Kamoa-Kakula Project with access to clean electricity for its planned operations.
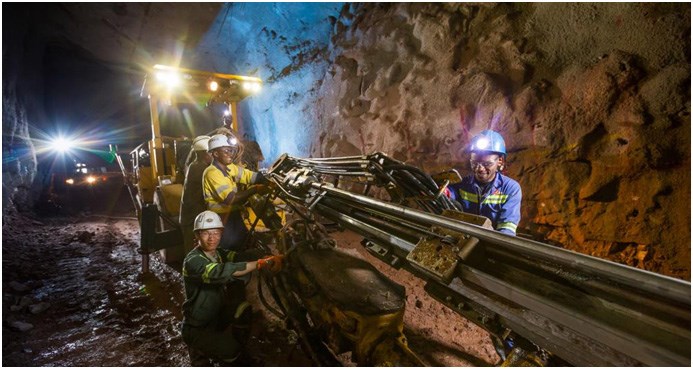
Photo. Kakula's initial two declines intersected the mineralized reef on the northern edge of the Kakula Deposit in late January and underground mine development now is progressing toward the initial, high-grade mining area.
To view an enhanced version of this photo, please visit:
https://orders.newsfilecorp.com/files/3396/42671_1589eb07840f79c5_007full.jpg
Key results of the Kakula 2019 PFS for a single 6 Mtpa mine are summarized in Table 1.
Table 1. Kakula Mine results summary for 6 Mtpa production.
| Item | Unit | Total |
| Total Processed | | |
| Quantity Milled | kt | 119,728 |
| Copper Feed Grade | % | 5.48 |
| Total Concentrate Produced | | |
| Copper Concentrate Produced | kt (dry) | 9,776 |
| Copper Recovery | % | 85.35 |
| Copper Concentrate Grade | % | 57.32 |
| Contained Copper in Concentrate | Mlb | 12,354 |
| Contained Copper in Concentrate | kt | 5,604 |
| Peak Annual Recovered Copper Production | kt | 360 |
| 10-Year Average | | |
| Copper Concentrate Produced | kt (dry) | 508 |
| Contained Copper in Concentrate | kt | 291 |
| Mine-Site Cash Cost | US$/lb payable | 0.46 |
| Total Cash Cost | US$/lb payable | 1.11 |
| 5-Year Average | | |
| Copper Concentrate Produced | kt (dry) | 465 |
| Contained Copper in Concentrate | kt | 267 |
| Mine-Site Cash Cost | US$/lb payable | 0.43 |
| Total Cash Cost | US$/lb payable | 1.08 |
| Key Financial Results | | |
| Peak Funding | US$M | 1,099 |
| Initial Capital Costs | US$M | 1,078 |
| Expansion Capital Costs | US$M | 778 |
| LOM Average Mine Site Cash Costs | US$/lb payable | 0.59 |
| LOM Average Total Cash Costs | US$/lb payable | 1.24 |
| Site Operating Costs | US$/t Milled | 59.4 |
| After-Tax NPV8% | US$M | 5,440 |
| After-Tax IRR | % | 46.9 |
| Project Payback Period | Years | 2.6 |
| Project Life | Years | 25 |
Table 2 summarizes the financial results and Table 3 summarizes potential mine production and processing statistics.
Table 2. Kakula Mine financial results for 6 Mtpa production.
| Net Present Value (US$M) | Discount Rate | Before Taxation | After Taxation |
| | Undiscounted | 19,317 | 13,575 |
| | 4.0% | 12,053 | 8,411 |
| | 6.0% | 9,693 | 6,733 |
| | 8.0% | 7,875 | 5,440 |
| | 10.0% | 6,457 | 4,432 |
| | 12.0% | 5,336 | 3,635 |
| Internal Rate of Return | - | 55.6% | 46.9% |
| Project Payback Period (Years) | - | 2.4 | 2.6 |
Table 3. Kakula Mine average estimated production and processing statistics for 6 Mtpa production.
| Item | Unit | YEARS 1-5 | YEARS 1-10 | LOM AVERAGE |
| Total Processed | | | | |
| Quantity Milled | kt | 4,589 | 5,321 | 4,789 |
| Copper Feed Grade | % | 6.79 | 6.39 | 5.48 |
| Annual Concentrate Produced | | | | |
| Copper Concentrate Produced | kt (dry) | 465 | 508 | 391 |
| Copper Recovery | % | 85.6 | 85.6 | 85.3 |
| Copper Concentrate Grade | % | 57.3 | 57.3 | 57.3 |
| Contained Copper in Concentrate | | | | |
| Copper | Mlb | 588 | 642 | 494 |
| Copper | kt | 267 | 291 | 224 |
| Payable Copper | | | | |
| Copper | Mlb | 575 | 628 | 483 |
| Copper | kt | 261 | 285 | 219 |
The Kakula concentrator production is shown in Figure 3 and the concentrate and copper production is shown in Figure 4.

Figure 3. Kakula Mine estimated tonnes milled and head grade for the life-of-mine.
To view an enhanced version of Figure 3, please visit:
https://orders.newsfilecorp.com/files/3396/42671_1589eb07840f79c5_008full.jpg
Figure by OreWin 2019.
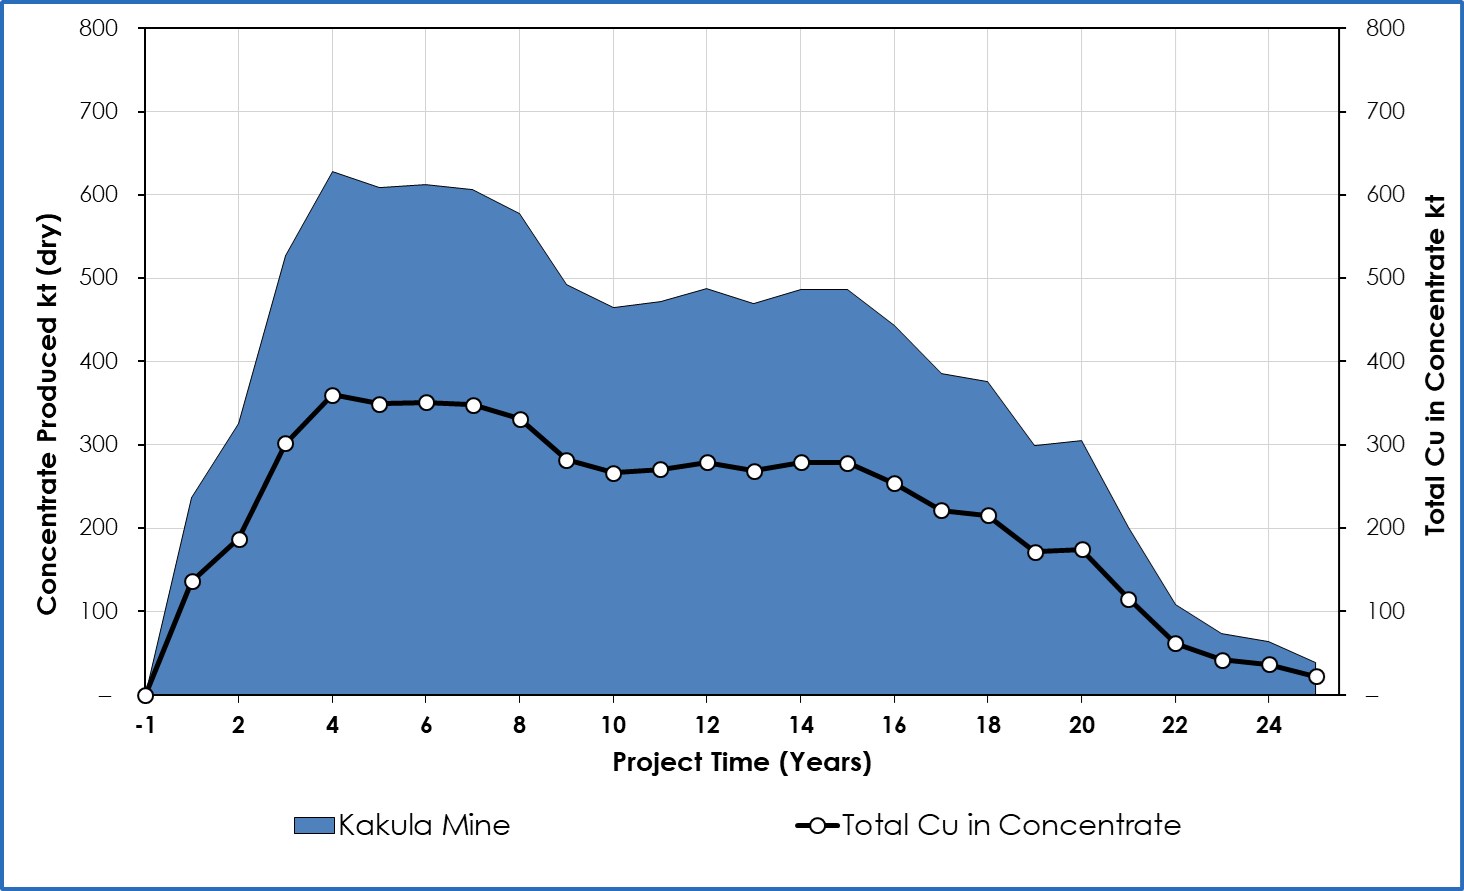
Figure 4. Kakula Mine estimated concentrate and copper production for the life-of-mine.
To view an enhanced version of Figure 4, please visit:
https://orders.newsfilecorp.com/files/3396/42671_1589eb07840f79c5_009full.jpg
Figure by OreWin 2019.
Table 4 summarizes unit operating costs. Table 5 provides a breakdown of revenue and operating costs. Capital costs for the project are detailed in Table 6.
Table 4. Kakula Mine unit operating costs for 6 Mtpa production.
| | US$/lb Payable Copper | ||
| | YEARS 1-5 | YEARS 1-10 | LOM AVERAGE |
| Mine Site | 0.43 | 0.46 | 0.59 |
| Transport | 0.31 | 0.31 | 0.31 |
| Treatment & Refining Charges | 0.15 | 0.15 | 0.15 |
| Royalties & Export Tax | 0.20 | 0.20 | 0.20 |
| Total Cash Costs | 1.08 | 1.11 | 1.24 |

Figure 5. 2019 Mine-site cash cost curve (includes all operational costs at mine site).
To view an enhanced version of Figure 5, please visit:
https://orders.newsfilecorp.com/files/3396/42671_1589eb07840f79c5_010full.jpg
Note: Represents mine-site cash costs that reflect the direct cash costs of producing paid concentrate or cathode incorporating mining, processing and mine-site G&A costs. Kakula is based on the average mine-site cash cost during the first 10 years as detailed in the Kakula 2019 PFS.
Source: Wood Mackenzie (based on public disclosure, the Kakula 2019 PFS has not been reviewed by Wood Mackenzie).

Figure 6. 2019 C1 pro-rata copper cash cost curve (includes mining, processing, transportation and offsite realization costs).
To view an enhanced version of Figure 6, please visit:
https://orders.newsfilecorp.com/files/3396/42671_1589eb07840f79c5_011full.jpg
Note: Represents C1 pro-rata cash costs that reflect the direct cash costs of producing paid copper incorporating mining, processing, mine-site G&A and offsite realization costs, having made appropriate allowance for the costs associated with the co-product revenue streams. Kakula is based on the average total cash cost during the first 10 years as detailed in the Kakula 2019 PFS.
Source: Wood Mackenzie (based on public disclosure, the Kakula 2019 PFS has not been reviewed by Wood Mackenzie).
Table 5. Kakula Mine estimated revenue and operating costs for 6 Mtpa production.
| | TOTAL LOM | YEARS 1-5 | YEARS 1-10 | LOM AVERAGE |
| | US$M | US$/t Milled | ||
| Revenue | | | | |
| Copper in Concentrate | 37,429 | 388.3 | 365.6 | 312.6 |
| Gross Sales Revenue | 37,429 | 388.3 | 365.6 | 312.6 |
| Less: Realization Costs | | | | |
| Transport | 3,707 | 38.5 | 36.2 | 31.0 |
| Treatment & Refining | 1,770 | 18.4 | 17.3 | 14.8 |
| Royalties & Export Tax | 2,403 | 24.9 | 23.5 | 20.1 |
| Total Realization Costs | 7,880 | 81.8 | 77.0 | 65.8 |
| Net Sales Revenue | 29,549 | 306.6 | 288.6 | 246.8 |
| Site Operating Costs | | | | |
| Underground Mining | 4,585 | 34.4 | 35.2 | 38.3 |
| Processing | 1,574 | 13.1 | 12.5 | 13.1 |
| General & Administration | 816 | 6.4 | 6.0 | 6.8 |
| SNEL Discount | -212 | -2.4 | -2.5 | -1.7 |
| Customs | 347 | 2.7 | 2.7 | 2.9 |
| Total | 7,111 | 54.0 | 54.0 | 59.4 |
| Net Operating Margin | 22,438 | 252.5 | 234.7 | 187.4 |
| Net Operating Margin | 75.9% | 82.4% | 81.3% | 75.9% |
Table 6. Kakula Mine estimated capital investment summary for 6 Mtpa production.
| Description | Initial Capital | Expansion Capital | Sustaining Capital | Total |
| | US$M | US$M | US$M | US$M |
| MINING | | | | |
| Underground Mining | 287 | 339 | 633 | 1,259 |
| Capitalized Pre-Production | 107 | - | - | 107 |
| Subtotal | 394 | 339 | 633 | 1,367 |
| POWER | | | | |
| Power Supply Off Site | 64 | - | - | 64 |
| Subtotal | 64 | - | - | 64 |
| CONCENTRATOR & TAILINGS | | | | |
| Process Plant | 190 | 125 | 219 | 534 |
| Tailings | - | - | 83 | 83 |
| Subtotal | 190 | 125 | 303 | 617 |
| INFRASTRUCTURE | | | | |
| Surface and Plant Infrastructure | 132 | 138 | 187 | 458 |
| Subtotal | 132 | 138 | 187 | 458 |
| INDIRECTS | | | | |
| EPCM | 56 | 40 | 4 | 100 |
| Owners Cost | 103 | 25 | - | 128 |
| Customs Duties | 29 | 22 | 38 | 90 |
| Closure | - | - | 69 | 69 |
| Subtotal | 188 | 88 | 111 | 387 |
| CAPITAL EXPENDITURE BEFORE CONTINGENCY | 968 | 690 | 1,234 | 2,893 |
| Contingency | 110 | 88 | 62 | 259 |
| CAPITAL EXPENDITURE AFTER CONTINGENCY | 1,078 | 778 | 1,295 | 3,152 |

Figure 7. Capital intensity for large-scale copper projects.
To view an enhanced version of Figure 7, please visit:
https://orders.newsfilecorp.com/files/3396/42671_1589eb07840f79c5_012full.jpg
Note: Recently approved, probable and possible projects with nominal copper production capacity in excess of 200 kt/a (based on public disclosure and information gathered in the process of routine research). Source: Wood Mackenzie (based on public disclosure, the Kakula 2019 PFS has not been reviewed by Wood Mackenzie).
The after-tax NPV sensitivity to copper price variation is shown in Table 7 for copper prices from US$2.00/lb to US$4.00/lb. The annual and cumulative cash flows are shown in Figure 8.
Table 7. Kakula Mine copper price sensitivity.
| After-Tax NPV (US$M) | Copper Price - US$/lb | |||||
| Discount Rate | 2.00 | 2.50 | 3.00 | 3.10 | 3.50 | 4.00 |
| Undiscounted | 4,541 | 8,656 | 12,757 | 13,575 | 16,840 | 20,920 |
| 4.0% | 2,694 | 5,298 | 7,892 | 8,411 | 10,478 | 13,061 |
| 6.0% | 2,070 | 4,194 | 6,310 | 6,733 | 8,418 | 10,525 |
| 8.0% | 1,581 | 3,339 | 5,090 | 5,440 | 6,835 | 8,577 |
| 10.0% | 1,195 | 2,670 | 4,138 | 4,432 | 5,600 | 7,060 |
| 12.0% | 887 | 2,140 | 3,386 | 3,635 | 4,626 | 5,863 |
| IRR | 22.7% | 34.7% | 45.0% | 46.9% | 54.1% | 62.5% |
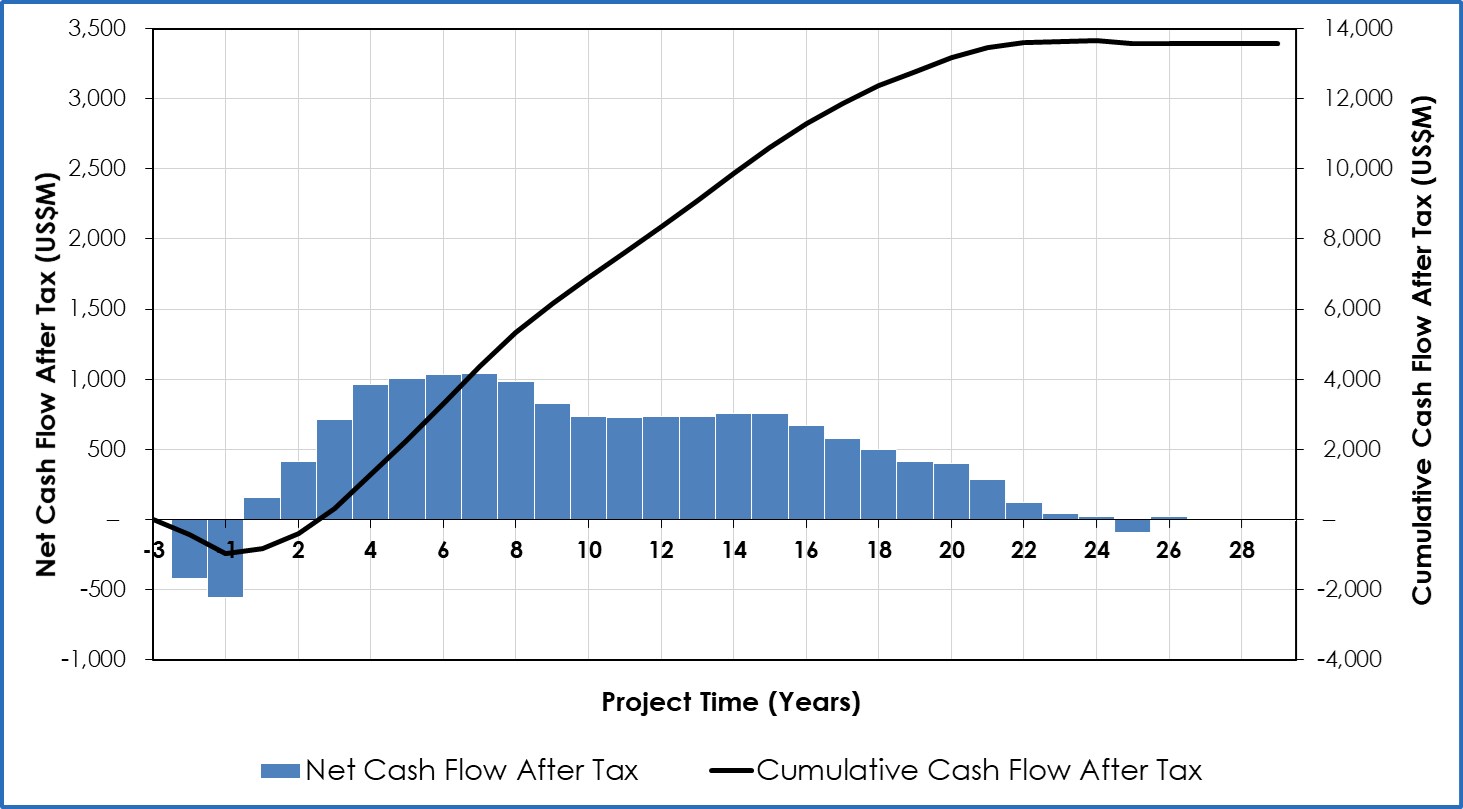
Figure 8. Kakula Mine projected annual and cumulative cash flow.
To view an enhanced version of Figure 8, please visit:
https://orders.newsfilecorp.com/files/3396/42671_1589eb07840f79c5_013full.jpg
Figure by OreWin 2019.
Kamoa and Kakula 2019 Mineral Resources
The 2019 Kamoa and Kakula Indicated and Inferred Mineral Resource estimate was prepared by George Gilchrist, Ivanhoe Mines' Mineral Resources Manager, under the direction of Dr. Harry Parker and Gordon Seibel, both RM SME, of Amec Foster Wheeler, of Reno, USA, and is reported in accordance with the 2014 CIM Definition Standards for Mineral Resources and Mineral Reserves. Dr. Parker and Mr. Seibel are the Qualified Persons for the estimate.
The total, combined Indicated and Inferred Mineral Resources for the Kamoa-Kakula Project is shown in Table 8. Tables showing the Indicated and Inferred Mineral Resources separately for the Kamoa and Kakula deposits, as well as the sensitivity of Mineral Resources to cut-off grade, are shown in the appendices to this release.
Table 8. Total Kamoa and Kakula Indicated and Inferred Mineral Resource (at 1% total copper cut-off grade).
| Deposit | Category | Tonnes (millions) | Area (Sq. km) | Copper Grade (%) | Vertical Thickness (m) | Contained Copper (kt) | Contained Copper (billion lbs) |
| Kamoa | Indicated | 759 | 50.7 | 2.57 | 5.5 | 19,500 | 43.0 |
| Inferred | 202 | 19.4 | 1.85 | 3.8 | 3,740 | 8.2 | |
| Kakula | Indicated | 628 | 21.5 | 2.72 | 10.5 | 17,100 | 37.6 |
| Inferred | 114 | 5.9 | 1.59 | 6.9 | 1,810 | 4.0 | |
| Total Kamoa-Kakula Project | Indicated | 1,387 | 72.2 | 2.64 | 6.9 | 36,600 | 80.6 |
| Inferred | 316 | 25.3 | 1.76 | 4.5 | 5,550 | 12.2 |
Notes to accompany the total, combined Kamoa and Kakula 2019 Mineral Resource table
- Ivanhoe's Mineral Resources Manager George Gilchrist, a Fellow of the Geology Society of South Africa and Professional Natural Scientist (Pr. Sci. Nat) with the South African Council for Natural Scientific Professions (SACNASP), estimated the Mineral Resources under the supervision of Dr. Harry Parker and Gordon Seibel, both Registered Members (RM) of the Society for Mining, Metallurgy and Exploration (SME), employees of Amec Foster Wheeler, who are the Qualified Persons for the Mineral Resource estimate. The effective date of the estimate for Kamoa is November 27, 2017, and the cut-off date for drill data is November 23, 2015. The Kakula Mineral Resource is a combination of separate Kakula and Kakula West models, with the West Scarp fault forming the boundary between the two. The effective date of the estimate for Kakula is April 13, 2018, and the cut-off date for the drill data is January 26, 2018. The effective date of the estimate for Kakula West is November 10, 2018, and the cut-off date for the drill data is November 1, 2018. Mineral Resources are estimated using the CIM 2014 Definition Standards for Mineral Resources and Mineral Reserves. Mineral Resources are reported inclusive of Mineral Reserves on a 100% basis.
- Mineral Resources are reported using a total copper (TCu) cut-off grade of 1% TCu and a minimum vertical thickness of 3 metres (m). There are reasonable prospects for eventual economic extraction under assumptions of a copper price of US$3.00/lb, employment of underground mechanized room-and-pillar and drift-and-fill mining methods, and that copper concentrates will be produced and sold to a smelter. Mining costs are assumed to be US$27/t. Concentrator, tailings treatment, and general and administrative costs (G&A) are assumed to be US$17/t. Metallurgical recoveries are expected to average 84% (86% for hypogene and 81% for supergene). At a 1% TCu cut-off grade, assumed net smelter returns for 100% of Mineral Resource blocks will cover processing, tailings treatment and G&A costs.
- Reported Mineral Resources contain no allowances for hangingwall or footwall contact boundary loss and dilution. No mining recovery has been applied.
- Depth of mineralization below the surface ranges from 10 m to 1,320 m for Indicated Mineral Resources and 20 m to 1,560 m for Inferred Mineral Resources.
- Approximate drill hole spacings are 800 m for Inferred Mineral Resources and 400 m for Indicated Mineral Resources.
- Rounding as required by reporting guidelines may result in apparent summation differences between tonnes, grade and contained metal content.
Kakula 2019 PFS Mineral Reserve
The Kakula 2019 PFS Mineral Reserve has been estimated by Qualified Person Jon Treen, Senior Vice President, Stantec Consulting International LLC, using the 2014 CIM Definition Standards for Mineral Resources and Mineral Reserves to conform to the Canadian National Instrument 43-101 Standards of Disclosure for Mineral Projects. The total Mineral Reserve for the Kakula Project is shown in Table 9. The Mineral Reserve is based on the April 2018 Mineral Resource. The Mineral Reserve is entirely a Probable Mineral Reserve that was converted from Indicated Mineral Resources. The effective date of the Mineral Reserve statement is February 1, 2019.
Table 9. Kakula 2019 PFS Mineral Reserve Statement.
| | Tonnage (Mt) | Copper (%) | | Copper (Contained Mlb) | Copper (Contained kt) |
| Proven Mineral Reserve | - | - | | - | - |
| Probable Mineral Reserve | 119.7 | 5.48 | | 14,475 | 6,566 |
| Mineral Reserve | 119.7 | 5.48 | | 14,475 | 6,566 |
Notes to accompany Kakula 2019 PFS Mineral Reserve table
- The copper price used for calculating the financial analysis is long-term copper at US$3.10/lb. The analysis has been calculated with assumptions for smelter refining and treatment charges, deductions and payment terms, concentrate transport, metallurgical recoveries, and royalties.
- For mine planning, the copper price used to calculate block model Net Smelter Returns (NSRs) was US$3.00/lb.
- An elevated cut-off of US$100.00/t NSR was used to define the stoping blocks. A marginal cut-off of US$80.00/t NSR was used to define ore and waste.
- Indicated Mineral Resources were used to report Probable Mineral Reserves.
- Tonnage and grade estimates include dilution and recovery allowances.
- The Mineral Reserves reported above are not additive to the Mineral Resources.
The Kakula 2019 PFS Mineral Reserve targeted in the mine plan focused on maximizing the grade profile for a 6 Mtpa full production rate for 15 years, a five-year ramp-up, plus an 85% extraction and recovery allowance. As such, a range of NSR cut-offs were evaluated that identified a targeted resource of approximately 125 million tonnes at the highest NSR.
Tonnes and grades were calculated for the mining blocks, and allowances for unplanned dilution and mining recovery were applied to estimate the Mineral Reserve Statement.
Expanded 18 Mtpa development scenario for the Kakula and Kamoa deposits
The Kamoa-Kakula 2019 PEA also assesses an alternative development option of mining several deposits on the Kamoa-Kakula Project as an integrated, 18 Mtpa mining, processing and smelting complex, built in three stages. This scenario envisages the construction and operation of three separate mines: first, an initial 6 Mtpa mining operation would be established at the Kakula Mine on the Kakula Deposit; this is followed by a subsequent, separate 6 Mtpa mining operation at the Kansoko Mine using the existing twin declines that were completed in 2017; a third 6 Mtpa mine then will be established at the Kakula West Mine.
As the resources at the Kakula, Kansoko and Kakula West mines are mined out, production would begin sequentially at four other mines in the Kamoa North area to maintain throughput of 18 Mtpa to the then existing concentrator and smelter complex, as illustrated in Figure 2.
Each mining operation is expected to be a separate underground mine with a shared processing facility and surface infrastructure located at Kakula. Included in this scenario is the construction of a direct-to-blister flash copper smelter with a capacity of one million tonnes of copper concentrate per annum.
The Kamoa-Kakula 2019 PEA is preliminary in nature and includes an economic analysis that is based, in part, on Inferred Mineral Resources. Inferred Mineral Resources are considered too speculative geologically for the application of economic considerations that would allow them to be categorized as Mineral Reserves - and there is no certainty that the results will be realized. Mineral Resources do not have demonstrated economic viability and are not Mineral Reserves.
Summary of the PEA's key results for the 18 Mtpa development scenario
- Very-high-grade initial phase projected to have a grade of 7.1% copper in the second year of production and an average grade of 5.7% copper during the first 10 years of operations, resulting in estimated average annual copper production of 386,000 tonnes.
- Recovered copper production is estimated at 740,000 tonnes in year 12, which would rank the Kamoa-Kakula Project as the second largest copper producer in the world.
- Initial capital cost, including contingency, is US$1.1 billion, with subsequent expansions at Kansoko, Kakula West, and other mining areas, as well as the smelter, to be funded by cash flows from the Kakula Mine.
- Average total cash costs of US$0.93/lb copper during the first 10 years, including sulphuric acid credits.
- After-tax NPV, at an 8% discount rate, of US$10.0 billion.
- After-tax IRR of 40.9% and a payback period of 2.9 years.
Key results of this potential development scenario are summarized in tables 10, 11 and 12, and figures 9 & 10.
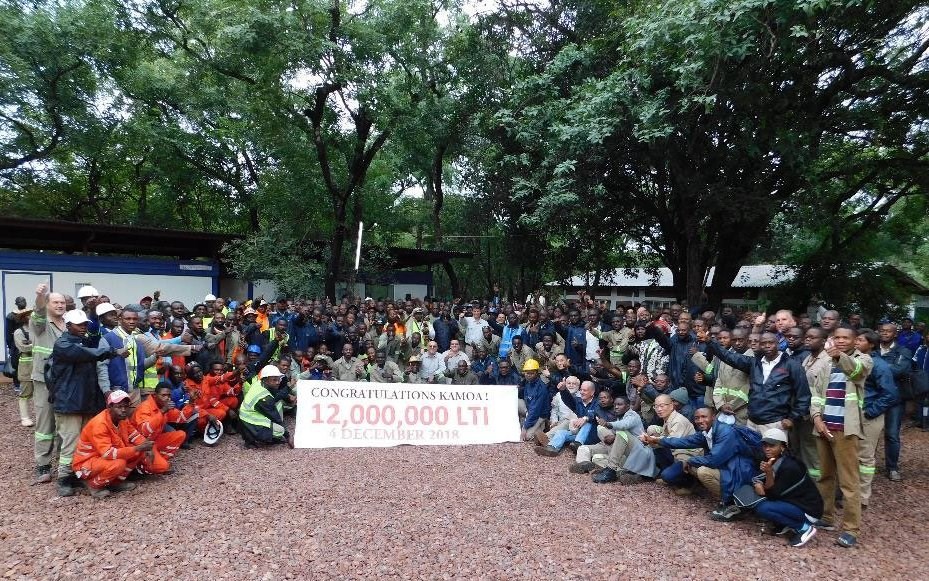
Photo: On December 4, 2018, we congratulated our Kamoa-Kakula employees and contractors for their outstanding workplace achievement of logging a total of 12 million hours without any lost-time injuries - the equivalent of approximately seven years of project progress. Their success is testament to the safety-focused culture that is a foundation of the conduct of the project's mine development and exploration activities.
To view an enhanced version of this photo, please visit:
https://orders.newsfilecorp.com/files/3396/42671_1589eb07840f79c5_014full.jpg
Table 10. 18 Mtpa Kamoa-Kakula 2019 PEA results summary.
| Item | Unit | Total |
| Total Processed | | |
| Quantity Milled | kt | 535,217 |
| Copper Feed Grade | % | 3.88 |
| Total Concentrate Produced | | |
| Copper Concentrate Produced | kt (dry) | 39,039 |
| Copper Concentrate - External Smelter | kt (dry) | 8,491 |
| Copper Concentrate - Internal Smelter | kt (dry) | 30,549 |
| Copper Recovery | % | 85.12 |
| Copper Concentrate Grade | % | 45.23 |
| Cont. Copper in Conc. - External Smelter | Mlb | 9,930 |
| Cont. Copper in Conc. - External Smelter | kt | 4,504 |
| Cont. Copper in Blister - Internal Smelter | Mlb | 28,559 |
| Cont. Copper in Blister - Internal Smelter | kt | 12,954 |
| Peak Annual Recovered Copper Production | kt | 740 |
| 10 Year Average | | |
| Copper Feed Grade | % | 5.66 |
| Copper Concentrate Produced | kt (dry) | 759 |
| Cont. Copper in Conc. - External Smelter | kt | 121 |
| Cont. Copper in Blister - Internal Smelter | kt | 261 |
| Mine Site Cash Cost (Including Smelter) | US$/lb payable | 0.63 |
| Total Cash Cost (After Credits) | US$/lb payable | 0.93 |
| Key Financial Results | | |
| Peak Funding | US$M | 1,099 |
| Initial Capital Costs | US$M | 1,078 |
| Expansion Capital Costs | US$M | 4,958 |
| LOM Avg. Mine Site Cash Cost (Including Smelter) | US$/lb payable | 0.86 |
| LOM Avg. Total Cash Costs (After Credits) | US$/lb payable | 1.10 |
| Site Operating Costs | US$/t Milled | 61.5 |
| After-Tax NPV8% | US$M | 10,030 |
| After-Tax IRR | % | 40.9 |
| Project Payback | Years | 2.9 |
| Project Life | Years | 37 |
Table 11. 18 Mtpa Kamoa-Kakula 2019 PEA unit operating costs.
| | US$/lb Payable Copper | ||
| | YEARS 1-5 | YEARS 1-10 | LOM AVERAGE |
| Mine Site (ex-Smelter) | 0.46 | 0.53 | 0.75 |
| Smelter | 0.04 | 0.09 | 0.11 |
| Transport | 0.25 | 0.17 | 0.15 |
| Treatment & Refining Charges | 0.12 | 0.08 | 0.08 |
| Royalties & Export Tax | 0.18 | 0.16 | 0.16 |
| Total Cash Costs Before Credits | 1.05 | 1.04 | 1.25 |
| Sulphuric Acid Credits1 | 0.03 | 0.11 | 0.15 |
| Total Cash Costs After Credits | 1.02 | 0.93 | 1.10 |
- Assumes a sulphuric acid price of US$250 per tonne.
Table 12. 18 Mtpa Kamoa-Kakula 2019 PEA copper price sensitivity.
| After-Tax NPV (US$M) | Copper Price (US$/lb) | |||||
| Discount Rate | 2.00 | 2.50 | 3.00 | 3.10 | 3.50 | 4.00 |
| Undiscounted | 13,117 | 25,902 | 38,668 | 41,222 | 51,435 | 64,154 |
| 4.0% | 5,684 | 11,850 | 18,008 | 19,240 | 24,165 | 30,307 |
| 6.0% | 3,788 | 8,311 | 12,828 | 13,731 | 17,341 | 21,845 |
| 8.0% | 2,510 | 5,931 | 9,347 | 10,030 | 12,758 | 16,164 |
| 10.0% | 1,627 | 4,286 | 6,939 | 7,469 | 9,587 | 12,231 |
| 12.0% | 1,005 | 3,120 | 5,229 | 5,651 | 7,332 | 9,433 |
| IRR | 18.0% | 28.9% | 39.0% | 40.9% | 48.3% | 57.0% |

Figure 9. 18 Mtpa Kamoa-Kakula 2019 PEA scenario mill feed and grade profile.
To view an enhanced version of Figure 9, please visit:
https://orders.newsfilecorp.com/files/3396/42671_1589eb07840f79c5_015full.jpg
Figure by OreWin 2019.
Figure 10. 18 Mtpa Kamoa-Kakula 2019 PEA scenario concentrate and copper production.
To view an enhanced version of Figure 10, please visit:
https://orders.newsfilecorp.com/files/3396/42671_1589eb07840f79c5_016full.jpg
Figure by OreWin 2019.

Figure 11. Projected 18 Mtpa Kamoa-Kakula PEA production (year-12 peak copper production shown) compared to the world's projected top 20 producing mines in 2025 by paid copper production.
To view an enhanced version of Figure 11, please visit:
https://orders.newsfilecorp.com/files/3396/42671_1589eb07840f79c5_017full.jpg
Note: Kamoa-Kakula 2019 PEA production based on projected peak copper production (which occurs in year 12) of the 18 Mtpa alternative development option.
Source: Wood Mackenzie (based on public disclosure, the Kakula 2019 PFS has not been reviewed by Wood Mackenzie).

Figure 12. Nominal production and head grade of the world's top 10 largest new greenfield projects.
To view an enhanced version of Figure 12, please visit:
https://orders.newsfilecorp.com/files/3396/42671_1589eb07840f79c5_018full.jpg
Note: Top 10 largest new greenfield copper projects defined as the 10 largest greenfield copper projects classified by Wood Mackenzie as "base case" or "probable" and ranked by nominal copper production (with the Kamoa-Kakula 2019 PEA and Kakula 2019 PFS's respective first 10 years' average annual production of copper in concentrate considered to be its nominal copper production).
Source: Wood Mackenzie, USGS (based on public disclosure, the Kamoa-Kakula 2019 PEA and Kakula 2019 PFS have not been reviewed by Wood Mackenzie).
Kakula to be mined primarily using drift-and-fill method
The Kakula 2019 PFS mine access is via twin declines on the north side (which have been completed) and a single decline on the south side of the deposit. One of the north declines will serve as the primary mine access, while the other will include the conveyor haulage system. The south decline will serve as a secondary operational ingress/egress and will facilitate critical early mine development.
From the bottom of the north and south declines, a pair of perimeter drifts will be driven to the east and west extremities of the deposit and will serve as the primary accesses to the production areas. These drifts also will be used as the primary intake and exhaust ventilation circuits and will connect with a series of intake and exhaust ventilation shafts.
The primary ore handling system will include perimeter conveyor drifts and load-out points along the north side of the deposit. The perimeter conveyor drifts will terminate at the main conveyor decline. Connection drifts between the north and south perimeter drifts will provide access and ventilation to the planned mining areas. The mining methods for the Kakula Deposit are drift-and-fill using paste backfill, and room-and-pillar. Approximately 99% of the deposit will be mined using drift-and-fill, which was chosen to maximize the extraction of high-grade Kakula ore. Mine access and primary development are shown in Figure 13.

Figure 13. Kakula 2019 PFS mine development.
To view an enhanced version of Figure 13, please visit:
https://orders.newsfilecorp.com/files/3396/42671_1589eb07840f79c5_019full.jpg
Figure by Stantec 2019.
Kakula 2019 PFS concentrator design similar to the PEA
The Kakula concentrator would be constructed in a phased approach with two 3 Mtpa modules as the mining operations ramp-up to full production of 6 Mtpa.
The Kakula concentrator design incorporates a run-of-mine stockpile, followed by two stages of screening and crushing on surface. The crushed material with a size distribution of 80% passing (or P80) eight millimetres (mm), is fed into a two-stage ball-milling circuit for further size reduction to a target grind size 80% passing 53 micrometres (µm).
The milled slurry will be passed through a rougher and scavenger flotation. The high-grade, or fast-floating rougher concentrate, and medium-grade, or slow-floating scavenger concentrate, will be collected separately. The rougher concentrate is upgraded in the low entrainment high-grade cleaner stage to produce a high-grade concentrate.
The medium-grade scavenger concentrate together with the tailings from the rougher cleaning stage and the tailings from the scavenger recleaner stage will be combined and further upgraded in the scavenger cleaner circuit. The concentrate produced from the scavenger cleaner circuit, representing roughly 12% of the mill feed, will be re-ground to a P80 of 10µm prior to final cleaning in the low entrainment scavenger recleaner stage.
The scavenger recleaner concentrate then will be combined with the high-grade cleaner concentrate to form the final concentrate. The final concentrate will be thickened before being pumped to the concentrate filter where the filter cake then will be bagged for shipment to market.
The tailings will flow through a series of cyclones at the backfill plant utilizing 55% of the tailings for backfill. The remaining 45% of the tailings will be pumped to the tailings storage facility.
Photo. Hongbing Li and Lydia Makong, Kamoa-Kakula geologists, and David Edwards, Geology Manager, Kamoa Copper Project (right), reviewing a chart of recent drill holes at the Kamoa North Discovery ─ including hole DD1450 that intersected 22.3 metres of 13.05% copper (at a 2% cut-off grade), beginning at a depth of only 190 metres below surface.
To view an enhanced version of this photo, please visit:
https://orders.newsfilecorp.com/files/3396/42671_1589eb07840f79c5_020full.jpg

Photo. Eco-livelihoods staff with pineapples harvested at the Kamoa-Kakula Project garden. Production and sale of pineapples is one of the new, community socio-economic projects supported by the Kamoa Copper Sustainable Livelihoods Program, and helps provide local community members with opportunities to earn additional income.
To view an enhanced version of this photo, please visit:
https://orders.newsfilecorp.com/files/3396/42671_1589eb07840f79c5_021full.jpg
Qualified persons
The following companies have undertaken work in preparation of the Kakula 2019 PFS, Kamoa 2019 PFS and Kamoa-Kakula 2019 PEA:
- OreWin - Overall report preparation, mining, logistics, power and economic analysis.
- Amec Foster Wheeler - Mineral Resource estimation.
- DRA Global - Mine surface infrastructure and metallurgical processing.
- KGHM Cuprum - Technical advisor on certain mining methods and geotechnical.
- SRK Consulting - Mine geotechnical recommendations.
- Stantec - Mining and Mineral Reserves.
The independent Qualified Persons responsible for preparing the Kakula 2019 PFS, Kamoa 2019 PFS and Kamoa-Kakula 2019 PEA, on which the technical report will be based, are Bernard Peters (OreWin); Dr. Harry Parker (Amec Foster Wheeler); Gordon Seibel (Amec Foster Wheeler); Marius Phillips (DRA Global); Greg Ruiter (DRA Global); William Joughin (SRK); and Jon Treen (Stantec). Each Qualified Person has reviewed and approved the information in this news release relevant to the portion of the Kakula 2019 PFS, Kamoa 2019 PFS and Kamoa-Kakula 2019 PEA for which they are responsible.
Other scientific and technical information in this news release has been reviewed and approved by Stephen Torr, P.Geo., Ivanhoe Mines' Vice President, Project Geology and Evaluation, a Qualified Person under the terms of National Instrument 43-101. Mr. Torr is not independent of Ivanhoe Mines. Mr. Torr has verified the technical data disclosed in this news release.
Wood Mackenzie provided data based on public disclosure of comparable copper projects for the compilation of certain figures used in this release; however, Wood Mackenzie did not review the Kakula 2019 PFS or Kamoa-Kakula 2019 PEA.
Data verification and quality control and assurance
Amec Foster Wheeler reviewed the sample chain of custody, quality assurance and control procedures, and qualifications of analytical laboratories. Amec Foster Wheeler is of the opinion that the procedures and QA/QC control are acceptable to support Mineral Resource estimation. Amec Foster Wheeler also audited the assay database, core logging and geological interpretations on a number of occasions between 2009 and 2018 and has found no material issues with the data as a result of these audits.
In the opinion of the Amec Foster Wheeler Qualified Persons, the data verification programs undertaken on the data collected from the Kamoa-Kakula Project support the geological interpretations. The analytical and database quality and the data collected can support Mineral Resource estimation.
Ivanhoe Mines maintains a comprehensive chain of custody and QA/QC program on assays from its Kamoa-Kakula Copper Project. Half-sawn core is processed at its on-site preparation laboratory in Kamoa, prepared samples then are shipped by secure courier to Bureau Veritas Minerals (BVM) Laboratories in Australia, an ISO17025 accredited facility. Copper assays are determined at BVM by mixed-acid digestion with ICP finish. Industry-standard certified reference materials and blanks are inserted into the sample stream prior to dispatch to BVM. For detailed information about assay methods and data verification measures used to support the scientific and technical information, please refer to the Kamoa-Kakula 2018 Resource Update, March 2018 technical report available on the SEDAR profile of Ivanhoe Mines at www.sedar.com or under technical reports on the Ivanhoe Mines website at www.ivanhoemines.com.
About Ivanhoe Mines
Ivanhoe Mines is a Canadian mining company focused on advancing its three principal projects in Southern Africa: the development of new mines at the Kamoa-Kakula copper discovery in the Democratic Republic of Congo (DRC) and the Platreef palladium-platinum-nickel-copper-gold discovery in South Africa; and the extensive redevelopment and upgrading of the historic Kipushi zinc-copper-germanium-silver mine, also in the DRC.
Information contacts
InvestorsBill Trenaman +1.604.331.9834
Media
North America: Kimberly Lim +1.778.996.8510
South Africa: Jeremy Michaels +27.82.939.4812
Certain statements in this release constitute "forward-looking statements" or "forward-looking information" within the meaning of applicable securities laws, including without limitation: (i) the results of the Kakula 2019 PFS, the Kamoa-Kakula 2019 PEA and the Kamoa 2019 PFS, including the development of a 6 Mtpa operation at Kakula and an expended 18 Mtpa at Kakula-Kamoa; (ii) statements regarding the construction of the mine at any of the deposits; (iii) the construction of a direct-to-blister flash copper smelter with a capacity of one million tonnes of copper concentrate; (iv) the development of mines at Kamoa North; and (v) mining at Kakula to be primarily using the drift and fill method; and (vi) the design and specifications of the Kakula concentrator.
Such statements involve known and unknown risks, uncertainties and other factors which may cause the actual results, performance or achievements of Ivanhoe Mines, or industry results, to be materially different from any future results, performance or achievements expressed or implied by such forward-looking statements or information. Such statements can be identified by the use of words such as "may", "would", "could", "will", "intend", "expect", "believe", "plan", "anticipate", "estimate", "scheduled", "forecast", "predict" and other similar terminology, or state that certain actions, events or results "may", "could", "would", "might" or "will" be taken, occur or be achieved. These statements reflect the Ivanhoe Mine's current expectations regarding future events, performance and results and speak only as of the date of this news release.
As well, all of the results of the Kakula 2019 PFS, the Kamoa-Kakula 2019 PEA and the Kamoa 2019 PFS constitute forward-looking information or statements, including estimates of internal rates of return after-tax of 46.9% (Kakula) and 40.9% (Kamoa-Kakula) with payback periods of 2.6 years and 2.9 years respectively; net present value including a Kakula project NPV at an 8% discount rate of US$5.4 billion and a Kamoa-Kakula project NPV at an 8% discount rate of US$10.0 billion; future production forecasts and projects, including average annual production of 291,000 tonnes of copper and up to 360,000 tonnes of copper by year four at Kakula and average annual production of 386,000 tonnes of copper and 740,000 tonnes of copper by year 12 at Kamoa-Kakula; estimates of cash cost including mine site cash cost of US$0.46 per pound at total cash cost of US $1.11 per pound at Kakula, and total cash cost of US$0.93 per pound of copper during the first 10 years of production at Kamoa-Kakula; mine life estimates, including a 25 year mine life at Kakula and a 37 year mine life at Kamoa-Kakula; initial capital costs at Kakula and Kamoa-Kakula of US$1.1 billion; average copper grades over production of 6.4% at Kakula and 5.7% at Kamoa-Kakula during the first 10 years of operations; cash flow forecasts; estimates of copper recoveries of 85.3% at Kakula and 85.1% at Kamoa-Kakula.
Furthermore, with respect to this specific forward-looking information concerning the development scenarios for the Kamoa-Kakula Copper Project, Ivanhoe Mines has based its assumptions and analysis on certain factors that are inherently uncertain. Uncertainties include among others: (i) the adequacy of infrastructure (including the rehabilitation of the Koni and Mwadingusha, and accessibility and viability of rail links); (ii) unforeseen changes in geological characteristics; (iii) changes in the metallurgical characteristics of the mineralization; (iv) the ability to develop adequate processing capacity; (v) the price of copper; (vi) the availability of equipment and facilities necessary to complete development; (vii) the size of future processing plants and future mining rates; (viii) the cost of consumables and mining and processing equipment; (ix) unforeseen technological and engineering problems; (x) accidents or acts of sabotage or terrorism; (xi) currency fluctuations; (xii) changes in laws or regulations; (xiii) the availability and productivity of skilled labour; (xiv) the regulation of the mining industry by various governmental agencies; (xv) political factors, including political stability; (xvi) the availability of financing; and (xvii) the completion of the railway upgrade between Kolwezi and Dilolo.
This release also contains references to estimates of Mineral Resources and Mineral Reserves. The estimation of Mineral Resources and Mineral Reserves is inherently uncertain and involves subjective judgments about many relevant factors. Mineral Resources that are not Mineral Reserves do not have demonstrated economic viability. The accuracy of any such estimates is a function of the quantity and quality of available data, and of the assumptions made and judgments used in engineering and geological interpretation (including estimated future production from the Kamoa-Kakula Copper Project, the anticipated tonnages and grades that will be mined and the estimated level of recovery that will be realized), which may prove to be unreliable and depend, to a certain extent, upon the analysis of drilling results and statistical inferences that may ultimately prove to be inaccurate. Mineral Resource or Mineral Reserve estimates may have to be re-estimated based on: (i) fluctuations in copper price; (ii) results of drilling, (iii) the results of metallurgical testing and other studies, including their subsequent refinement and updating; (iv) proposed mining operations, including dilution; (v) the evaluation of mine plans subsequent to the date of any estimates; (vi) changes in mining or other costs, and (vii) the possible failure to receive required permits, approvals and licenses or changes to existing mining licences.
Forward-looking statements involve significant risks and uncertainties, should not be read as guarantees of future performance or results, and will not necessarily be accurate indicators of whether or not such results will be achieved. A number of factors could cause actual results to differ materially from the results discussed in the forward-looking statements, including, but not limited to, the factors discussed here, as well as unexpected changes in laws, rules or regulations, or their enforcement by applicable authorities; the failure of parties to contracts with Ivanhoe Mines and its subsidiaries to perform as agreed; social, political or labour unrest; changes in commodity prices (and copper in particular); limitations and availability of capital; and the failure of exploration programs or studies to deliver anticipated results (including the actual results of drilling and exploration activities), or results that would justify and support continued exploration, studies, development or operations.
Although the forward-looking statements contained in this release are based upon what management of Ivanhoe Mines believes are reasonable assumptions, Ivanhoe Mines cannot assure investors that actual results will be consistent with these forward-looking statements. These forward-looking statements are made as of the date of this release and are expressly qualified in their entirety by this cautionary statement. Subject to applicable securities laws, Ivanhoe Mines does not assume any obligation to update or revise the forward-looking statements contained herein to reflect events or circumstances occurring after the date of this release.
Appendices - 2019 Kamoa and Kakula Mineral Resource tables, and sensitivity of Mineral Resources to cut-off grade tables.
Table 13. Kamoa Indicated and Inferred Mineral Resource (at 1% TCu cut-off grade).
| Category | Tonnage (Mt) | Area (km2) | Copper (%) | Vertical Thickness (m) | Contained Copper (kt) | Contained Copper (billion lbs) |
| Indicated | 759 | 50.7 | 2.57 | 5.5 | 19,500 | 43.0 |
| Inferred | 202 | 19.4 | 1.85 | 3.8 | 3,740 | 8.2 |
- Ivanhoe's Mineral Resources Manager George Gilchrist, a Fellow of the Geology Society of South Africa and Professional Natural Scientist (Pr. Sci. Nat) with the South African Council for Natural Scientific Professions (SACNASP), estimated the Mineral Resources under the supervision of Dr. Harry Parker and Gordon Seibel, both Registered Members (RM) of the Society for Mining, Metallurgy and Exploration (SME), employees of Amec Foster Wheeler, who are the Qualified Persons for the Mineral Resource estimate. The effective date of the estimate is 27 November 2017 and the cut-off date for drill data is 23 November 2015. Mineral Resources are estimated using the CIM 2014 Definition Standards for Mineral Resources and Mineral Reserves. Mineral Resources are reported inclusive of Mineral Reserves on a 100% basis.
- Mineral Resources are reported using a total copper (TCu) cut-off grade of 1% TCu and a minimum vertical thickness of 3 m. There are reasonable prospects for eventual economic extraction under assumptions of a copper price of US$3.00/lb, employment of underground mechanized room-and-pillar and drift-and-fill mining methods, and that copper concentrates will be produced and sold to a smelter. Mining costs are assumed to be US$27/t. Concentrator, tailings treatment, and general and administrative costs (G&A) are assumed to be US$17/t. Metallurgical recoveries are expected to average 84% (86% for hypogene and 81% for supergene). At a 1% TCu cut-off grade, assumed net smelter returns for 100% of Mineral Resource blocks will cover processing, tailings treatment and G&A costs.
- Reported Mineral Resources contain no allowances for hangingwall or footwall contact boundary loss and dilution. No mining recovery has been applied.
- Depth of mineralization below the surface ranges from 10 m to 1,320 m for Indicated Mineral Resources and 20 m to 1,560 m for Inferred Mineral Resources.
- Approximate drill hole spacings are 800 m for Inferred Mineral Resources and 400 m for Indicated Mineral Resources.
- Rounding as required by reporting guidelines may result in apparent summation differences between tonnes, grade and contained metal content.
Table 14. Kakula Indicated and Inferred Mineral Resource (at 1% TCu cut-off grade).
| Category | Tonnage (Mt) | Area (km2) | Copper (%) | Vertical Thickness (m) | Contained Copper (kt) | Contained Copper (billion lbs) |
| Indicated | 628 | 21.5 | 2.72 | 10.5 | 17,100 | 37.6 |
| Inferred | 114 | 5.9 | 1.59 | 6.9 | 1,810 | 4.0 |
- Ivanhoe's Mineral Resources Manager George Gilchrist, a Fellow of the Geology Society of South Africa and Professional Natural Scientist (Pr. Sci. Nat) with the South African Council for Natural Scientific Professions (SACNASP), estimated the Mineral Resources under the supervision of Dr. Harry Parker and Gordon Seibel, both Registered Members (RM) of the Society for Mining, Metallurgy and Exploration (SME), employees of Amec Foster Wheeler, who are the Qualified Persons for the Mineral Resources. The Mineral Resource is a combination of Kakula and Kakula West models, with the West Scarp fault forming the boundary between the two. The effective date of the estimate for Kakula is 13 April 2018, and the cut-off date for the drill data is 26 January 2018. The effective date of the estimate for Kakula West is 10 November 2018, and the cut-off date for the drill data is 1 November 2018. Mineral Resources are estimated using the CIM Definition Standards for Mineral Resources and Reserves (2014) and reported on a 100% basis. Mineral Resources are reported inclusive of Mineral Reserves on a 100% basis.
- Mineral Resources are reported using a total copper (TCu) cut-off grade of 1% TCu and an approximate minimum thickness of 3 m. There are reasonable prospects for eventual economic extraction under assumptions of a copper price of US$3.00/lb, employment of underground, mechanized, room-and-pillar and drift-and-fill mining methods, and that copper concentrates will be produced and sold to a smelter. Mining costs are assumed to be US$42/t. Concentrator, tailings treatment and general and administrative (G&A) costs are assumed to be US$18/t. Metallurgical recovery is assumed to average 85%. Ivanhoe is studying reducing mining costs using a controlled convergence room-and-pillar method. At a 1% TCu cut-off grade, assumed net smelter returns for 100% of Mineral Resource blocks will cover concentrator, tailings treatment and G&A costs.
- Reported Mineral Resources contain no allowances for hangingwall or footwall contact boundary loss and dilution. No mining recovery has been applied.
- Approximate drill hole spacings are 800 m for Inferred Mineral Resources and 400 m for Indicated Mineral Resources.
- Rounding as required by reporting guidelines may result in apparent differences between tonnes, grade and contained metal content.
Table 15. Kamoa sensitivity of Mineral Resources to cut-off grade.
| Indicated Mineral Resource | ||||||
| Cut-off (% Cu) | Tonnage (Mt) | Area (km2) | Copper (%) | Vertical Thickness (m) | Contained Copper (kt) | Contained Copper (billion lbs) |
| 3.00 | 223 | 20.9 | 4.14 | 3.8 | 9,230 | 20.4 |
| 2.50 | 328 | 29.5 | 3.70 | 4.0 | 12,100 | 26.7 |
| 2.00 | 450 | 37.2 | 3.30 | 4.4 | 14,900 | 32.8 |
| 1.75 | 525 | 41.2 | 3.10 | 4.6 | 16,300 | 35.9 |
| 1.50 | 607 | 44.8 | 2.90 | 4.9 | 17,600 | 38.8 |
| 1.25 | 683 | 47.8 | 2.73 | 5.2 | 18,700 | 41.1 |
| 1.00 | 759 | 50.7 | 2.57 | 5.5 | 19,500 | 43.0 |
| 0.75 | 849 | 52.9 | 2.39 | 5.9 | 20,300 | 44.7 |
| Inferred Mineral Resource | ||||||
| 3.00 | 19 | 2.1 | 3.52 | 3.2 | 655 | 1.4 |
| 2.50 | 40 | 4.4 | 3.10 | 3.3 | 1,250 | 2.8 |
| 2.00 | 67 | 7.1 | 2.77 | 3.4 | 1,840 | 4.1 |
| 1.75 | 88 | 9.2 | 2.55 | 3.5 | 2,240 | 4.9 |
| 1.50 | 114 | 11.8 | 2.34 | 3.5 | 2,660 | 5.9 |
| 1.25 | 151 | 15.3 | 2.10 | 3.6 | 3,170 | 7.0 |
| 1.00 | 202 | 19.4 | 1.85 | 3.8 | 3,740 | 8.2 |
| 0.75 | 253 | 22.5 | 1.65 | 4.1 | 4,180 | 9.2 |
The footnotes to Table 13 also apply to this table.
Table 16. Kakula sensitivity of Mineral Resources to cut-off grade.
| Indicated Mineral Resource | ||||||
| Cut-off (% Cu) | Tonnage (Mt) | Area (km2) | Copper (%) | Vertical Thickness (m) | Contained Copper (kt) | Contained Copper (billion lbs) |
| 7.0 | 39 | 3.2 | 8.97 | 4.1 | 3,460 | 7.6 |
| 6.0 | 53 | 4.4 | 8.29 | 4.2 | 4,390 | 9.7 |
| 5.0 | 77 | 6.3 | 7.41 | 4.3 | 5,690 | 12.6 |
| 4.0 | 107 | 8.4 | 6.58 | 4.5 | 7,070 | 15.6 |
| 3.0 | 164 | 11.7 | 5.50 | 4.9 | 9,010 | 19.9 |
| 2.5 | 217 | 14.3 | 4.82 | 5.4 | 10,500 | 23.1 |
| 2.0 | 319 | 17.4 | 3.99 | 6.5 | 12,700 | 28.1 |
| 1.5 | 434 | 19.4 | 3.40 | 8.0 | 14,700 | 32.5 |
| 1.0 | 628 | 21.5 | 2.72 | 10.5 | 17,100 | 37.6 |
| Inferred Mineral Resource | ||||||
| 4.0 | 1 | 0.1 | 4.40 | 3.4 | 32 | 0.1 |
| 3.0 | 5 | 0.4 | 3.52 | 3.9 | 163 | 0.4 |
| 2.5 | 11 | 1.0 | 3.09 | 3.7 | 325 | 0.7 |
| 2.0 | 23 | 2.1 | 2.62 | 3.9 | 604 | 1.3 |
| 1.5 | 47 | 3.9 | 2.16 | 4.3 | 1,010 | 2.2 |
| 1.0 | 114 | 5.9 | 1.59 | 6.9 | 1,810 | 4.0 |
The footnotes to Table 14 also apply to this table.
Table 17. Kamoa and Kakula sensitivity of Mineral Resources to cut-off grade.
| Indicated Mineral Resource | ||||||
| Cut-off (% Cu) | Tonnage (Mt) | Area (km2) | Copper (%) | Vertical Thickness (m) | Contained Copper (kt) | Contained Copper (billion lbs) |
| 3.0 | 387 | 32.7 | 4.72 | 4.2 | 18,200 | 40.2 |
| 2.5 | 545 | 43.8 | 4.14 | 4.4 | 22,600 | 49.8 |
| 2.0 | 770 | 54.7 | 3.59 | 5.0 | 27,600 | 60.9 |
| 1.5 | 1,040 | 64.3 | 3.11 | 5.8 | 32,400 | 71.3 |
| 1.0 | 1,390 | 72.2 | 2.64 | 6.9 | 36,600 | 80.6 |
| Inferred Mineral Resource | ||||||
| 3.0 | 23 | 2.5 | 3.52 | 3.3 | 818 | 1.8 |
| 2.5 | 51 | 5.4 | 3.09 | 3.4 | 1,570 | 3.5 |
| 2.0 | 90 | 9.2 | 2.73 | 3.5 | 2,450 | 5.4 |
| 1.5 | 161 | 15.8 | 2.29 | 3.7 | 3,680 | 8.1 |
| 1.0 | 316 | 25.3 | 1.76 | 4.5 | 5,550 | 12.2 |
The footnotes to tables 13 and 14 also apply to this table.
To view the source version of this press release, please visit https://www.newsfilecorp.com/release/42671
Source: Ivanhoe Mines Ltd.