Ivanhoe Mines reports net profit of $122M and record $226M adjusted EBITDA in Q1 2025, up from $136M in Q4 2024
Kamoa-Kakula produced a near-record 133,120 tonnes of copper in Q1 2025, with annualized production rates increasing to approx. 614,000 tonnes since mid-March
Kamoa-Kakula set to achieve record month in April with approximately 50,000 tonnes of copper produced
Kamoa-Kakula achieves record $973M revenue, operating profit of $471M, and $585M EBITDA in Q1 2025
Kamoa-Kakula maintains competitive cost structure with $1.69/lb. cash cost (C1); near low end of annual guidance
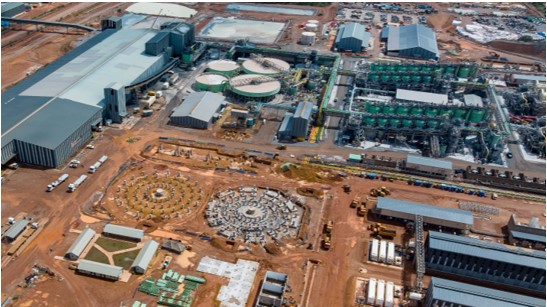
Commissioning of Africa's largest and greenest copper smelter nearing completion; start-up expected in May with first anodes from July
Western Forelands Mineral Resource update set for mid-May, 2025
Ivanhoe Mines notes the Declaration of Principles, jointly signed by the governments of the DRC and Rwanda, and witnessed by the US Secretary of State, to bring peace and prosperity to eastern DRC region
Johannesburg, South Africa--(Newsfile Corp. - April 30, 2025) - Ivanhoe Mines' (TSX: IVN) (OTCQX: IVPAF) President & Chief Executive Officer Marna Cloete and Chief Financial Officer David van Heerden are pleased to announce the company's financial results for the first quarter of 2025, as well as an operations and project development update.
Ivanhoe Mines is a leading Canadian mining company developing and operating its four principal mining and exploration projects in Southern Africa: expanding production at the tier-one Kamoa-Kakula Copper Complex in the Democratic Republic of the Congo (DRC); ramping up the ultra-high-grade Kipushi zinc-copper-lead-germanium mine in the DRC; building the tier-one Platreef platinum, palladium, rhodium, nickel, gold, and copper mine in South Africa; and advancing exploration for new copper discoveries across the expansive exploration licenses of Ivanhoe's Western Forelands Exploration Project, which hosts the Makoko, Kitoko, and Kiala copper discoveries near Kamoa-Kakula. All figures are in U.S. dollars unless otherwise stated.
Watch a video highlighting Ivanhoe Mines' first quarter financial results, as well as an operational update: https://vimeo.com/1079754785/ef469c412a?ts=0&share=copy

To view an enhanced version of this graphic, please visit:
https://images.newsfilecorp.com/files/3396/250287_ivanhoe_image.jpg
Founder and Co-Chairman Robert Friedland commented:
"Ivanhoe Mines is proud to report strong financial and operational performance in the first quarter of 2025, reflecting the significant efforts of our team and the broad shoulders of the world-class Kamoa-Kakula Copper Complex.
"As we announced earlier this month, the initiatives to overcome power challenges and secure sustainable short, medium, and long-term energy sources for the growth of the world's most important copper mine are beginning to bear fruit.
"Kamoa-Kakula is set for record production in the shorter month of April, achieving approximately 50,000 tonnes of copper in concentrate, equivalent to an annualized rate of over 600,000 tonnes - a remarkable achievement. This will provide the basis from which to continue our growth in 2026, including our optimization projects such as Project 95, even before the Phase 4 expansion.
"The start-up of Africa's largest and greenest direct-to-blister is just a few weeks away, which transforms Kamoa-Kakula into a fully integrated, low-cost, multi-generational supermajor copper complex. First production of 99+% pure copper anodes is expected in July. This milestone will lower transportation costs by more than 50% per unit of contained copper while enabling us to sell by-product sulphuric acid locally to meet rising demand in the Democratic Republic of the Congo's copper industry.
"Exploration continues to play a vital role in our future growth. On our Western Forelands licenses, we are making significant progress and will release an interim Mineral Resource update by mid-May. This update will highlight the immense potential of this highly prospective region adjacent to Kamoa-Kakula.
"We have also recently expanded our exploration efforts into Zambia - a country with tremendous geological prospectivity outside of the known Copperbelt region. The government of Zambia is also a critical partner in addressing long-term energy in the Southern African region.
"Finally, we praise the leadership of the governments of the United States and Qatar for bringing together the governments of the DRC and Rwanda to agree on principles of peace and prosperity, opening the way for increased investment and the responsible development of DRC's huge critical minerals endowment that will be required to meet the rising global demand for these essential metals."
FINANCIAL HIGHLIGHTS
- Ivanhoe Mines recorded a profit of $122 million during Q1 2025, equivalent to a basic profit of $0.10 per share, up from $88 million in Q4 2024. Profit included Ivanhoe Mines' share of profit and finance income from the Kamoa-Kakula joint venture of $142.0 million, up from $127.3 million in Q4 2024.
- Ivanhoe Mines' Q1 2025 adjusted EBITDA was a record $226 million, up from $136 million in Q4 2024, which includes an attributable share of EBITDA from Kamoa-Kakula of $231 million.
- Kamoa-Kakula recognized record revenue of $973 million, operating profit of $471 million, and EBITDA of $585 million for Q1 2025, equivalent to a margin of 60%.
- Kamoa-Kakula's first quarter record EBITDA of $585 million, compares with $431 million in Q4 2024 and benefits in part from a positive remeasurement of contract receivables of $51 million due to a rise in the copper price during the quarter.
- Kamoa-Kakula sold 109,963 tonnes of copper (net of payability) during the first quarter at an average realized copper price of $4.19/lb., compared with 112,881 tonnes in Q4 2024 at an average realized copper price of $4.08/lb. Sales continued to lag production due to a build-up of inventory for the commissioning of the smelter next month. At the end of the first quarter, there were approximately 48,000 tonnes of unsold copper in inventory, up from approximately 30,000 tonnes at the end of 2024.
- Kamoa-Kakula's cost of sales per pound (lb.) of payable copper sold was $1.87/lb. for the first quarter compared with $1.94/lb. in Q4 2024. Cash cost (C1) per pound of payable copper produced in the quarter averaged $1.69/lb., compared with $1.75/lb. in Q4 2024, a reduction was achieved despite an increase in energy costs resulting from backup generator usage.
- Kamoa-Kakula maintains its 2025 cash cost (C1) guidance of $1.65/lb. to $1.85/lb. of payable copper produced, with first quarter cash cost at the lower end of the range.
- Kamoa Copper signed offtake agreements with CITIC Metal (HK) Limited and Gold Mountains International Mining Company Limited, a subsidiary of Zijin Mining, for a combined 80% of the smelter's anode production. CITIC Metal and Gold Mountains also provided an advance payment facility of $250 million each, totaling $500 million, the full amount of which was received in January 2025.
- Since entering Phase 1 commercial production on July 1, 2021, the Kamoa-Kakula joint venture has generated over $6.1 billion of EBITDA and $5.2 billion of operating cash flow, excluding working capital movements, which has largely been re-invested in the now-complete Phase 2 and 3 expansions and the direct-to-blister copper smelter, as well as optimization initiatives.
- Kipushi sold 30,108 tonnes of zinc (net of standard 85% payability for zinc concentrate) during the quarter, which was up from the 16,999 tonnes of zinc sold in Q4 2024 and still affected by ramp-up, recognizing revenue of $77 million and quarterly segmented EBITDA of $11 million. Kipushi's cost of sales per pound (lb.) of payable zinc sold was $1.23/lb. and cash cost (C1) per pound of payable zinc sold totaled $0.93/lb.
- Ivanhoe Mines maintains Kipushi's 2025 cash cost (C1) guidance of $0.90/lb. to $1.00/lb. of payable zinc.
- On January 24, 2025, Ivanhoe Mines closed the inaugural offering of an aggregate principal amount of $750 million senior unsecured notes due 2030, bearing a coupon rate of 7⅞%. Ivanhoe also entered into a $120 million revolving credit facility agreement, which remains undrawn.
- Ivanhoe Mines' cash and cash equivalents on hand as at March 31, 2025, was $717 million.
OPERATIONAL HIGHLIGHTS
- Kamoa-Kakula produced a near-record 133,120 tonnes of copper during the first quarter. This compares with the quarterly record of 133,819 tonnes of copper produced in Q4 2024 and 86,117 tonnes of copper in Q1 2024
- Imported hydroelectric power increased by 20 megawatts (MW) to 70 MW in mid-March. Imported hydropower further increased to 100 MW after quarter end. Further increases in grid power are expected during the second half of 2025 as the smelter ramps up.
- Copper production rate on an annualized basis increased to an average of 614,000 tonnes of copper since March 18, 2025, with daily records reaching as high as 700,000 tonnes of copper annualized. Kamoa-Kakula is set to produce a monthly record of approximately 50,000 tonnes of copper in April, a 30-day month.
- Kamoa-Kakula's Phase 1, 2, and 3 concentrators achieved a combined milling record of approximately 3.7 million tonnes of ore during the first quarter, at an average record recovery rate of 87.4%. The outperformance was underpinned by the Phase 3 concentrator averaging throughput 20% above its design capacity, equivalent to an annualized milling rate of 6 million tonnes per annum.
- The Phase 1 and 2 concentrators milled 2.2 million tonnes of ore during Q1 2025 at an average grade of 5.01%, despite shutdowns for plant maintenance in March. The Phase 3 concentrator milled 1.5 million tonnes of ore at an average grade of 2.76%.
- Kamoa-Kakula's 2025 production guidance is maintained at 520,000 to 580,000 tonnes of copper in concentrate. Annualized copper production at Kamoa-Kakula is targeting approximately 600,000 tonnes of copper in concentrate from 2026, following the completion of power initiatives currently underway, as well as the optimization projects for improved Phase 1 and 2 recoveries ("Project 95") and increased Phase 3 throughput.
- Construction of Kamoa-Kakula's 500,000-tonne-per-annum on-site, direct-to-blister copper smelter, the largest in Africa, is now complete with the smelter undergoing commissioning. Start-up of the smelter is expected to commence in May, with first copper anode production expected in July. Offtake agreements with local buyers for the by-product, high-strength sulphuric acid are well advanced.
- The "Project 95" initiative on Kamoa-Kakula's Phase 1 and 2 concentrators is advancing on schedule for completion in Q1 2026. The increase in concentrator recoveries to 95% is expected to increase annualized copper production by up to 30,000 tonnes, with an industry-leading capital intensity of $6,000 per tonne of copper.
- Kamoa-Kakula's 2025 Integrated Development Plan, covering all the planned growth initiatives of the copper complex, is advancing well for completion in mid-2025.
- In Q1 2025, the Kipushi concentrator milled a record 151,403 tonnes of ore at a record average grade of 32.5% zinc, producing a record 42,736 tonnes of zinc in concentrate at a contained grade of over 53% zinc. The ramp-up to steady state of the ultra-high-grade Kipushi zinc mine is progressing well into the second quarter.
- The Kipushi debottlenecking program is 66% complete and advancing on schedule for completion late in the third quarter. The debottlenecking program is targeting a 20% increase in the Kipushi concentrator's processing capacity, up to 960,000 tonnes of ore per annum.
- Kipushi's 2025 production guidance is maintained at 180,000 to 240,000 tonnes of zinc in concentrate. Kipushi is targeting a production rate of over 250,000 tonnes of zinc in concentrate for 2026, following the completion of ramp-up and debottlenecking activities.
- On February 18, 2025, Ivanhoe Mines announced two independent studies on the Phase 2 and Phase 3 expansion of the Platreef platinum-palladium-rhodium-nickel-gold-copper mine, outlining plans for Platreef to become one of the world's largest and lowest-cost producers.
- Platreef's first production from the Phase 1 concentrator is expected in Q4 2025. The Phase 2 expansion is expected from Q4 2027, increasing production to over 450 koz of platinum, palladium, rhodium, and gold per annum, as well as significant nickel and copper by-products.
- Platreef's Phase 3 expansion is expected to produce over 1.0 million ounces of platinum, palladium, rhodium, and gold per annum, plus approx. 25,000 tonnes of nickel and 15,000 tonnes of copper.
- Equipping of Shaft #3 progressed well during the reporting period. Installation of the rock winder commenced, with the mechanical and electrical work advancing well. Shaft #3 is expected to be 'ready to hoist' from Q1 2026 with a capacity of approximately 4 million tonnes per annum.
- Underground development at Platreef's 850-metre level is imminently expected to reach the Flatreef orebody. Further development in ore will be stockpiled on surface and processed in the Phase 1 concentrator from Q4 2025.
- Ivanhoe continues exploration across its Western Forelands licences, adjacent to Kamoa-Kakula, with 5 rigs drilling during the wet season. A Mineral Resource update is expected to be released within the coming weeks that will include all drilling completed since the maiden resource in December 2023 up to the end of March 2025. Drilling from the remainder of the 2025 program will be included in a subsequent Mineral Resource update next year.
- Ivanhoe Mines notes the Declaration of Principles jointly signed on April 25, 2025, by the governments of the Democratic Republic of the Congo and the Republic of Rwanda, and witnessed by the government of the United States, to support a pathway to peace, stability, and integrated economic development in the eastern DRC, as well as the resumption of normal bilateral relations.
- On February 12, 2025, Ivanhoe Mines announced the forming of a joint venture with a UK private company to commence exploration activities for sediment-hosted copper discoveries in the Chu-Sarysu Basin, Central Kazakhstan. The Chu-Sarysu Basin is the world's third-largest known sedimentary copper basin. The licence package currently under application is over 18,000 km2 and is set to be the largest in the Chu-Sarysu Basin.
- On April 2, 2024, the Zambian government granted Ivanhoe Mines 7,757 km2 in new exploration licences in North-Western Province, which are over three times larger in area than Ivanhoe's Western Forelands Exploration Project. Exploration activities are expected to commence in this quarter after the wet season ends.

Construction of Africa's largest and greenest smelter project at Kamoa-Kakula is now complete. Commissioning of the smelter is nearing completion, with the first production of 99.7% copper anodes expected in July.
To view an enhanced version of this graphic, please visit:
https://images.newsfilecorp.com/files/3396/250287_eb599a3d14abaabe_004full.jpg
Conference call for investors on Thursday, May 1, 2025
Ivanhoe Mines will hold an investor conference call to discuss the results on Thursday, May 1, 2025 at 10:30 a.m. Eastern time / 7:30 a.m. Pacific time. The conference call will conclude with a question-and-answer (Q&A) session. Media are invited to attend on a listen-only basis.
To view the webcast, use the link:
https://meetings.400.lumiconnect.com/r/participant/live-meeting/400-384-567-484
Audience Phone Number:
Local - Toronto (+1) 289 514 5005
Toll Free - North America (+1) 800 206 4400
An audio webcast recording of the conference call, together with supporting presentation slides, will be available on Ivanhoe Mines' website at www.ivanhoemines.com.
After issuance, the condensed consolidated interim financial statements and Management's Discussion and Analysis will be available at www.ivanhoemines.com and www.sedarplus.ca.
Read Ivanhoe's 8th Annual Sustainability Report and First Quarter 2025 Sustainability Review:
https://www.ivanhoemines.com/investors/document-library/#sustainability
Ivanhoe's 2024 Annual Sustainability Review and Q1 2025 Quarterly Sustainability Review are both available in the sustainability section of our website. The reports provide a detailed review of each project's health and safety, environmental, and social activities, as well as more information on the various sustainability initiatives underway across the group.

To view an enhanced version of this graphic, please visit:
https://images.newsfilecorp.com/files/3396/250287_eb599a3d14abaabe_005full.jpg
During the first quarter of 2025, the group achieved a combined Lost Time Injury Frequency Rate (LTIFR) of 0.40 and a Total Recordable Injury Frequency Rate (TRIFR) of 1.19 per 1,000,000 hours worked. A breakdown of Ivanhoe's industry-leading health and safety performance can be found in the Q1 2025 Sustainability Review.

To view an enhanced version of this graphic, please visit:
https://images.newsfilecorp.com/files/3396/250287_eb599a3d14abaabe_006full.jpg

Team members inside the new smelter furnace complex at Africa’s largest and greenest copper smelter
To view an enhanced version of this graphic, please visit:
https://images.newsfilecorp.com/files/3396/250287_eb599a3d14abaabe_007full.jpg
Principal projects and review of activities
1. Kamoa-Kakula Copper Complex
39.6%-owned by Ivanhoe Mines
Democratic Republic of Congo
The Kamoa-Kakula Copper Complex is operated as the Kamoa Holding joint venture between Ivanhoe Mines and Zijin Mining. The project is approximately 25 kilometres southwest of the town of Kolwezi and about 270 kilometres west of Lubumbashi. Kamoa-Kakula's Phase 1 concentrator began producing copper in May 2021. The Phase 2 concentrator, completed in April 2022, doubled nameplate production capacity to 400,000 tonnes of copper per annum. A debottlenecking program, completed 10 months later in February 2023, further increased copper production capacity to 450,000 tonnes per annum. The Phase 3 concentrator completed in June 2024 expands annual production capacity up to approximately 600,000 tonnes of copper, ranking the Kamoa-Kakula Copper Complex as the world's third-largest copper mining operation by international mining consultant Wood Mackenzie.
Ivanhoe sold a 49.5% share interest in Kamoa Holding Limited (Kamoa Holding) to Zijin Mining and a 1% share interest in Kamoa Holding to privately owned Crystal River in December 2015. Kamoa Holding holds an 80% interest in the project and the DRC government holds the remaining 20% interest. Ivanhoe and Zijin Mining therefore each hold an indirect 39.6% interest in Kamoa-Kakula, with Crystal River holding an indirect 0.8% interest. Kamoa-Kakula's full-time employee workforce is approximately 6,500 and is over 90% Congolese.
Kamoa-Kakula summary of operating and financial data
| Q1 2025 | Q4 2024 | Q3 2024 | Q2 2024 | Q1 2024 | ||||||||||||
| Ore tonnes milled (000's tonnes) | 3,723 | 3,655 | 3,266 | 2,381 | 2,061 | |||||||||||
| Copper ore grade processed (%) | 4.10% | 4.26% | 4.14% | 4.91% | 4.80% | |||||||||||
| Copper recovery (%) | 87.4% | 86.6% | 85.3% | 86.7% | 87.4% | |||||||||||
| Copper in concentrate produced (tonnes) | 133,120 | 133,819 | 116,313 | 100,812 | 86,117 | |||||||||||
| Payable copper sold (tonnes)(1) | 109,963 | 112,811 | 103,106 | 95,900 | 85,155 | |||||||||||
| Cost of sales per pound ($ per lb.) | 1.87 | 1.94 | 1.80 | 1.53 | 1.50 | |||||||||||
| Cash cost (C1) ($ per lb.) | 1.69 | 1.75 | 1.69 | 1.52 | 1.57 | |||||||||||
| Realized copper price ($ per lb.) | 4.19 | 4.08 | 4.16 | 4.34 | 3.82 | |||||||||||
| Sales revenue before remeasurement | 922,411 | 895,758 | 836,871 | 813,817 | 612,496 | |||||||||||
| Remeasurement of contract receivables ($'000) | 50,986 | (52,428 | ) | (8,983 | ) | 3,256 | 5,824 | |||||||||
| Sales revenue after remeasurement ($'000) | 973,397 | 843,330 | 827,888 | 817,073 | 618,320 | |||||||||||
| EBITDA ($'000) | 585,160 | 431,802 | 469,735 | 547,257 | 364,893 | |||||||||||
| EBITDA margin (% of sales revenue) | 60% | 51% | 57% | 67% | 59% |
All figures in the above tables are on a 100%-project basis. Metal reported in concentrate is before refining losses or deductions associated with smelter terms. This news release includes "EBITDA", "Adjusted EBITDA", "EBITDA margin", and "Cash cost (C1)" which are non-GAAP financial performance measures. For a detailed description of each of the non-GAAP financial performance measures used herein and a detailed reconciliation to the most directly comparable measure under IFRS Accounting Standards, please refer to the non-GAAP Financial Performance Measures in the company's MD&A for the three months ended March 31, 2025.
(1) Payable copper sold is net of the payability factor of circa 97%. Copper in concentrate produced net of the payability factor is noted in the non-GAAP Financial Performance Measures section in the company's MD&A for the three months ended March 31, 2025.
C1 cash cost per pound of payable copper produced can be further broken down as follows:
| Q1 2025 | Q4 2024 | Q3 2024 | Q2 2024 | Q1 2024 | ||||||||||||||||
| Mining | ($ per lb.) | 0.63 | 0.61 | 0.62 | 0.45 | 0.44 | ||||||||||||||
| Processing | ($ per lb.) | 0.29 | 0.30 | 0.26 | 0.21 | 0.23 | ||||||||||||||
| Logistics charges | ($ per lb.) | 0.41 | 0.40 | 0.42 | 0.48 | 0.50 | ||||||||||||||
| TC, RC, smelter charges | ($ per lb.) | 0.19 | 0.27 | 0.26 | 0.25 | 0.25 | ||||||||||||||
| General & Administrative | ($ per lb.) | 0.17 | 0.17 | 0.13 | 0.13 | 0.15 | ||||||||||||||
| Cash cost (C1) per pound of payable copper produced | ($ per lb.) | 1.69 | 1.75 | 1.69 | 1.52 | 1.57 |
The cost of power, which is allocated between mining and processing in the above cash cost split, can be split out as follows:
| Q1 2025 | Q4 2024 | Q3 2024 | Q2 2024 | Q1 2024 | ||||||||||||||||
| Power costs included in Mining and Processing cost | ($ per lb.) | 0.24 | 0.22 | 0.19 | 0.12 | 0.14 | ||||||||||||||
| Power costs as a proportion of cash cost (C1) per pound of payable copper produced | (%) | 14.2% | 12.6% | 11.2% | 7.9% | 8.9% |
Cash cost (C1) is prepared on a basis consistent with the industry standard definitions by Wood Mackenzie cost guidelines but are not measures recognized under IFRS Accounting Standards. In calculating the C1 cash cost, the costs are measured on the same basis as the company's share of profit from the Kamoa Holding joint venture that is contained in the financial statements. C1 cash cost is used by management to evaluate operating performance and include all direct mining, processing, and general and administrative costs. Smelter charges and freight deductions on sales to the final port of destination, which are recognized as a component of sales revenues, are added to C1 cash cost to arrive at an approximate cost of delivered, finished metal. C1 cash cost excludes royalties, production taxes, and non-routine charges as they are not direct production costs.
All figures are on a 100% project basis and metal reported in concentrate is before refining losses or deductions associated with smelter terms.
Kamoa-Kakula produced near-record 133,120 tonnes of copper during Q1 2025, rising to an annualized production rate of approximately 614,000 tonnes of copper in the six weeks since mid-March
During the first quarter of 2025, the Phase 1, 2, and 3 concentrators milled a record 3.72 million tonnes of ore and achieved a daily milling record of 51,528 tonnes of ore in late March. The outperformance was underpinned by initiatives implemented earlier in the quarter that enabled the Phase 3 concentrator to be consistently fed at higher rates than originally designed. Phase 3 milled a record 1.51 million tonnes of ore during the quarter. The record is equivalent to an annualized milling rate of 6.1 million tonnes per annum, which is more than 20% higher than the Phase 3 concentrator's design capacity of 5.0 million tonnes per annum.
During March, Kamoa-Kakula's Phase 1, 2, and 3 concentrators produced an average of 1,509 tonnes of copper per day, which is equivalent to an annualized production rate of 550,000 tonnes per annum (the mid-point of 2025 production guidance). The Phase 1 and 2 concentrators also outperformed during the quarter, despite shutdowns for maintenance in the first half of March.
In the six weeks since mid-March, total copper production has notably risen to an average of 1,683 tonnes per day or 11,804 tonnes per week, as shown in Figure 1. The outperformance is equivalent to an annualized production rate of approximately 614,000 tonnes per annum, approximately 12% higher than the midpoint of 2025 guidance. This includes an outstanding daily production record was also achieved of 1,919 tonnes of copper on March 28, 2025. Production for the month of April, excluding the last day of the month, totaled approximately 48,400 tonnes of copper in concentrate.

Figure 1. Kamoa-Kakula weekly copper in concentrate production (kt)
Note: date on the X axis denoted the week beginning
(1) Production for the week beginning April 28, 2025 is estimated by extrapolating actual production from first two days of the week.
To view an enhanced version of this graphic, please visit:
https://images.newsfilecorp.com/files/3396/250287_ivanhoefigure1.jpg
Kamoa-Kakula summary of quarterly production data:
| Q1 2024 | Q2 2024 | Q3 2024 | Q4 2024 | Q1 2025 | |
| Phase 1 & 2 | |||||
| Ore tonnes milled (000's tonnes) | 2,061 | 2,288 | 2,215 | 2,329 | 2,211 |
| Copper ore grade processed (%) | 4.80% | 5.04% | 4.86% | 5.08% | 5.01% |
| Copper recovery (%) | 87.4% | 87.0% | 86.6% | 87.0% | 88.3% |
| Copper in concentrate produced (tonnes) | 86,117 | 99,706 | 94,214 | 102,042 | 97,575 |
| Phase 3 | |||||
| Ore tonnes milled (000's tonnes) | - | 93 | 1,050 | 1,326 | 1,512 |
| Copper ore grade processed (%) | - | 1.67% | 2.64% | 2.82% | 2.76% |
| Copper recovery (%) | - | 83.3% | 79.9% | 85.1% | 85.1% |
| Copper in concentrate produced (tonnes) | - | 1,106 | 22,099 | 31,777 | 35,545 |
| Combined Phase 1, 2 and 3 | |||||
| Ore tonnes milled (000's tonnes) | 2,061 | 2,381 | 3,266 | 3,655 | 3,723 |
| Copper ore grade processed (%) | 4.80% | 4.91% | 4.14% | 4.26% | 4.10% |
| Copper recovery (%) | 87.4% | 86.7% | 85.3% | 86.6% | 87.4% |
| Copper in concentrate produced (tonnes) | 86,117 | 100,812 | 116,313 | 133,819 | 133,120 |
| Data in bold denotes a quarterly record. | |||||
Annual production guidance at Kamoa-Kakula is maintained at between 520,000 to 580,000 tonnes of copper.
Kamoa-Kakula's high- and medium-grade ore surface stockpiles totaled approximately 3.97 million tonnes at an estimated, blended average grade of 3.25% copper. Contained copper in the stockpiles at the end of March totaled approximately 128,772 tonnes.
At quarter end, Kamoa-Kakula held approximately 48,000 tonnes of unsold copper in concentrate, up from approximately 30,000 tonnes at the end of 2024. Of the 48,000 tonnes of unsold copper in concentrate, approximately 22,000 tonnes were stockpiled during the quarter at Kamoa-Kakula's on-site copper smelter. Kamoa-Kakula expects to hold at the smelter up to 30,000 tonnes of copper in stockpiles at the end of the second quarter as a buffer during ramp-up. Total unsold copper at the smelter, held in stockpiles and the smelting circuit, is expected to reduce to approximately 17,000 tonnes as the smelter reaches full ramp-up.
Approximately 22,000 tonnes of the remaining unsold copper at the end of the first quarter were stored at the nearby Lualaba Copper Smelter (LCS) awaiting toll treatment. The stored copper in concentrate at LCS is only expected to be treated from the second half of 2025.
Phase 3 concentrator feed grades set to improve in H2 2025, as development at Kamoa 1 and 2 underground mines is completed
The majority of the ore processed by the Phase 3 concentrator continues to be sourced from underground development. The crews at the Kamoa and Kansoko underground mines are focused on underground development, opening up approximately 18 months of ore reserves before the commencement of primary mining. Opening up a large accessible underground reserve base provides operational flexibility for the underground mining crews, similar to that which has already been achieved at the Kakula Mine.
The flat-lying nature of the Kamoa and Kakula orebodies means that underground development can be carried out in ore, albeit at lower grades. Underground development of the Kamoa mines is expected to continue until Q4 2025, after which Phase 3 concentrator feed grades are expected to increase to approximately 3% copper.
Significant increase in imported power since mid-March from 50 MW to 70 MW, further increasing to 100 MW in April
Kamoa-Kakula reached a major turning point during the quarter, following a significant increase in imported hydroelectric power that provided Kamoa-Kakula's management team with the confidence to finalize commissioning and commence the start-up of the smelter. The start-up of the new on-site copper smelter is expected in the coming weeks.
During the first quarter, the total average power required for the Phase 1, 2, and 3 operations was between 130 MW and 140 MW. At the beginning of March, Kamoa-Kakula was drawing 50 MW of domestically generated hydroelectric power, with 50 MW of hydroelectric power drawn from imported sources. The balance of required power was provided by on-site, diesel-generated backup power, of which there is an installed capacity of approximately 160 MW. Power drawn by the smelter is expected to gradually increase from 45 MW, following first feed of concentrate, up to 70 MW once at full capacity.
During the first quarter, an agreement was signed to increase the total imported hydroelectric power via the Zambia-DRC interconnector. From mid-March, imported hydroelectric power increased by 20 MW to 70 MW and increased further to 100 MW in April. Further increases in grid power are expected throughout 2025 as the on-site smelter ramps up. The additional power is largely sourced from Mozambique via a wheeling agreement through the Southern Africa Power Pool network.

Rebecca Tshidibi, Analyst Trainee, at work at the Kakula North laboratory.
To view an enhanced version of this graphic, please visit:
https://images.newsfilecorp.com/files/3396/250287_eb599a3d14abaabe_012full.jpg
Power purchase agreements signed to build 60 megawatts of on-site solar (PV) capacity with battery storage at Kamoa-Kakula
In the past month, Kamoa Copper has signed two power purchase agreements (PPA) with CrossBoundary Energy of Nairobi, Kenya, and Green World Energie SARL of Beijing, China to provide up to 60 MW in baseload clean energy to Kamoa-Kakula's operations from an onsite solar facility. The facilities, which will be owned, operated, and funded by CrossBoundary Energy and Green World Energie will total 406 MWp of Solar Photovoltaic (PV) capacity with up to 1,107 MWh in battery energy storage (BESS). Kamoa Copper will be the sole off taker of the electricity produced by both facilities.
Construction of the two 30 MW facilities is expected to start in the third quarter with phased commissioning expected from the second quarter of 2026. Kamoa-Kakula plans to further expand the on-site solar facilities over time, targeting a capacity of up to 120 MW, replacing the need for on-site, backup diesel-generated power.
Wet commissioning of Turbine #5 at Inga II expected in H2 2025
Wet commissioning of Turbine #5 at Inga II, with a hydroelectric generation capacity of 178 MW is now expected to commence in the second half of 2025. Kamoa-Kakula is expected to be allocated an initial, additional 71 MW of hydroelectric power once commissioning is complete, increasing up to 178 MW as the ongoing grid improvement initiatives are completed in 2026.
Kamoa Copper continues to work closely with the DRC's state-owned power company, La Société Nationale d'Electricité (SNEL), to deliver solutions for the identified causes of instability experienced across the southern DRC's grid infrastructure since late 2022. The project work is budgeted up to $200 million and funded by Kamoa Holding. The funding is assigned to increasing transmission capacity and improving the reliability of the grid.

Upgrade work at the Kolwezi Converter Station is advancing well for completion in Q1 2026. A new static compensator is being installed to enhance regional transmission quality and stability.
To view an enhanced version of this graphic, please visit:
https://images.newsfilecorp.com/files/3396/250287_ivanhoe.jpg
The project work consists of grid infrastructure upgrades, such as an increase in grid capacity between the Inga II hydroelectric facility and Kolwezi, a new harmonic filter at the Inga Converter Station, as well as a new static compensator at the Kolwezi Converter Station. In addition, various smaller initiatives have been identified to strengthen the transmission capability and improve the long-term stability of the southern grid. This includes the restringing of powerlines in the southern grid and repairs to the direct current (DC) infrastructure. In addition to this, Ivanhoe Mines Energy DRC is working with SNEL to put in place maintenance contracts to maintain key generation capacity and transmission infrastructure.

Kamoa 1 backfill plant in the foreground, with the Phase 3 concentrator in the background.
To view an enhanced version of this graphic, please visit:
https://images.newsfilecorp.com/files/3396/250287_eb599a3d14abaabe_014full.jpg
Commissioning of the smelter is nearing completion, with startup expected in May and the first production of copper anode in July
Commissioning of Kamoa-Kakula's 500,000-tonne-per-annum, direct-to-blister copper smelter is nearing completion, with start-up expected to commence in May. The staff count has increased notably ahead of operations, currently at approximately 1,500 personnel. The initial heat-up process of the smelter is expected to take up to six weeks, after which the first feed of concentrate will begin. Initial production of copper anode is expected in July. Ramp up of the smelter is expected to be at approximately 90% by year-end.

Off-gases from Kamoa-Kakula's on-site copper smelter are captured from the furnace building and recycled. Up to 700,000 tonnes of high-strength sulphuric acid will be collected and sold as a by-product domestically, while the recovered heat will generate up to 8 MW of electrical power.
To view an enhanced version of this graphic, please visit:
https://images.newsfilecorp.com/files/3396/250287_eb599a3d14abaabe_015full.jpg

Commissioning of Kamoa-Kakula's two anode furnaces inside the smelter complex is advancing well. Each anode furnace weighs approximately 220 tonnes.
To view an enhanced version of this graphic, please visit:
https://images.newsfilecorp.com/files/3396/250287_eb599a3d14abaabe_016full.jpg
Kamoa-Kakula's Project 95 is approximately 30% complete and advancing on schedule for completion in Q1 2026
The "Project 95" initiative on Kamoa-Kakula's Phase 1 and 2 concentrators is expected to increase concentrator recoveries to 95%, from the design recovery rate of 87%. The initiative, with a capital expenditure of approximately $180 million, is expected to increase annualized production by up to 30,000 tonnes of copper, at an industry-leading capital intensity of $6,000 per tonne of copper.
Following the completion of Project 95, the copper grade of the tailings generated by the Phase 1 and 2 concentrators is expected to be significantly reduced from approximately 0.7% to 0.2% copper. To avoid mixing the higher-grade tailings currently in Cell 1 of the tailings storage facility with the lower-grade tailings post the completion of Project 95, a separate cell within the tailings storage facility will be constructed. The construction of Cell 2, originally intended for the future Phase 4 expansion, has been brought forward. The construction of Cell 2 is expected to cost approximately $82 million and is under construction in parallel with the Project 95 concentrator modifications. The reprocessing of the high-grade tailings, produced by the Phase 1 and 2 concentrators before the completion of Project 95, will take place during the future Phase 4 expansion.
Civil works of Project 95 are advancing well, as shown in the foreground, with the adjacent Phase 1 and 2 concentrators in the background.
To view an enhanced version of this graphic, please visit:
https://images.newsfilecorp.com/files/3396/250287_ivanhoe_image2.jpg
Kamoa-Kakula signs offtake agreement and advanced payment facility for copper anodes produced by the on-site smelter
CITIC Metal (HK) Limited and Gold Mountains International Mining Company Limited, a subsidiary of Zijin Mining, have each signed an offtake agreement with Kamoa Copper for a combined 80% of the smelter’s anode production. The agreements were entered into on competitive arm’s-length commercial terms, over a three-year term. Production from the smelter once fully ramped up, is projected to be up to 500,000 tonnes of 99.7%-pure copper anodes per annum. The offtake agreements contain standard, international commercial terms, including refining charges based on the copper industry's annual benchmark.
CITIC Metal and Gold Mountains will purchase the copper anodes on a free-carrier (FCA) basis from Kamoa-Kakula's mine gate. CITIC has elected to use Ivanhoe's trading subsidiary to arrange the inland transportation of copper anodes to the port of loading in Africa.
In addition, under the offtake agreements, CITIC Metal and Gold Mountains have provided an advance payment facility of $250 million each, totaling $500 million, the full amount of which was received in January 2025. The advance payment facility will bear an annual interest rate of the 1-month Secured Overnight Financing Rate (SOFR), plus 3.75%.
After quarter-end, Kamoa Copper signed a third offtake agreement with global commodities trading group Trafigura Pte Ltd., of the Republic of Singapore, for the remaining 20% of smelter production on the same terms.
Kamoa-Kakula 2025 Integrated Development Plan, including future growth initiatives such as Project 95, Phase 3 debottlenecking, and Phase 4 expansion, expected mid-year
Following the last Integrated Development Plan, released on January 30, 2023, Kamoa's engineering team is working on an updated 2025 Integrated Development Plan (2025 IDP) which is expected to be complete in mid-2025. The 2025 IDP will include initiatives targeting increased processing recoveries and processing throughput from the Phase 1, 2, and 3 concentrators, as well as a new Phase 4 expansion.
Kamoa's engineering team is targeting to increase recovery rates of the Phase 1 and 2 concentrators and the Phase 3 concentrator, from the current nameplate rates of 87% and 86%, up to 95% and 92%, respectively, including Project 95. In addition, the processing capacity of the existing Phase 1, 2, and 3 operations is targeted to be boosted by up to 20%, from 14.2 Mtpa to 17 Mtpa.
The Phase 4 expansion involves doubling the size of the milling and flotation circuit adjacent to Phase 3. Like the Phase 2 expansion with Phase 1, the front-end crushing circuit installed for Phase 3 has already been oversized to accommodate Phase 4.
Phase 4 will be fed by ramping up new mining areas on the Kamoa-Kakula Copper Complex, the timing of which is under study for the 2025 IDP.
COPPER PRODUCTION AND CASH COST GUIDANCE FOR 2025
| Kamoa-Kakula 2025 Guidance | |
| Contained copper in concentrate (tonnes) | 520,000 - 580,000 |
| Cash cost (C1) ($ per pound of payable copper produced) | 1.65 to 1.85 |
Guidance figures are on a 100% project basis and metal reported in concentrate is before refining losses or deductions associated with smelter terms. Kamoa-Kakula's 2025 guidance is based on several assumptions and estimates and involves estimates of known and unknown risks, uncertainties, and other factors that may cause the actual results to differ materially.
Kamoa-Kakula is targeting a production rate of approximately 600,000 tonnes of copper in concentrate for 2026, following power initiatives in progress, together with optimization projects for improved Phase 1 and 2 recoveries, being Project 95, and increased Phase 3 throughput underway.
The Kamoa-Kakula Copper Complex produced a total of 133,120 tonnes of copper in concentrate for the first quarter of 2025.
Cash cost (C1) per pound of payable copper produced amounted to $1.69/lb. for the three months ended March 31, 2025. Cash cost (C1) guidance is based on assumptions including feed grades of processed copper ore, reliability of DRC grid power supply, the availability and cost of alternative sources of electricity supply, and prevailing logistics rates among other variables.
Cash cost (C1) is a non-GAAP measure used by management to evaluate operating performance and includes all direct mining, processing, stockpile rehandling charges, and general and administrative costs. Smelter charges and freight deductions on sales to the final port of destination (typically China), which are recognized as a component of sales revenues, are added to cash cost (C1) to arrive at an approximate cost of delivered finished metal.
For historical comparatives and a reconciliation to the most directly comparable measure under IFRS, see the non-GAAP Financial Performance Measures section of this release and the company's MD&A for the three months ended March 31, 2025.
2. Kipushi Mine
68%-owned by Ivanhoe Mines
Democratic Republic of Congo
The ultra-high grade Kipushi underground zinc-copper-germanium-silver-lead mine in the DRC is located adjacent to the town of Kipushi, approximately 30 kilometres southwest of Lubumbashi on the Central African Copperbelt. Kipushi is approximately 250 kilometres southeast of the Kamoa-Kakula Copper Complex and less than one kilometre from the Zambian border. Ivanhoe acquired a 68% interest in the Kipushi Mine in November 2011, through Kipushi Holding which is 100%-owned by Ivanhoe Mines. The balance of 32% in the Kipushi Mine was held by the DRC state-owned mining company, Gécamines. As per the updated joint venture agreement signed in late 2023, Gécamines' ownership increased to 38% during Q1 2025 upon completion of the outstanding conditions precedent.
Ivanhoe, together with its joint-venture partner, restarted the Kipushi zinc mine in mid-2024, with the ramp-up to steady state operations continuing during the quarter. On November 17, 2024, His Excellency Félix Tshisekedi, President of the Democratic Republic of the Congo, along with a government delegation, officially reopened the Kipushi zinc mine.
Kipushi summary of operating and financial data
| Q1 2025 | Q4 2024 | Q3 2024 | |||||||||
| Ore tonnes milled (000's tonnes) | 151 | 135 | 93 | ||||||||
| Zinc ore grade processed (%) | 32.16% | 29.00% | 28.89% | ||||||||
| Zinc recovery (%) | 87.93% | 84.85% | 62.40% | ||||||||
| Zinc in concentrate produced (tonnes) | 42,736 | 32,323 | 17,984 | ||||||||
| Payable zinc sold (tonnes) | 30,108 | 16,999 | - | ||||||||
| Cost of sales per pound ($ per lb.) | 1.23 | 1.38 | - | ||||||||
| Cash cost (C1) ($ per lb.) | 0.93 | 1.13 | - | ||||||||
| Realized zinc price ($ per lb.) | 1.29 | 1.38 | - | ||||||||
| Sales revenue before remeasurement ($'000) | 79,713 | 41,600 | - | ||||||||
| Remeasurement of contract receivables ($'000) | (2,693) | (2,693) | - | ||||||||
| Sales revenue after remeasurement ($'000) | 77,020 | 38,907 | - | ||||||||
| EBITDA ($'000) | 10,508 | 4,050 | - | ||||||||
| EBITDA margin (% of sales revenue) | 14% | 10% | - |
C1 cash cost per pound of payable zinc can be further broken down as follows:
| Q1 2025 | Q4 2024 | ||||||||
| Mining | ($ per lb.) | 0.16 | 0.26 | ||||||
| Processing | ($ per lb.) | 0.12 | 0.12 | ||||||
| Logistics charges | ($ per lb.) | 0.47 | 0.48 | ||||||
| Treatment charges | ($ per lb.) | 0.05 | 0.17 | ||||||
| G&A | ($ per lb.) | 0.13 | 0.10 | ||||||
| Cash cost (C1) per pound of payable zinc sold | ($ per lb.) | 0.93 | 1.13 |
Cash cost (C1) is prepared on a basis consistent with the industry standard definitions by Wood Mackenzie cost guidelines but cash cost per pound for the Kipushi Mine has been presented on a per ton sold basis to eliminate the impact of unsold tonnes of zinc concentrate in inventory. Cash cost (C1) and cash cost per pound are not measures recognized under IFRS Accounting Standards. C1 cash cost is used by management to evaluate operating performance and include all direct mining, processing, and general and administrative costs. Smelter charges and freight deductions on sales to the final port of destination, which are recognized as a component of sales revenues, are added to C1 cash cost to arrive at an approximate cost of delivered, finished metal. C1 cash cost excludes royalties, production taxes, and non-routine charges as they are not direct production costs.
All figures are on a 100% project basis and metal reported in concentrate is before refining losses or deductions associated with smelter terms.

Aerial view of the Kipushi concentrator in the foreground, with Shaft P5 in the background. Kipushi produced a record 42,736 tonnes of zinc in Q1 2025; ramp-up of the concentrator to steady state continues into Q2.
To view an enhanced version of this graphic, please visit:
https://images.newsfilecorp.com/files/3396/250287_eb599a3d14abaabe_018full.jpg
Kipushi produced a record 42,736 tonnes of zinc during Q1; production ramp-up continues into the second quarter
Kipushi's concentrator milled approximately 151,403 tonnes of ore during the first quarter of 2025 at an average feed grade of 32.5% zinc. Quarterly zinc production from the concentrator was 42,736 tonnes, at an average flotation recovery rate of 87.9%.
During the first quarter of 2025, the Kipushi concentrator was able to operate at and periodically beyond, its nameplate mill feed rate of 80 tonnes per hour, with rates of up to 100 tonnes per hour achieved. In addition, towards quarter end concentrate production was also periodically achieving its nameplate of 1,400 tonnes of concentrate per day.
The Kipushi concentrator's metallurgical recoveries continued to improve during the quarter, approaching an average of just under 90%. Work is ongoing to achieve the design recovery rate of approximately 95% later in the year.
Surface and underground operations continued to be impacted by power instability during the first quarter of 2025. Grid instability reduced shaft hoisting capacity and impacted pumping capacity, reducing mining operations and development metres achieved.
At the end of the first quarter, Kipushi's high-and medium-grade ore surface stockpiles, adjacent to the Kipushi concentrator, totaled approximately 307,000 tonnes at an estimated average grade of 23% zinc. Contained zinc in the stockpiles totaled approximately 70,000 tonnes.
The cemented aggregate fill (CAF) plant, as well as the associated surface and underground infrastructure, was commissioned during the quarter. The first backfilled stope is currently underway on the 1,290-metre level. Approximately 50% of the tailings generated by the Kipushi concentrator are mixed with cement in the CAF plant and pumped back underground as backfill.
Kipushi debottlenecking project 70% complete and advancing on schedule; new project under investigation to recover by-product pyrite
The debottlenecking project is targeting a 20% increase in concentrator processing capacity to 960,000 tonnes of ore per annum. The project is approximately 70% complete and is expected to be complete by the end of the third quarter of 2025. The additional electrical infrastructure upgrades, as well as engineering, and procurement are nearing completion, with construction expected to commence imminently. Sufficient capacity exists to increase mining and hoisting rates to sustainably support the increased concentrator throughput once complete.
Kipushi is evaluating the introduction of a separate pyrite concentrate stream from the current flotation circuit, which could be sold domestically. Pyrite can be used in copper smelting as a supplement to improve operational efficiency, adding additional heat during copper concentrate combustion. Kipushi has the potential to produce between 5,000 and 10,000 tonnes per month of high-grade pyrite concentrate using conventional flotation, thickening, and filtration.
ZINC PRODUCTION AND CASH COST GUIDANCE FOR 2025
| Kipushi 2025 Guidance | |||
| Contained zinc in concentrate (tonnes) | 180,000 - 240,000 | ||
| Cash cost (C1) ($ per pound of payable zinc produced) | 0.90 to 1.00 |
Guidance figures are on a 100% project basis and metal reported in concentrate is before treatment losses or payability deductions associated with smelter terms.
Kipushi's 2025 production guidance is based on several assumptions and estimates of known and unknown risks, uncertainties, and other factors that may cause the actual results to differ materially.
Kipushi is targeting a production rate of over 250,000 tonnes of zinc in concentrate for 2026, following the completion of ramp-up and debottlenecking activities, targeted for the third quarter of 2025.
The Kipushi Mine produced a total of 42,736 tonnes of zinc in concentrate for the first quarter of 2025. Cash cost (C1) per pound of payable zinc sold amounted to 0.93/lb. for the three months ended March 31, 2025.
Cash cost guidance is based on assumptions including the ramp-up of the concentrator to steady state production, reliability of DRC grid power supply, the timing and successful completion of the debottlenecking program, and prevailing logistics rates among other variables.
Cash cost (C1) is a non-GAAP measure used by management to evaluate operating performance and includes all direct mining, processing, stockpile rehandling charges, and general and administrative costs. Smelter charges and freight deductions on sales to the final port of destination, which are recognized as a component of sales revenues, are added to cash cost (C1) to arrive at an approximate cost of delivered finished metal.
For historical comparatives and a reconciliation to the most directly comparable measure under IFRS see the non-GAAP Financial Performance Measures section of this release and the company's MD&A for the three months ended March 31, 2025.

Crusher Operators, Bonice Kalassa (L) and Patrick Ilunga (R) at the Kipushi crusher plant.
To view an enhanced version of this graphic, please visit:
https://images.newsfilecorp.com/files/3396/250287_eb599a3d14abaabe_019full.jpg

Aerial view of the Kipushi concentrator, which milled approximately 151,403 tonnes of ore during the first quarter of 2025 at an average feed grade of 32.53% zinc.
To view an enhanced version of this graphic, please visit:
https://images.newsfilecorp.com/files/3396/250287_eb599a3d14abaabe_020full.jpg
3. Platreef Project
64%-owned by Ivanhoe Mines
South Africa
The Platreef Project is owned by Ivanplats (Pty) Ltd. (Ivanplats), which is 64%-owned by Ivanhoe Mines. A 26% interest is held by Ivanplats' historically disadvantaged, broad-based, black economic empowerment (B-BBEE) partners, which include 20 local host communities with approximately 150,000 people, project employees, and local entrepreneurs. A Japanese consortium of ITOCHU Corporation, Japan Oil, Gas and Metals National Corporation (JOGMEC), and Japan Gas Corporation, owns a 10% interest in Ivanplats, which it acquired in two tranches for a total of $290 million.
The Platreef Project hosts an underground deposit of thick, platinum-group metals, nickel, copper, and gold mineralization on the Northern Limb of the Bushveld Igneous Complex in Limpopo Province - approximately 280 kilometres northeast of Johannesburg and eight kilometres from the town of Mokopane in South Africa.
On the Northern Limb, platinum-group metals mineralization is primarily hosted within the Platreef, a mineralized sequence traced for more than 30 kilometres along strike. Ivanhoe's Platreef Project, within the Platreef's southern sector, is comprised of two contiguous properties: Turfspruit and Macalacaskop. Turfspruit, the northernmost property, is contiguous with, and along strike from, Anglo Platinum's Mogalakwena group of mining operations and properties.
Since 2007, Ivanhoe has focused its exploration and development activities on defining and advancing the down-dip extension of its original discovery at Platreef, now known as the Flatreef Deposit, which is amenable to highly mechanized, underground mining methods.

Platreef's completed Phase 1 concentrator in the foreground. Development ore is planned to be fed into the concentrator from Q4 2025.
To view an enhanced version of this graphic, please visit:
https://images.newsfilecorp.com/files/3396/250287_eb599a3d14abaabe_021full.jpg

Telehandler operator Thapelo Mokoka underground on Platreef's 950-metre level.
To view an enhanced version of this graphic, please visit:
https://images.newsfilecorp.com/files/3396/250287_eb599a3d14abaabe_022full.jpg
Ivanhoe Mines unveils Independent Phase 2 and Phase 3 Expansion Studies for the Platreef Mine - a world-class, lowest-cost precious metals and critical minerals producer
On February 18, 2025, Ivanhoe Mines announced that the company's subsidiary, Ivanplats, and its partners, welcomed the positive and significant results from two independent technical studies completed on the Phase 2 and Phase 3 expansions of the tier-one Platreef platinum, palladium, rhodium, nickel, gold, and copper mine in South Africa.
The two completed independent studies cover the three-phase development of the Platreef mine, as shown in Figure 2. This includes an updated Feasibility Study on the Phase 2 expansion to 4.1 Mtpa of processing capacity (4.1 Mtpa FS), followed by a Preliminary Economic Assessment covering a new Phase 3 expansion to 10.7 Mtpa of processing capacity (10.7 Mtpa PEA).
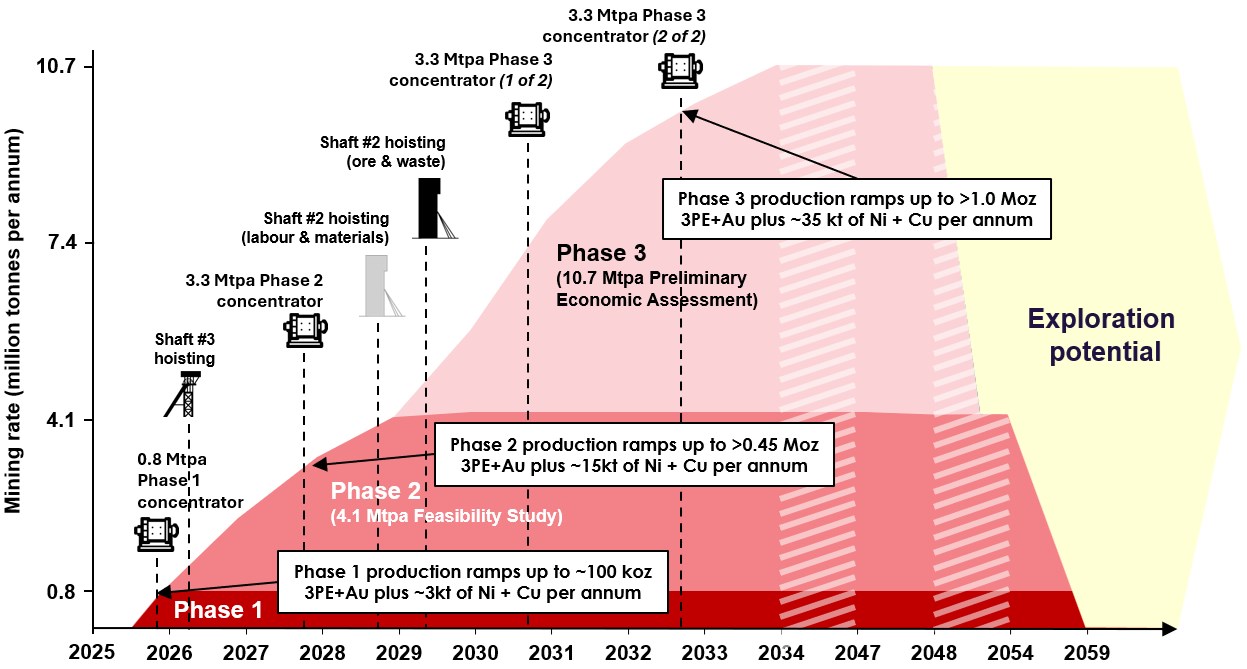
Figure 2: Phased development schematic of the Platreef mine, showing the annualized mining rate over life of mine.
To view an enhanced version of this graphic, please visit:
https://images.newsfilecorp.com/files/3396/250287_eb599a3d14abaabe_023full.jpg
4.1 Mtpa Feasibility Study targets first production from Phase 1 in Q4 2025 and Phase 2 expansion in Q4 2027.
Key Highlights
- First feed of ore into the 770-ktpa Phase 1 concentrator is expected in Q4 2025.
- Phase 1 annualized production is expected to ramp up to approximately 100,000 oz. of platinum, palladium, rhodium, and gold (3PE+Au), plus 2,000 tonnes of nickel and 1,000 tonnes of copper.
- Phase 1 will use both Shaft #1 and Shaft #3 for hoisting ore and waste, with a total combined hoisting capacity of up to 5.0 Mtpa.
- The remaining capital expenditure for Phase 1 is $70 million.
- The 4.1 Mtpa FS outlines an increase in the total processing capacity to approximately 4.1 Mtpa. This is achieved from a new 3.3-Mtpa Phase 2 concentrator module from Q4 2027.
- The 4.1 Mtpa FS ranks Platreef as the lowest-cost primary platinum-group metals (PGM) producer, with estimated life of mine (LOM) total cash costs of $599 per oz. of 3PE+Au, including royalties, streams, and net of by-products. Including sustaining capital, total cash costs are $704 per oz of 3PE+Au, as shown in Figure 3.
- The 4.1 Mtpa FS estimates LOM annualized production, once fully ramped up, of between 450,000 and 550,000 oz. of 3PE+Au, plus approximately 9,000 tonnes of nickel and 5,600 tonnes of copper. This is expected to rank Platreef as the eighth-largest primary PGM producer on a platinum-equivalent basis, as shown in Figure 4.
- The 4.1 Mtpa FS will initially use Shaft #1 and Shaft #3 for hoisting ore and waste to feed the Phase 2 concentrator module. Shaft #2 is expected to be initially equipped for hoisting labour and materials from 2029, further increasing total hoisting capacity, and providing significant operational flexibility.
- The expansion capital cost for 4.1 Mtpa FS is estimated at $1.2 billion, which is expected to be funded from an expanded project finance facility and equity.
- The 4.1 Mtpa FS delivers an after-tax net present value at an 8% discount rate (NPV8%) of $1.4 billion and an internal rate of return (IRR) of 20%, based on long-term consensus prices over a mine life of 35 years.
10.7 Mtpa PEA outlines an expansion from 2030 to rank Platreef as one of the largest global primary PGM producers, as well as a significant nickel producer
Key Highlights
- The 10.7 Mtpa PEA includes a further phase of expansion, Phase 3, to a total processing capacity of 10.7 Mtpa, following the completion of two additional 3.3-Mtpa concentrator modules in 2030 and 2032.
- LOM total cash costs for the 10.7 Mtpa PEA are expected to be $511 per oz. of 3PE+Au, net of by-products, benefitting from significant economies of scale. Including sustaining capital, total cash costs are expected to be $641 per ounce of 3PE+Au, net of by-products, as shown in Figure 2.
- Annualized production in the 10.7 Mtpa PEA, once fully ramped up, is expected to be between 1.0 and 1.2 million oz. of 3PE+Au, plus approximately 22,000 tonnes of nickel and 13,000 tonnes of copper. Phase 3 is expected to rank Platreef as one of the largest primary PGM producers on a platinum equivalent basis, as shown in Figure 3, as well as a significant nickel producer.
- The 10.7 Mtpa PEA uses Shaft #2 and Shaft #3 for hoisting ore and waste with a combined total capacity of over 12 Mtpa.
- The incremental expansion capital cost for the 10.7 Mtpa PEA is estimated at $803 million, leveraging the significant surface and underground infrastructure already constructed during Phase 2.
- The 10.7 Mtpa PEA delivers an NPV8% of $3.2 billion and an IRR of 25%, based on long-term consensus prices over a mine life of 29 years.
The 10.7 Mtpa PEA is preliminary and includes an economic analysis that is based, in part, on Inferred Mineral Resources. Inferred Mineral Resources are considered too speculative geologically for the application of economic considerations that would allow them to be categorized as Mineral Reserves - and there is no certainty that the results will be realized. Mineral Resources do not have demonstrated economic viability and are not Mineral Reserves.

Figure 3: Global primary PGM producers' 2024 total cash costs, net of by-products, and sustaining capital ($ per oz of 3PE+Au).
Source: SFA (Oxford), Ivanplats. Notes: Cost and production data for the Platreef project is based on the Platreef's 2025 4.1 Mtpa FS and 10.7 Mtpa PEA parameters, applying SFA South African industry average smelting and refining costs. SFA's estimated peer group cost and production data for 2024 is based on H1 2024 figures, extrapolated out to produce an estimate for the full calendar year, and follows a methodology to provide a level playing field for smelting and refining costs on a pro-rata basis from the producer processing entity. Net total cash costs have been calculated using 2024 average basket prices and exchange rates of 18.78:1 ZAR: USD, US$980/oz platinum, US$1,009/oz palladium, US$4,753/oz rhodium, US$2,300/oz gold, US$17,150/t nickel, and US$8,727/t copper. (1) Platreef 4.1 Mtpa between years 4 to 35. (2) Platreef 10.7 Mtpa between years 4 to 29.
To view an enhanced version of this graphic, please visit:
https://images.newsfilecorp.com/files/3396/250287_eb599a3d14abaabe_024full.jpg

Figure 3: Ranking of selected global primary PGM producers, based on 2024E platinum equivalent production (000 Pt eq. ounces).
Source: SFA (Oxford), Ivanplats. Notes: The chart only includes primary PGM producers. Cost and production data for the Platreef project is based on the Platreef's 2025 4.1 Mtpa FS and 10.7 Mtpa PEA parameters. Production data for the peer group is provided by SFA (Oxford). Equivalent platinum production has been calculated using average 2024 prices and exchange rates of 18.78:1 ZAR: USD, US$980/oz platinum, US$1,009/oz palladium, US$4,753/oz rhodium, US$2,300/oz gold, US$17,150/t nickel and US$8,727/t copper. (1) Platreef 4.1 Mtpa FS between years 4 to 35, (2) Platreef 10.7 Mtpa PEA between years 4 to 29.
To view an enhanced version of this graphic, please visit:
https://images.newsfilecorp.com/files/3396/250287_eb599a3d14abaabe_025full.jpg
Phase 2 expansion based on additional hoisting capacity from Shaft #3
The Phase 2 expansion will be accelerated by re-purposing ventilation Shaft #3 for hoisting. Shaft #3 will generate additional hoisting capacity of approximately 4 Mtpa, bringing the total hoisting capacity to approximately 5 Mtpa.
Shaft #3 is undergoing equipping and is expected to be ready for hoisting in the first quarter of 2026, well ahead of the completion of the much larger Shaft #2.
Additional underground ventilation will now be provided by two new 5.1-metre-diameter shafts, named Shaft #4 and Shaft #5. Drilling of the pilot hole for Shaft #4 was completed, with reaming well advanced. Civil construction of Shaft #4's substation building and ventilation fans has been completed with the fan installation advancing well. Geotechnical drilling has been completed for Shaft #5 site.
The installation of the 1,124 tonnes of internal structural steel inside Shaft #2's head frame continued during the quarter, as well as the installation of the sinking winders and related infrastructure. Reaming of Shaft #2 to an initial diameter of 3.1 metres has also been completed. Expansion of the shaft to its final diameter of 10 metres will commence in late 2025. The completion of Shaft #2 will increase the total hoisting capacity for ore and waste development, across all three shafts to over 12 Mtpa.

Construction of the headframes for Shaft #2 (left) and Shaft #3 (right) are well advanced, with operational Shaft #1 in the middle.
To view an enhanced version of this graphic, please visit:
https://images.newsfilecorp.com/files/3396/250287_eb599a3d14abaabe_026full.jpg

Franjo Bosmich (L), Mine Overseer, and Abram Makabe (R), Senior Shift Supervisor, discuss the civil construction of the new crusher.
To view an enhanced version of this graphic, please visit:
https://images.newsfilecorp.com/files/3396/250287_eb599a3d14abaabe_027full.jpg
Underground development expected to imminently reach the Flatreef orebody
Ivanplat's underground mining crew expected to imminently intercept the Flatreef orebody at Platreef's 850-metre level. The achievement marks the culmination of three years of underground development, totaling 5,133 metres. Development ore will be stockpiled on surface and processed in the Phase 1 concentrator from Q4 2025.
Platreef's on-site Solar power facility complete
Construction of Platreef's first 5 MW solar (PV) facility was completed during the quarter. The power generated by the plant will support development activities and operations, together with other renewable energy sources that are expected to be introduced over time.
5. Global Exploration Portfolio
Western Forelands Exploration Project, DRC
54%- to 100%-owned by Ivanhoe Mines
Ivanhoe's DRC exploration group is targeting Kamoa-Kakula-style copper mineralization on its Western Forelands exploration licences. Eight new licences, covering an area of 284 km2 were granted in the first quarter of 2025, bringing the total exploration area to 2,390 km2, across 32 licences.
Diamond drilling continued during the wet season with 12,620 metres drilled during the first quarter across 17 holes, including one wedge hole drilled for metallurgical test work. Diamond drilling focused on wide-spaced drilling at Makoko, Makoko West, and Kitoko to define the extent of the copper mineralization. The mineralization at Kitoko remains open down dip, deeper into the shelf towards the southeast, with the deepest hole intersecting mineralization at a depth of 1,240 metres. Drilling to the south of Makoko Central is ongoing to confirm the continuity of mineralization in this area following several ore-grade intersections in 2024.
Ivanhoe is targeting an updated Mineral Resource estimate for the Western Foreland in the coming weeks. The update will incorporate over 90,000 metres of diamond drilling completed from the maiden Mineral Resource estimate for Makoko and Kiala was made in late 2023, up to the end of March 2025. The updated Mineral Resource estimate will also include the new western and southern extensions of the Makoko strike, which is now approximately 13 kilometres long and will include the new discoveries of Kitoko and Makoko West.
Drilling rates are expected to pick up from the end of May when the dry season starts, with the diamond drill rig count set to increase from 5 to 11. The 2025 drilling program consists of 102,000 metres of diamond drilling and 18,000 metres of reverse circulation (RC) drilling. Drilling results from the remainder of the 2025 program will be included in a subsequent Mineral Resource update, which is expected to be made in H1 2026.
The interpretation of passive seismic data from both Lupemba and Kitoko is ongoing. Results of the survey delivered to date indicate the thickness of transported unconsolidated sands (Kalahari) overlaying Katangan Supergroup sedimentary units. Planning is well underway for audio-frequency magnetotellurics, ground gravity, and down-hole wireline geophysical surveys that will be carried out in 2025.
North-Western Province, Zambia
100%-owned by Ivanhoe Mines
As announced on April 2, 2025, Ivanhoe Mines was granted by the Government of the Republic of Zambia a 7,757-square-kilometre package of new exploration licences in the highly-prospective North-Western Province of Zambia. Ivanhoe's thesis behind the strategically selected licence package is to explore for an extension of the Central African Copperbelt. The award of licences follows a memorandum of understanding (MOU) that was signed between Ivanhoe Mines and the Republic of Zambia's Ministry of Mines and Minerals Development (Ministry of Mines) on September 10, 2024.
The new licence package is strategically located between Ivanhoe's Western Forelands Exploration Project (230 km to the northeast) and the company's Angolan exploration licence package (130 km southwest). The Zambia licences cover an area over three times larger than the Western Forelands Exploration Project.
Ivanhoe's geological team will commence exploration activities for new copper mineralization associated with Basement Domes, Katangan-age sediment-hosted copper systems, and iron-oxide-copper-gold (IOCG) systems. The western edge of the Central African Copperbelt in the Democratic Republic of the Congo (DRC) hosts the Western Foreland Shelf, where the Kamoa-Kakula Copper Complex and the Mineral Resources of Makoko and Kiala in the Western Forelands are located. Ivanhoe's geological team believes that the Western Foreland Shelf facies of the Nguba Group sediments continue to arc southwest into Zambia and Angola.
Moxico and Cuando Cubango Provinces, Angola
100%-owned by Ivanhoe Mines
Ivanhoe's exploration team is also targeting Western-Forelands-style sedimentary copper mineralization in Angola. The team is deploying its exploration expertise developed from its discoveries in the Western Forelands and from Kamoa-Kakula to its vast greenfield exploration package in Angola.
The team has a developed an exploration thesis that the DRC's Western Forelands shelf extends into eastern Angola. As announced on November 27, 2023, Ivanhoe acquired approximately 22,000 km2 of prospecting rights in the Moxico and Cuando Cubango provinces of Angola. Concurrently, Ivanhoe signed a mining investment contract with the Angolan National Agency for Mineral Resources.
After receiving the required permitting, access to the licenses was first made by Ivanhoe's geologists in August 2024. The team undertook a mapping and baseline soil geochemical sampling program over an area of 600 km2, which covered the same portion of the license flown by the airborne electromagnetic survey. A ground-based geophysics program was also completed, including Audio-frequency (AMT) and Magnetotellurics (MT) in conjunction with a Passive Seismic survey, down the eastern portion of the license area.
The results from the 2024 work streams continue to be analyzed over the wet season, with several targets generated for the 2025 exploration program once the wet season ends. Two diamond core drill rigs are planned to be mobilized in the coming month to complete an initial 6,400-metre stratigraphic diamond drill program.
The Chu-Sarysu Basin Exploration Joint Venture, Central Kazakhstan
20%-owned by Ivanhoe Mines
Ivanhoe Mines has formed an exploration Joint Venture with UK-based private company Pallas Resources, to explore the Chu-Sarysu Copper Basin in Kazakhstan, the world's third-largest sediment-hosted copper district. The joint venture covers a highly prospective licence package of up to 16,000 km2, which spans an accumulated dataset of Soviet-era exploration data.
As announced on February 12, 2025, Ivanhoe has committed to fund $18.7 million in exploration activities over an initial two-year period, with earn-in rights to further increase ownership up to 80% over time.
Exploration activities began during the first quarter, including the hiring of an exploration team as well as tendering and awarding an airborne geophysics contract.
Mokopane Feeder Project, South Africa
100%-owned by Ivanhoe Mines
Ivanhoe Mines is exploring the Northern Limb of South Africa's the Bushveld Complex, adjacent to Ivanplat's Platreef Project. Ivanhoe's geologists are testing a large gravity-high anomaly based on wide-spaced historical Council for Geoscience data. The anomaly is interpreted to represent. The working hypothesis is that the large gravity-high anomaly is interpreted by scientific research to represent a potential primary feeder zone of magma and mineralization into the Northern Limb of the Bushveld Complex, essentially the sources of mineralization that make up the Platreef and other Northern Limb deposits.
The collection, interpretation, and review process of all geological and geophysical data was completed early in 2024. The geological understanding of the anomaly continues to evolve, with numerous targets identified for drilling.
Following the completion of heritage surveys and community engagement around the proposed drilling sites, Geosearch, a diamond drilling contractor, commenced drilling in January 2025. A 6,000-metre diamond-core drill program is planned over four holes. Completion of the program is expected by the end of 2025. Downhole geophysics will be conducted concurrently with drilling.

(L-R) Guvet Mashamaite, Ernest Mbedzi, and David Maluleka (back) connecting drill rods at the Mokopane Feeder drill site.
To view an enhanced version of this graphic, please visit:
https://images.newsfilecorp.com/files/3396/250287_eb599a3d14abaabe_028full.jpg
SELECTED QUARTERLY FINANCIAL INFORMATION
The following table summarizes selected financial information for the prior eight quarters. Revenue from commercial production at the Kipushi Mine commenced in Q4 2024. All revenue from production at Kamoa-Kakula is recognized within the Kamoa Holding joint venture. Ivanhoe did not declare or pay any dividend or distribution in any financial reporting period.
| Three months ended | |||||||||||||
| March 31, | December 31, | September 30, | June 30, | ||||||||||
| 2025 | 2024 | 2024 | 2024 | ||||||||||
| $'000 | $'000 | $'000 | $'000 | ||||||||||
| Revenue | 77,020 | 40,818 | – | – | |||||||||
| Cost of sales | (81,771 | ) | (51,563 | ) | – | – | |||||||
| Share of profit from joint venture | 107,948 | 73,620 | 83,507 | 89,616 | |||||||||
| Finance income | 41,623 | 56,041 | 60,164 | 62,873 | |||||||||
| Deferred tax recovery | 4,374 | 12,663 | 575 | 1,398 | |||||||||
| Finance costs | (7,838 | ) | (6,849 | ) | (471 | ) | (32,871 | ) | |||||
| Loss on fair valuation of embedded derivative liability | – | – | (4,171 | ) | (20,727 | ) | |||||||
| General administrative expenditure | (9,957 | ) | (19,633 | ) | (10,573 | ) | (12,345 | ) | |||||
| Exploration and project evaluation expenditure | (9,145 | ) | (15,845 | ) | (12,813 | ) | (10,589 | ) | |||||
| Share-based payments | (2,418 | ) | (2,977 | ) | (7,504 | ) | (8,505 | ) | |||||
| Profit (loss) attributable to: | |||||||||||||
| Owners of the Company | 129,760 | 99,344 | 117,942 | 76,401 | |||||||||
| Non-controlling interests | (7,560 | ) | (11,338 | ) | (9,760 | ) | (9,885 | ) | |||||
| Total comprehensive income (loss) attributable to: | |||||||||||||
| Owners of the Company | 135,033 | 60,964 | 141,525 | 88,223 | |||||||||
| Non-controlling interest | (7,161 | ) | (15,158 | ) | (7,469 | ) | (8,672 | ) | |||||
| Basic profit per share | 0.10 | 0.07 | 0.09 | 0.06 | |||||||||
| Diluted profit per share | 0.10 | 0.07 | 0.09 | 0.06 | |||||||||
| Three months ended | |||||||||||||
| March 31, | December 31, | September 30, | June 30, | ||||||||||
| 2024 | 2023 | 2023 | 2023 | ||||||||||
| $'000 | $'000 | $'000 | $'000 | ||||||||||
| Share of profit from joint venture | 45,165 | 49,272 | 69,829 | 73,066 | |||||||||
| Finance income | 62,457 | 63,110 | 56,671 | 61,956 | |||||||||
| (Loss) gain on fair valuation of embedded derivative liability | (139,271 | ) | (39,961 | ) | 12,218 | (26,618 | ) | ||||||
| General administrative expenditure | (14,001 | ) | (14,947 | ) | (9,841 | ) | (10,474 | ) | |||||
| Finance costs | (8,944 | ) | (6,741 | ) | (8,752 | ) | (5,539 | ) | |||||
| Share-based payments | (8,933 | ) | (7,715 | ) | (6,732 | ) | (7,120 | ) | |||||
| Exploration and project evaluation expenditure | (8,901 | ) | (8,637 | ) | (6,264 | ) | (4,375 | ) | |||||
| Deferred tax recovery | 3,221 | 4,201 | 1,212 | 1,965 | |||||||||
| (Loss) profit attributable to: | |||||||||||||
| Owners of the Company | (65,552 | ) | 27,739 | 112,510 | 92,042 | ||||||||
| Non-controlling interests | (3,858 | ) | (1,980 | ) | (4,988 | ) | (4,859 | ) | |||||
| Total comprehensive (loss) income attributable to: | |||||||||||||
| Owners of the Company | (73,648 | ) | 37,155 | 109,681 | 86,588 | ||||||||
| Non-controlling interest | (4,728 | ) | (1,003 | ) | (5,250 | ) | (5,433 | ) | |||||
| Basic (loss) profit per share | (0.05 | ) | 0.02 | 0.09 | 0.08 | ||||||||
| Diluted (loss) profit per share | (0.05 | ) | 0.02 | 0.08 | 0.07 | ||||||||
DISCUSSION OF RESULTS OF OPERATIONS
Review of the three months ended March 31, 2025 vs. March 31, 2024
The company recorded a profit for Q1 2025 of $122 million and total comprehensive income of $128 million compared to a loss of $69 million and total comprehensive loss of $78 million for the same period in 2024. The main contributor to the profit for Q1 2025 was the company's share of profit from the Kamoa Holding joint venture of $108 million. The loss for Q1 2024 included a loss of fair valuation of embedded derivative liability of $139 million.
The Kamoa-Kakula Copper Complex sold 109,963 tonnes of payable copper in Q1 2025 realizing revenue of $973 million for the Kamoa Holding joint venture, compared to 85,155 tonnes of payable copper sold for revenue of $618 million for the same period in 2024. The company recognized income in aggregate of $142 million from the joint venture in Q1 2025 and $101 million for the same period in 2024, which can be summarized as follows:
| Three months ended | ||||
| March 31, | ||||
| 2025 | 2024 | |||
| $'000 | $'000 | |||
| Company's share of profit from joint venture | 107,948 | 45,165 | ||
| Interest on loan to joint venture | 34,080 | 55,391 | ||
| Company's income recognized from joint venture | 142,028 | 100,556 | ||
The company's share of profit from the Kamoa Holding joint venture was $63 million more in Q1 2025 compared to the same period in 2024 and is broken down in the following table:
| Three months ended | ||||||||
| March 31, | ||||||||
| 2025 | 2024 | |||||||
| $'000 | $'000 | |||||||
| Revenue from contract receivables | 922,411 | 612,496 | ||||||
| Remeasurement of contract receivables | 50,986 | 5,824 | ||||||
| Revenue | 973,397 | 618,320 | ||||||
| Cost of sales | (453,263 | ) | (282,341 | ) | ||||
| Gross profit | 520,134 | 335,979 | ||||||
| General and administrative costs | (34,520 | ) | (47,028 | ) | ||||
| Amortization of mineral property | (4,996 | ) | (2,765 | ) | ||||
| Profit from operations | 480,618 | 286,186 | ||||||
| Finance costs | (59,356 | ) | (73,716 | ) | ||||
| Impairment | (9,177 | ) | - | |||||
| Foreign exchange loss | (815 | ) | (8,730 | ) | ||||
| Finance income and other | 5,316 | 4,051 | ||||||
| Profit before taxes | 416,586 | 207,791 | ||||||
| Current tax expense | (102,228 | ) | (60,299 | ) | ||||
| Deferred tax expense | (47,938 | ) | (14,332 | ) | ||||
| Profit after taxes | 266,420 | 133,160 | ||||||
| Non-controlling interest of Kamoa Holding | (48,343 | ) | (41,918 | ) | ||||
| Total comprehensive income for the period | 218,077 | 91,242 | ||||||
| Company's share of profit from joint venture (49.5%) | 107,948 | 45,165 | ||||||
The realized and provisional copper prices used for the remeasurement (mark-to-market) of contract receivables for the three months ended March 31, 2025, and for the same period in 2024, can be summarized as follows:
| Three months ended | ||||||
| March 31, | ||||||
| 2025 | 2024 | |||||
| $'000 | $'000 | |||||
| Realized during the period - open at the start of the period | ||||||
| Opening forward price ($/lb.)(1) | 4.01 | 3.86 | ||||
| Realized price ($/lb.)(1) | 4.14 | 3.78 | ||||
| Payable copper tonnes sold | 79,985 | 35,966 | ||||
| Remeasurement of contract receivables ($'000) | 21,811 | (6,040 | ) | |||
| Realized during the period - new copper sold in the current period | ||||||
| Provisional price ($/lb.)(1) | 4.11 | 3.78 | ||||
| Realized price ($/lb.)(1) | 4.28 | 3.85 | ||||
| Payable copper tonnes sold | 45,527 | 55,529 | ||||
| Remeasurement of contract receivables ($'000) | 16,807 | 8,801 | ||||
| Open at the end of the period - new copper sold in current period | ||||||
| Provisional price ($/lb.)(1) | 4.35 | 3.94 | ||||
| Closing forward price ($/lb.)(1) | 4.44 | 3.99 | ||||
| Payable copper tonnes sold | 64,436 | 29,626 | ||||
| Remeasurement of contract receivables ($'000) | 12,368 | 3,063 | ||||
| Total remeasurement of contract receivables ($'000) | 50,986 | 5,824 | ||||
| (1) Calculated on a weighted average basis | ||||||
The finance costs recognized in the Kamoa Holding joint venture can be broken down as follows:
| Three months ended | ||||||||
| March 31, | ||||||||
| 2025 | 2024 | |||||||
| $'000 | $'000 | |||||||
| Interest on shareholder loans | 68,817 | 111,871 | ||||||
| Interest on provisional and advance payment facilities | 40,197 | 21,068 | ||||||
| Interest on syndicated loans | 11,243 | – | ||||||
| Interest on bank loans and overdraft facilities | 7,498 | 1,789 | ||||||
| Rehabilitation unwinding | 2,253 | – | ||||||
| Lease liability unwinding | 1,783 | 1,827 | ||||||
| Interest on equipment financing facilities | 1,757 | 2,787 | ||||||
| Interest capitalized as borrowing costs | (74,192 | ) | (65,626 | ) | ||||
| 59,356 | 73,716 | |||||||
Ivanhoe's exploration and project evaluation expenditure amounted to $9 million for the three months ended March 31, 2025, and was $0 million more than for the same period in 2024 ($9 million). Exploration and project evaluation expenditure during the quarter related mainly to Ivanhoe's Western Forelands exploration licences.
Finance income amounted to $42 million for the three months ended March 31, 2025, and $62 million for the same period in 2024. Included in finance income is the interest earned on loans to the Kamoa Holding joint venture to fund past development which amounted to $34 million for the three months ended March 31, 2025, and $55 million for the same period in 2024 and decreased due to the effects of the subscription and set-off agreement entered into by Kamoa Holding and its shareholders in December 2024.
The Company sold 30,108 tonnes of payable zinc produced by the Kipushi Mine in the first quarter of 2025 realizing revenue of $77 million at a cost of sales of $82 million. Kipushi's margin is expected to improve as production increases. The cost of sales for the quarter also included depreciation and amortization of $14 million.
The realized, provisional, and forward zinc prices used for the remeasurement (mark-to-market) of contract receivables of Kipushi for the three months ended March 31, 2025, can be summarized as follows:
| Q1 2025 | Q4 2024 | |||
| $'000 | $'000 | |||
| Realized during the period - open at the start of the period | ||||
| Opening forward price ($/lb.)(1) | 1.34 | – | ||
| Realized price ($/lb.)(1) | 1.28 | – | ||
| Payable zinc tonnes sold | 11,596 | – | ||
| Remeasurement of contract receivables ($'000) | (1,496) | – | ||
| Realized during the period - new zinc sold in the current period | ||||
| Provisional price ($/lb.)(1) | 1.31 | 1.39 | ||
| Realized price ($/lb.)(1) | 1.29 | 1.38 | ||
| Payable zinc tonnes sold | 20,432 | 5,090 | ||
| Remeasurement of contract receivables ($'000) | (878) | (81 | ) | |
| Open at the end of the period - new zinc sold in the current period | ||||
| Provisional price ($/lb.)(1) | 1 | 1.37 | ||
| Closing forward price ($/lb.)(1) | 1 | 1.34 | ||
| Payable zinc tonnes sold | 9,676 | 11,909 | ||
| Remeasurement of contract receivables ($'000) | (319) | (701 | ) | |
| Total remeasurement of contract receivables ($'000) | (2,693) | (782 | ) | |
| (1) Calculated on a weighted average basis |
Financial position as at March 31, 2025, vs. December 31, 2024
The company's total assets increased by $861 million, from $5,738 million as at December 31, 2024, to $6,599 million as at March 31, 2025. The increase in total assets was mainly attributable to the increase in cash and cash equivalents due to the receipt of proceeds from the Senior Notes (as defined below), which amounted to $730 million net of transaction costs, the increase in the company's investment in the Kamoa Holding joint venture by $142 million and the increase in property, plant, and equipment of $84 million as project development continued at the Platreef project.
The company's investment in the Kamoa Holding joint venture increased by $142 million from $3,034 million as at December 31, 2024, to $3,176 million as at March 31, 2025. The company's investment in the Kamoa Holding joint venture can be broken down as follows:
| March 31, | December 31, | |||
| 2025 | 2024 | |||
| $'000 | $'000 | |||
| Company's share of net assets in joint venture | 1,998,921 | 1,890,974 | ||
| Loan advanced to joint venture | 1,176,824 | 1,142,744 | ||
| Total investment in joint venture | 3,175,745 | 3,033,718 |
The company's share of the net assets in the Kamoa Holding joint venture can be broken down as follows:
| March 31, 2025 | December 31, 2024 | |||||||||||||
| 100% | 49.5% | 100% | 49.5% | |||||||||||
| $'000 | $'000 | $'000 | $'000 | |||||||||||
| Assets | ||||||||||||||
| Property, plant, and equipment | 6,377,998 | 3,157,109 | 6,122,292 | 3,030,535 | ||||||||||
| Mineral property | 758,221 | 375,319 | 763,217 | 377,792 | ||||||||||
| Indirect taxes receivable | 719,835 | 356,318 | 651,915 | 322,698 | ||||||||||
| Current inventory | 733,932 | 363,296 | 564,685 | 279,519 | ||||||||||
| Long-term loan receivable | 401,115 | 198,552 | 374,485 | 185,370 | ||||||||||
| Run of mine stockpile | 307,073 | 152,001 | 318,688 | 157,751 | ||||||||||
| Trade receivables | 421,875 | 208,828 | 280,795 | 138,994 | ||||||||||
| Cash and cash equivalents | 97,938 | 48,479 | 100,641 | 49,817 | ||||||||||
| Right-of-use asset | 41,960 | 20,770 | 51,764 | 25,623 | ||||||||||
| Deferred tax asset | 30,442 | 15,069 | 27,594 | 13,659 | ||||||||||
| Prepayments and other receivables | 345,749 | 171,146 | 388,454 | 192,285 | ||||||||||
| Non-current deposits | 1,872 | 927 | 1,872 | 927 | ||||||||||
| Liabilities | ||||||||||||||
| Shareholder loans | (2,377,801 | ) | (1,177,011 | ) | (2,308,984 | ) | (1,142,947 | ) | ||||||
| Trade and other payables | (660,622 | ) | (327,007 | ) | (759,082 | ) | (375,745 | ) | ||||||
| Advance payment facility | (886,824 | ) | (438,978 | ) | (681,345 | ) | (337,266 | ) | ||||||
| Term loan facilities | (657,917 | ) | (325,669 | ) | (668,508 | ) | (330,911 | ) | ||||||
| Deferred tax liability | (374,325 | ) | (185,291 | ) | (323,546 | ) | (160,155 | ) | ||||||
| Overdraft facility | (236,019 | ) | (116,829 | ) | (232,475 | ) | (115,075 | ) | ||||||
| Rehabilitation provision | (145,321 | ) | (71,934 | ) | (123,668 | ) | (61,216 | ) | ||||||
| Provisional payment facility | (90,656 | ) | (44,875 | ) | (78,993 | ) | (39,102 | ) | ||||||
| Lease liability | (48,606 | ) | (24,060 | ) | (52,093 | ) | (25,786 | ) | ||||||
| Income taxes payable | (66,565 | ) | (32,950 | ) | 9,227 | 4,567 | ||||||||
| Dividends payable | (110,919 | ) | (54,905 | ) | – | – | ||||||||
| Non-controlling interest | (544,211 | ) | (269,384 | ) | (606,788 | ) | (300,360 | ) | ||||||
| Net assets of the joint venture | 4,038,224 | 1,998,921 | 3,820,147 | 1,890,974 | ||||||||||
Before commencing commercial production in July 2021, the Kamoa Holding joint venture principally used loans from its shareholders to develop the Kamoa-Kakula Copper Complex through investing in development costs and other property, plant, and equipment. No additional shareholder loans were advanced from 2022 to date with joint venture cashflow and joint venture level facilities funding its operations and expansions.
Overdraft facilities represent drawn unsecured financing facilities from DRC financial institutions at an attractive cost of capital, utilized to augment cash generated from operations for Kamoa-Kakula's continued expansion and working capital. Total current overdraft facilities amount to $250 million, with an interest rate of approximately 6.5%.
The term loan facilities of the Kamoa Holding joint venture can be summarized as follows:
| Description | Repayment terms | March 31, | December 31, | ||||||
| 2025 | 2024 | ||||||||
| $'000 | $'000 | ||||||||
| Syndicated term facility | Repayable in eight equal quarterly installments starting from March 31, 2026 | 399,441 | 403,568 | ||||||
| Facility agreement | Full repayment on June 25, 2025 | 200,892 | 199,911 | ||||||
| Equipment financing facilities | Installments on each quarterly facility repayment date, with $43 million repayable in the next 12 months | 57,584 | 65,029 | ||||||
| Total term loan facilities | 657,917 | 668,508 |
The repayments of the advanced payment facilities of the Kamoa Holding joint venture can be summarized as follows:
| More than | |||||||||||||||||
| 0-3 months | 3-6 months | 6-12 months | 12-24 months | 24 months | |||||||||||||
| $'000 | $'000 | $'000 | $'000 | $'000 | |||||||||||||
| As at March 31, 2025 | 180.0 | 160.0 | 220.0 | 240.0 | 486.8 |
The cash flows of the Kamoa Holding joint venture can be summarized as follows:
| Three months ended | ||||
| March 31, | ||||
| 2025 | 2024 | |||
| $'000 | $'000 | |||
| Net cash generated from operating activities before change in working capital items | 555,689 | 338,388 | ||
| Change in working capital items | (509,231) | (104,231) | ||
| Net cash used in investing activities | (298,462) | (531,587) | ||
| Net cash generated from financing activities | 242,748 | 430,465 | ||
| Effect of foreign exchange rates on cash | 3,009 | (1,827 | ) | |
| Net cash outflow | (6,247) | 131,208 | ||
| Cash and cash equivalents - beginning of the year | (131,834) | (105,289 | ) | |
| Cash and cash equivalents - end of the period | (138,081) | 25,919 | ||
The Kamoa Holding joint venture's net increase in property, plant, and equipment from December 31, 2024, to March 31, 2025, amounted to $256 million and can be further broken down as follows:
| Three months ended | |||||||
| March 31, | |||||||
| 2025 | 2024 | ||||||
| $'000 | $'000 | ||||||
| Kamoa Holding joint venture | |||||||
| Expansion capital | 207,002 | 447,679 | |||||
| Sustaining capital | 89,774 | 69,801 | |||||
| 296,776 | 517,480 | ||||||
| Depreciation capitalized | 13,713 | 13,110 | |||||
| Total capital expenditure | 310,489 | 530,590 | |||||
| Borrowing costs capitalized | 74,192 | 65,626 | |||||
| Total additions to property, plant, and equipment for Kamoa Holding | 384,681 | 596,216 | |||||
| Less depreciation, disposals, and foreign exchange translation | (128,975) | (78,899 | ) | ||||
| Net increase in property, plant, and equipment of Kamoa Holding | 255,706 | 517,317 | |||||
Ivanhoe’s cash and cash equivalents increased by $600 million, from $117 million as at December 31, 2024, to $717 million as at March 31, 2025. The company spent $71 million on project development and acquiring other property, plant, and equipment and $55 million on its operating activities.
The net increase in property, plant, and equipment amounted to $84 million, with additions of $73 million to project development and other property, plant, and equipment. Of this total, $53 million pertained to development costs and other acquisitions of property, plant, and equipment at the Platreef Project, while $20 million pertained to development costs and other acquisitions of property, plant, and equipment at the Kipushi Project as set out below.
The main components of the additions to property, plant, and equipment - including capitalized development costs - at the Platreef project and the Kipushi Mine for the three months ended March 31, 2025, and for the same period in 2024, are set out in the following tables:
| Three months ended | ||||||||
| March 31, | ||||||||
| 2025 | 2024 | |||||||
| $'000 | $'000 | |||||||
| Platreef Project | ||||||||
| Phase 2 construction | 21,822 | 16,025 | ||||||
| Site costs | 10,447 | 900 | ||||||
| Salaries and benefits | 9,184 | 4,169 | ||||||
| Administrative and other expenditure | 4,938 | 2,167 | ||||||
| Phase 1 construction | 3,053 | 23,601 | ||||||
| Depreciation | 2,369 | 1,932 | ||||||
| Social and environmental | 1,026 | 234 | ||||||
| Studies and contracting work | 676 | 821 | ||||||
| Total development costs | 53,515 | 49,849 | ||||||
| Other additions to property, plant, and equipment | 32 | 3,621 | ||||||
| Total additions to property, plant, and equipment for Platreef | 53,547 | 53,470 | ||||||
| Three months ended | |||||||
| March 31, | |||||||
| 2025 | 2024 | ||||||
| $'000 | $'000 | ||||||
| Kipushi Mine | |||||||
| Initial and expansion capital | 7,468 | 69,959 | |||||
| Sustaining capital | 12,321 | – | |||||
| 19,789 | 69,959 | ||||||
| Depreciation capitalized | – | 1,676 | |||||
| Total capital expenditure | 19,789 | 71,635 | |||||
| Total additions to property, plant, and equipment | 19,789 | 71,635 | |||||
The company's total liabilities increased by $730 million to $1,632 million as at March 31, 2025, from $902 million as at December 31, 2024, with the increase mainly due to the issuance $750 million 7.875% Senior Notes due 2030.
On January 23, 2025, the company issued debt securities with an aggregate principal of $750 million ("Senior Notes") and a maturity date of January 23, 2030. The Senior Notes carry a coupon of 7.875% per annum payable semi-annually in arrears on January 23 and July 23 each year, commencing on July 23, 2025. The Senior Notes are senior unsecured borrowings of the Company and are guaranteed by the company's subsidiaries, Kipushi Holding Limited and Ivanhoe Mines US LLC. The Senior Notes are listed on The International Stock Exchange, Guernsey, and traded on the Global Exchange Market. The gross proceeds from the Senior Notes will be used for general corporate purposes, including capital expenditure associated with the company's projects, and to pay certain fees and expenses related to the Offering. Interest is payable semi-annually in arrears at a rate of 7.875% per annum on January 23 and July 23 of each year, commencing on July 23, 2025.
Transaction costs of $20.3 million associated with the Notes were capitalized against the principal amount and an amount of $19.6 million remains unamortized as at March 31, 2025. The effective interest rate of the Senior Notes was deemed to be 8.6467%. Interest of $11.6 million was incurred for the three months ended March 31, 2025.
LIQUIDITY AND CAPITAL RESOURCES
The company had $717 million in cash and cash equivalents as at March 31, 2025. At this date, the company had consolidated working capital surplus of approximately $702 million, compared to a working capital surplus of approximately $60 million as at December 31, 2024.
The company's capital expenditure can be summarized as follows:
| Capital Expenditure | 2025 Actuals | 2025 Guidance | 2026 Guidance | ||||||||
| ($' million) | ($' million) | ($' million) | |||||||||
| Kamoa-Kakula | |||||||||||
| Phase 3 and other expansion capital | 207 | 1,050- 1,300 | 300 - 550 | ||||||||
| Sustaining capital | 90 | 370 | 380 | ||||||||
| 297 | 1,420 - 1,670 | 680 - 930 | |||||||||
| Platreef | |||||||||||
| Phase 1 initial capital | 13 | 70 | – | ||||||||
| Phase 2 capital | 38 | 180 - 210 | 350 - 380 | ||||||||
| 51 | 250 - 280 | 350 - 380 | |||||||||
| Kipushi | |||||||||||
| Debottlenecking capital | 7 | 30 | – | ||||||||
| Sustaining capital | 13 | 40 | 35 | ||||||||
| 20 | 70 | 35 | |||||||||
Figures in the above table are presented on a 100% basis.
Kamoa-Kakula's operations are anticipated to generate significant operating cash flow and are expected to, together with joint venture-level financing facilities, be sufficient to fund the 2025 capital cost requirements at current copper prices. Kamoa-Kakula's guidance is provisional and will be updated on the completion of the Kamoa-Kakula 2025 Integrated Development Plan with the updated project development strategy, which is expected to be completed in mid-2025.
Construction of Platreef's Phase 1 concentrator was completed on schedule in Q3 2024 and is currently on care and maintenance until Q4 2025, as Shaft #1 prioritizes the hoisting of waste from the development required to bring forward the start of Phase 2. Phase 1 first production is expected in Q4 2025 with the Phase 2 expansion accelerated by a year to 2027.
Ivanhoe's exploration budget for 2025 has been set to approximately $75 million, with $50 million of that earmarked for exploration activities focused on the Western Forelands Project.
PRO-RATA FINANCIAL RATIOS
The following pro-rata financial ratios have been calculated by aggregating the contributions of the company with the contributions from the Kamoa-Kakula joint venture, pro-rata to the company's effective shareholding in the Kamoa-Kakula joint venture.
| (in millions of $, except ratios) | March 31, | December 31, | ||||||
| 2025 | 2024 | |||||||
| Pro-rata total debt | 1,840.9 | 1,016.3 | ||||||
| Pro-rata cash | 762.2 | 163.5 | ||||||
| Pro-rata net debt | 1,078.7 | 852.8 | ||||||
| Pro-rata net debt to Adjusted EBITDA (1) | 1.49x | 1.36x |
(1) Pro-rata net debt to Adjusted EBITDA ratio is a non-GAAP financial measure. Pro-rata net debt to Adjusted EBITDA ratio is pro-rata net debt divided by Adjusted EBITDA for the twelve months ended at the reporting period, expressed as the number of times Adjusted EBITDA needs to be earned to repay the pro-rata net debt.
The company's pro-rata total debt is summarized as follows:
| March 31, | December 31, | |||||
| 2025 | 2024 | |||||
| $'millions | $'millions | |||||
| Consolidated indebtedness of the Company: | ||||||
| Senior notes | 741.2 | – | ||||
| Senior debt facility | 63.4 | 63.4 | ||||
| Advance payment facilities | 120.0 | 120.0 | ||||
| Other borrowings | 175.2 | 175.0 | ||||
| 1,099.8 | 358.4 | |||||
| Pro-rata indebtedness of Kamoa Holding joint venture | ||||||
| Term loan facilities | 260.5 | 264.7 | ||||
| Advance payment facilities | 351.2 | 269.8 | ||||
| Provisional payment facilities | 35.9 | 31.3 | ||||
| Overdraft facilities | 93.5 | 92.1 | ||||
| 741.1 | 657.9 | |||||
| Pro-rata total debt | 1,840.9 | 1,016.3 |
The pro-rata cash and cash equivalents of the company are summarized as follows:
| March 31, | December 31, | |||||
| 2025 | 2024 | |||||
| $'millions | $'millions | |||||
| Consolidated cash and cash equivalents of the Company | 717.0 | 117.3 | ||||
| Pro-rata cash and cash equivalents of Kamoa Holding joint venture | 45.2 | 46.2 | ||||
| Pro-rata cash and cash equivalents | 762.2 | 163.5 |
The pro-rata net debt of the Company is summarized as follows:
| March 31, | December 31, | |||
| 2025 | 2024 | |||
| $'millions | $'millions | |||
| Pro-rata total debt | 1,840.9 | 1,016.3 | ||
| Pro-rata cash and cash equivalents | 762.2 | 163.5 | ||
| Pro-rata net debt | 1,078.7 | 852.8 |
The Adjusted EBITDA of the company for the twelve months ended March 31, 2025 is summarized as follows:
| Twelve months ended | ||||||||||||||||
| March 31, | ||||||||||||||||
| 2025 | Q1 2025 | Q4 2024 | Q3 2024 | Q2 2024 | ||||||||||||
| $'millions | $'millions | $'millions | $'millions | $'millions | ||||||||||||
| Profit after taxes | 384.9 | 122.2 | 88.0 | 108.2 | 66.5 | |||||||||||
| Finance income | (220.7) | (41.6 | ) | (56.0 | ) | (60.2 | ) | (62.9 | ) | |||||||
| Current and deferred tax | (15.0) | (4.0 | ) | (12.4 | ) | 0.6 | 0.8 | |||||||||
| Finance costs | 48.0 | 7.8 | 6.8 | 0.5 | 32.9 | |||||||||||
| Unrealized foreign exchange loss (gain) | 4.5 | 0.7 | 2.8 | (1.3 | ) | 2.3 | ||||||||||
| Depreciation | 25.1 | 11.9 | 11.5 | 1.0 | 0.7 | |||||||||||
| Amortization of mineral property | 7.7 | 2.3 | 5.4 | – | – | |||||||||||
| EBITDA | 234.5 | 99.3 | 46.1 | 48.8 | 40.3 | |||||||||||
| Share of profit from joint venture net of tax | (354.6) | (107.9 | ) | (73.6 | ) | (83.5 | ) | (89.6 | ) | |||||||
| Company's share of EBITDA from Kamoa-Kakula joint venture (1) | 799.0 | 231.3 | 158.9 | 184.7 | 224.1 | |||||||||||
| Non-cash share-based payments | 21.3 | 3.7 | 4.3 | 5.8 | 7.5 | |||||||||||
| Loss on fair valuation of embedded derivative liability | 24.9 | – | – | 4.2 | 20.7 | |||||||||||
| Adjusted EBITDA | 725.1 | 226.4 | 135.7 | 160.0 | 203.0 |
SUMMARY OF DEBT FACILITIES
On January 23, 2025, the Company issued debt securities with an aggregate principal of $750 million, being the Senior Notes, and a maturity date of January 23, 2030. The Senior Notes carry a coupon of 7.875% per annum payable semi-annually in arrears on January 23 and July 23 each year, commencing on July 23, 2025. The Senior Notes are senior unsecured borrowings of the Company and are guaranteed by the Company's subsidiaries, Kipushi Holding Limited and Ivanhoe Mines US LLC. The Senior Notes are listed on The International Stock Exchange, Guernsey, and traded on the Global Exchange Market. The gross proceeds from the Senior Notes will be used for general corporate purposes, including capital expenditure associated with the Company's projects, and to pay certain fees and expenses related to the Offering. Interest is payable semi-annually in arrears at a rate of 7.875% per annum on January 23 and July 23 of each year, commencing on July 23, 2025. Transaction costs of $20.3 million associated with the Senior Notes were capitalized against the principal amount and an amount of $19.6 million remains unamortized as at March 31, 2025. The effective interest rate of the senior notes was deemed to be 8.6467%. Interest of $11.6 million was incurred for the three months ended March 31, 2025.
On or after January 23, 2027, the Company has the right to redeem all or part of the Senior Notes at the following redemption prices, expressed as a percentage of the principal amount, plus any unpaid accrued interest.
| Redemption price | |
| Period of 12 months from January 23, 2027 | 103.9375% |
| Period of 12 months from January 23, 2028 | 101.9688% |
| Period of 12 months from January 23, 2029 | 100.0000% |
On December 10, 2024, Kipushi entered into a $50 million revolving credit facility agreement with RMB. Under the terms of the agreement, RMB provided a $50 million revolving loan facility to Kipushi to finance costs and expenditures related to the Project. Kipushi drew $26 million from the facility on December 13, 2024. The facility incurs interest at the applicable Term SOFR plus a margin of 4.5% per annum. Interest is repayable on the last day of each interest period (being either 1, 3, or 6 months), with the facility repayable in full in December 2026 (unless repayment is extended in accordance with the terms of the agreement). Repayment may, upon mutual agreement of Kipushi and RMB, be extended by successive 12-month periods. Ivanhoe Mines Ltd. has provided a corporate guarantee under this loan agreement.
On October 25, 2024, Ivanhoe Marketing and RMB entered into a $75 million revolving credit facility agreement. Under the terms of the agreement, RMB provided a $75 million revolving loan facility to Ivanhoe Marketing to finance general corporate purposes and working capital requirements. Ivanhoe Marketing drew $40 million from the facility on October 29, 2024. The facility incurs interest at the applicable Term SOFR plus a margin of 3.25% per annum. Interest is repayable on the last day of each interest period (being either 1, 3, or 6 months), with the facility repayable in full in October 2025. Repayment may, upon mutual agreement of Ivanhoe Marketing and RMB, be extended by successive 12-month periods. Ivanhoe Mines Ltd. guarantees all amounts due to RMB under this facility agreement.
During the second quarter of 2024, Kipushi entered into a $50 million facility agreement with FirstBank DRC SA (FirstBank). Under the terms of the agreement, FirstBank provided a $50 million facility to Kipushi to finance costs related to the development of the project. Kipushi drew down on the full facility on the date of the agreement. The facility incurs interest at a 3-month Term SOFR plus a margin of 4.5% per annum. Interest is repayable every three months, with the facility repayable in full in May 2025, but repayment may automatically be extended by a further consecutive 12 months unless either party to the agreement gives written confirmation that there shall be no such automatic extension of the date.
On December 22, 2023, Ivanplats entered into a common terms and senior secured facility agreement between, amongst others, Société Générale and Nedbank Limited (acting through its Nedbank Corporate and Investment Banking Division) (Nedbank) as lenders; Ivanplats as borrower; Ivanplats Holding S.À.R.L, ITC, and Ivanhoe Mines SA (Pty) Ltd. as guarantors; Ivanhoe Mines Ltd. as sponsor; and Nedbank Limited as global facility agent (as amended and amended and restated from time to time, the "Platreef Senior Debt Financing Agreement"). Under the Platreef Senior Debt Financing Agreement, the lenders thereunder make available to Ivanplats a senior secured facility in an aggregate principal amount of up to $150 million (the "Platreef Senior Debt"). The Platreef Senior Debt incurs an initial interest at the applicable Term SOFR (subject to a zero floor) plus 4.80%. The initial rate of interest shall apply until the earlier of the Completion Date (as defined in and subject to the conditions of the Platreef Senior Debt Financing Agreement) and the Target Refinancing Date (July 31, 2026), after which the interest rate shall be Term SOFR + 4.65% per annum from the Completion Date (if the Target Refinancing Date has not occurred) or Term SOFR + 6.50% per annum from the Target Refinancing Date. Ivanplats drew on $70 million of the Platreef Senior Debt on November 6, 2024. The remaining $80 million is available for drawing upon satisfaction of the relevant conditions precedent. The proceeds of the Platreef Senior Debt may be used to, inter alia, finance project costs related to Phase 1 of the Platreef Project.
On August 4, 2023, the Company entered into an $18 million loan agreement with Investec Bank Limited, a South African financial institution, in respect of its aircraft. Interest on the loan is incurred at SOFR + a margin of 3.65% per annum and is payable monthly in arrears. The principal amount is repayable monthly in 60 equal installments. The Company repaid $3.1 million of the principal amount and $1.4 million in interest during the year ended December 31, 2024.
The Company has a mortgage bond outstanding on its offices in London, United Kingdom, of £3.2 million ($4.2 million). The bond is fully repayable on August 28, 2025, secured by the property, and incurs interest at a rate of one month Sterling Overnight Index Average (SONIA) plus 1.90% payable monthly in arrears. Only interest will be payable until maturity.
In 2013, the Company became a party to a loan payable to ITC Platinum Development Limited, which had a carrying value and contractual value of $40 million as at March 31, 2025. The loan is repayable once the Platreef Project has residual cash flow, which is defined in the loan agreement as gross revenue generated by the Platreef Project, less all operating costs attributable thereto, including all mining development and operating costs. The loan incurs interest of term SOFR applicable to United States Dollars on a 3-month deposit plus 2.26%. Interest is not compounded.
The Company has an implied commitment in terms of spending on work programs submitted to regulatory bodies to maintain the good standing of exploration and exploitation permits at its mineral properties. The following table sets forth the Company's long-term obligations:
| Contractual obligations as at March 31, 2025 | Payments Due By Period | ||||||
| Total | Less than 1 year | 1-3 years | 4-5 years | After 5 years | |||
| $'000 | $'000 | $'000 | $'000 | $'000 | |||
| Debt | 1,476,245 | 147,959 | 235,812 | 1,075,061 | 17,413 | ||
| Lease commitments | 824 | 398 | 426 | – | – | ||
| Total contractual obligations | 1,477,069 | 148,357 | 236,238 | 1,075,061 | 17,413 | ||
Debt in the above table represents the senior notes, the senior debt facility, the advance payment facilities, the RMB loan facilities, mortgage bond owing to Citibank, the loan payable to ITC Platinum Development Limited, the loan from FirstBank, the aircraft loan as described above.
NON-GAAP FINANCIAL PERFORMANCE MEASURES
Cash cost (C1) per pound is a non-GAAP financial measure. These are disclosed to enable investors to better understand the performance of Kamoa-Kakula and Kipushi in comparison to other copper and zinc producers respectively who present results on a similar basis.
Cash cost (C1) is prepared on a basis consistent with the industry standard definitions by Wood Mackenzie cost guidelines but are not measures recognized under IFRS Accounting Standards. In calculating the C1 cash cost for Kamoa-Kakula, the costs are measured on the same basis as the company's share of profit from the Kamoa Holding joint venture that is contained in the financial statements. C1 cash cost is used by management to evaluate operating performance and includes all direct mining, processing, and general and administrative costs. Smelter charges and freight deductions on sales to the final port of destination, which are recognized as a component of sales revenues, are added to C1 cash cost to arrive at an approximate cost of finished metal. C1 cash cost and C1 cash cost per pound exclude royalties, production taxes, and non-routine charges as they are not direct production costs.
Reconciliation of Kamoa-Kakula's cost of sales to C1 cash cost, including on a per pound basis:
| Three months ended | ||||||||
| March 31, | ||||||||
| 2025 | 2024 | |||||||
| $'000 | $'000 | |||||||
| Cost of sales | 453,263 | 282,341 | ||||||
| Logistics, treatment, and refining charges | 110,390 | 104,911 | ||||||
| General and administrative expenditure | 34,521 | 47,027 | ||||||
| Royalties and production taxes | (66,244) | (56,400) | ||||||
| Depreciation | (103,619) | (59,511) | ||||||
| Power rebate | (3,769) | (4,468) | ||||||
| Non-cash adjustments to inventory | 60,983 | (1,396) | ||||||
| General and administrative expenditures of other group entities | (686) | (1,540) | ||||||
| Extraordinary taxes | (446) | (21,135) | ||||||
| Cash cost (C1) | 484,393 | 289,829 | ||||||
| Cost of sales per pound of payable copper sold ($ per lb.) | 1.87 | 1.50 | ||||||
| Cash cost (C1) per pound of payable copper produced ($ per lb.) | 1.69 | 1.57 | ||||||
| Payable copper produced in concentrate (tonnes) | 129,730 | 83,945 | ||||||
Figures in the above table are for the Kamoa-Kakula joint venture on a 100% basis.
Reconciliation of Kipushi's cost of sales to C1 cash cost, including on a per pound basis:
| Three months ended | ||||
| March 31, | ||||
| 2025 | 2024 | |||
| $'000 | $'000 | |||
| Cost of sales | 81,771 | – | ||
| Logistics and treatment charges | 3,922 | – | ||
| General and administrative expenditure | 48 | – | ||
| Royalties and production taxes | (9,853) | – | ||
| Depreciation | (13,577) | – | ||
| General and administrative expenditures of other group entities | (844) | – | ||
| C1 cash costs | 61,467 | – | ||
| Cost of sales per pound of payable zinc sold ($ per lb.) | 1.23 | – | ||
| C1 cash costs per pound of payable zinc sold ($ per lb.) | 0.93 | – | ||
| Payable zinc sold in concentrate (tonnes) | 30,108 | – | ||
EBITDA, Adjusted EBITDA and EBITDA margin, normalized profit after tax, and normalized profit per share
EBITDA and Adjusted EBITDA are non-GAAP financial measures. Ivanhoe believes that Kamoa-Kakula’s EBITDA and Kipushi’s EBITDA are valuable indicators of the mine’s respective ability to generate liquidity by producing operating cash flow to fund its working capital needs, service debt obligations, fund capital expenditures and distribute cash to its shareholders. EBITDA and Adjusted EBITDA are also frequently used by investors and analysts for valuation purposes. Kamoa-Kakula’s EBITDA, Kipushi’s EBITDA and the EBITDA and Adjusted EBITDA for the Company are intended to provide additional information to investors and analysts and do not have any standardized definition under IFRS Accounting Standards and should not be considered in isolation or as a substitute for measures of performance prepared per IFRS Accounting Standards. EBITDA and Adjusted EBITDA exclude the impact of cash cost of financing activities and taxes, and the effects of changes in operating working capital balances, and therefore are not necessarily indicative of operating profit or cash flow from operations as determined under IFRS Accounting Standards. Other companies may calculate EBITDA and Adjusted EBITDA differently.
The EBITDA margin is an indicator of Kamoa-Kakula's and Kipushi’s respective overall health and denotes its respective profitability, which is calculated by dividing EBITDA by revenue. The EBITDA margin is intended to provide additional information to investors and analysts, does not have any standardized definition under IFRS Accounting Standards, and should not be considered in isolation, or as a substitute, for measures of performance prepared per IFRS Accounting Standards.
Reconciliation of profit after tax to Kamoa-Kakula's EBITDA:
| Three months ended | ||||
| March 31, | ||||
| 2025 | 2024 | |||
| $'000 | $'000 | |||
| Profit after taxes | 266,420 | 133,160 | ||
| Current and deferred tax expense | 150,166 | 74,631 | ||
| Finance costs | 59,356 | 73,716 | ||
| Depreciation | 108,615 | 62,276 | ||
| Other taxes | 446 | 21,135 | ||
| Unrealized foreign exchange loss | 5,709 | 4,067 | ||
| Finance income | (5,552) | (4,092) | ||
| EBITDA | 585,160 | 364,893 | ||
Figures in the above table are for the Kamoa-Kakula joint venture on a 100% basis.
Reconciliation of loss after tax to Kipushi's EBITDA:
| Three months ended | ||||
| March 31, | ||||
| 2025 | 2024 | |||
| $'000 | $'000 | |||
| Segmented (loss) profit after taxes | (5,083) | 1,088 | ||
| Depreciation and amortization | 13,576 | – | ||
| Finance costs | 6,420 | – | ||
| Current and deferred tax | (4,300) | (1,515) | ||
| Finance income | (612) | (594) | ||
| Unrealized foreign exchange loss | 507 | 989 | ||
| EBITDA | 10,508 | (32) | ||
Reconciliation of profit after tax to Ivanhoe's EBITDA and adjusted EBITDA:
| Three months ended | ||||||||
| March 31, | ||||||||
| 2025 | 2024 | |||||||
| $'000 | $'000 | |||||||
| Profit (loss) after taxes | 122,200 | (69,410) | ||||||
| Finance income | (41,623) | (62,457) | ||||||
| Current and deferred tax recovery | (3,953) | (3,159) | ||||||
| Finance costs | 7,838 | 8,944 | ||||||
| Unrealized foreign exchange loss | 664 | 6,115 | ||||||
| Depreciation | 11,928 | 758 | ||||||
| Amortization of mineral property | 2,306 | – | ||||||
| EBITDA | 99,360 | (119,209) | ||||||
| Share of profit from joint venture net of tax | (107,948) | (45,165) | ||||||
| Company's share of EBITDA from Kamoa-Kakula joint venture(1) | 231,276 | 144,164 | ||||||
| Non-cash share-based payments | 3,667 | 7,340 | ||||||
| Loss on fair valuation of embedded derivative liability | – | 139,271 | ||||||
| Adjusted EBITDA | 226,355 | 126,401 | ||||||
(1) The Company's attributable share of EBITDA from the Kamoa-Kakula joint venture is calculated using the Company's effective shareholding in Kamoa Copper SA (39.6%), Ivanhoe Mines Energy DRC SARL (49.5%), Kamoa Holding Limited (49.5%) and Kamoa Services (Pty) Ltd (49.5%).
This news release should be read in conjunction with Ivanhoe Mines' quarterly Financial Statements and Management's Discussion and Analysis available at www.ivanhoemines.com and www.sedarplus.ca.
Disclosure of technical information
Disclosures of a scientific or technical nature in this release regarding the Kamoa-Kakula Copper Complex and the Kipushi Project, other than stockpiles, have been reviewed and approved by Steve Amos, who is considered, by virtue of his education, experience, and professional association, a Qualified Person under the terms of NI 43-101. Mr. Amos is not considered independent under NI 43-101 as he is Ivanhoe Mines' Executive Vice President, Projects. Mr. Amos has verified the technical data disclosed in this news release.
Disclosures of a scientific or technical nature regarding the stockpiles in this news release have been reviewed and approved by Joshua Chitambala, who is considered, by virtue of his education, experience, and professional association, a Qualified Person under the terms of NI 43-101. Mr. Chitambala is not considered independent under NI 43-101 as he is the Resource Manager for Ivanhoe Mines. Mr. Chitambala has verified the other technical data regarding the surface stockpiles disclosed in this news release.
Disclosures of a scientific or technical nature regarding the Western Forelands Exploration Project in this press release have been reviewed and approved by Tim Williams, who is considered, by virtue of his education, experience, and professional association, a Qualified Person under the terms of NI 43-101. Mr. Williams is not considered independent under NI 43-101 as he is the Vice President, Geosciences, at Ivanhoe Mines. Mr. Williams has verified the technical data regarding the Western Forelands Exploration Project disclosed in this press release.
Ivanhoe has prepared an independent, NI 43-101-compliant technical report for the Kamoa-Kakula Copper Complex, the Platreef Project, and the Kipushi Mine, each of which is available on the company's website and under the company's SEDAR+ profile at www.sedarplus.ca
- Kamoa-Kakula Integrated Development Plan 2023 Technical Report dated March 6, 2023, prepared by OreWin Pty Ltd.; China Nerin Engineering Co. Ltd.; DRA Global; Epoch Resources; Golder Associates Africa; Metso Outotec Oyj; Paterson and Cooke; SRK Consulting Ltd.; and The MSA Group.
- The Kipushi 2022 Feasibility Study dated February 14, 2022, prepared by OreWin Pty Ltd., MSA Group (Pty) Ltd., SRK Consulting (South Africa) (Pty) Ltd, and METC Engineering.
- The Platreef Integrated Development Plan 2025 dated March 31, 2025, prepared by OreWin Pty Ltd., Mine Technical Services, SRK Consulting Inc., DRA Projects (Pty) Ltd, and Golder Associates Africa.
These technical reports include relevant information regarding the effective dates and the assumptions, parameters, and methods of the mineral resource estimates on the Platreef Project, the Kipushi Mine, and the Kamoa-Kakula Copper Complex cited in this press release, as well as information regarding data verification, exploration procedures and other matters relevant to the scientific and technical disclosure contained in this press release in respect of the Platreef Project, Kipushi Mine and Kamoa-Kakula Copper Complex.
Information contact
Follow Robert Friedland (@robert_ivanhoe) and Ivanhoe Mines (@IvanhoeMines_) on Twitter.
Investors
Vancouver: Matthew Keevil +1 604 558 1034
London: Tommy Horton +44 7866 913 207
Media
Tanya Todd +1 604 331 9834
Website www.ivanhoemines.com
Forward-looking statements
Certain statements in this news release constitute "forward-looking statements" or "forward-looking information" within the meaning of applicable securities laws. Such statements and information involve known and unknown risks, uncertainties, and other factors that may cause the actual results, performance, or achievements of the company, its projects, or industry results, to be materially different from any future results, performance, or achievements expressed or implied by such forward-looking statements or information. Such statements can be identified using words such as "may", "would", "could", "will", "intend", "expect", "believe", "plan", "anticipate", "estimate", "scheduled", "forecast", "predict" and other similar terminology, or state that certain actions, events, or results "may", "could", "would", "might" or "will" be taken, occur or be achieved. These statements reflect the company's current expectations regarding future events, performance, and results and speak only as of the date of this release.
Such statements include, without limitation: (i) statements that at current copper prices, cash flow generated from Kamoa-Kakula's operations, as well as joint-venture level financing facilities, will be sufficient to fund the remaining capital cost requirements for the Phase 3 expansion; (ii) statements that completion of Africa's largest and greenest smelter is only a few weeks away and that first production of copper anodes is expected from July 2025, which will lower transportation costs by more than 50% per unit of contained copper while enabling the company to sell by-product sulfuric acid locally to meet rising demand in the DRC's copper industry; (iii) statements that a mineral resource update for Western Forelands is expected by mid-May; (iv) statements that further increases to grid power at Kamoa-Kakula are expected during H2 2025 as the smelter ramps up; (v) statements that Kamoa Copper continues to work closely with the DRC's state-owned power company, SNEL, to deliver solutions for the identified causes of instability experienced across the southern DRC's grid infrastructure and that the project work and is expected to be completed by the end of 2025; (vi) statements that the project consists of grid infrastructure upgrades, such as an increase in grid capacity between the Inga II dam and Kolwezi, a new harmonic filter at the Inga Converter Station, as well as a new static compensator at the Kolwezi Converter Substation; (vii) statements that various smaller initiatives have been identified to strengthen the transmission capability and improve the long-term stability of the southern grid; (viii) statements that Ivanhoe Mines Energy is working with SNEL to put in place maintenance contracts to maintain key generation capacity and transmission infrastructure; (ix) statements that Kamoa-Kakula is expected to receive an initial 71 MW of grid-supplied hydropower, increasing to the Turbine #5 nameplate capacity of 178 MW as the ongoing grid improvement initiatives are completed over the remainder of the year; (x) statements that refurbishment works of Turbine #5 at the Inga II hydroelectric facility is nearing completion, with wet commission expected to commence in H2 2025; (xi) statements that 30,000 tonnes of copper in stockpiles would be stockpiled on-site at the smelter end of the second quarter as a buffer during ramp-up and that once fully-ramped up, the smelter is expected to maintain approximately 17,000 tonnes of copper within the circuit; (xii) statements that the smelter furnace heat-up is expected to commence in Q2 2025; (xiii) statements that underground development of the Kamoa mines is expected to continue until Q4 2025, after which Phase 3 concentrator feed grades are expected to increase to approximately 3% copper; (xiv) statements that construction of two 30 MW solar facilities is expected to start in the third quarter with phased commissioning expected from the second quarter of 2026 and that Kamoa-Kakula plans to further expand the on-site solar facilities over time, targeting a capacity of up to 120 MW, replacing the need for on-site, backup diesel-generated power; (xv) statements that where possible Kamoa-Kakula will continue to toll-treat concentrates domestically, with surplus concentrates smelted at the nearby LCS, located approximately 50 kilometres from Kamoa-Kakula, near the town of Kolwezi; (xvi) statements that subject to sulphide content of the feed concentrate, as a by-product, up to 700,000 tonnes per year of high-strength sulphuric acid will be collected and sold as a by-product; (xvii) statements that Kamoa Copper signed an offtake agreement with Trafigura for the remaining 20% of smelter production; (xviii) statements that Project 95 aims to improve copper recovery rates of the Phase 1 and 2 concentrators from 87% to 95%, unlocking up to 30,000 tonnes per annum of additional copper production; (xix) statements that following the completion of Project 95, the copper grade of the tailings stream from the Phase 1 and 2 concentrators will be significantly reduced from approximately 0.7% to 0.2% copper; (xx) statements that the construction of Project 95 is expected to complete during the first quarter of 2026, and that the construction of Cell 2 is expected to cost approximately $82 million and be construed in parallel with the Project 95 concentrator modifications, with geotechnical engineering on Cell 2 having commenced; (xxi) statements that the estimated capital cost for the modifications to the Phase 1 and 2 concentrator plants is approximately $180 million, including contingency, therefore, the brownfield expansion project is expected to have a capital intensity of approximately $6,000 per tonne of copper produced; (xxii) statements that Kamoa's engineering team is working on an updated 2025 IDP and that completion is expected for Q2 2025; (xxiii) statements that the 2025 IDP will include initiatives targeted at increasing processing recoveries and processing throughput from the Phase 1, 2, and 3 concentrators, as well as a new Phase 4 expansion; (xxiv) statements that Phase 4 expansion involves doubling the size of the milling and flotation circuit adjacent to Phase 3 and that Phase 4 will be fed by ramping up new mining areas on the Kamoa-Kakula complex; (xxv) statements that cash cost guidance of Kamoa-Kakula is based on assumptions including feed grades of processed copper ore, the ramp-up of the Phase 3 concentrator, reliability of DRC grid power supply, the availability and cost of alternative sources of electricity supply, and prevailing logistics rates among other variables; (xxvi) statements that engineering and procurement for the Kipushi debottlenecking program are nearing completion and that the debottlenecking of the Kipushi concentrator is targeting a 20% increase in concentrator processing capacity to 960,000 tonnes of ore per annum and that the debottlenecking program is expected to be completed in Q3 2025; (xxvii) statements that first concentrate at Platreef is expected for the second half of 2025; (xxviii) statements that the Platreef concentrator will be kept on care and maintenance until Q4 2025, as Shaft #1 prioritizes the hoisting of waste development required to bring forward the start of Phase 2; (xxix) statements with respect to the company's exploration budget for 2025 being set at approximately $75 million; (xxx) statements that the 6,000-metre diamond-core drill program at Mokopane Feeder is planned over 4 holes with completion of the program expected by the end of 2025 and with downhole geophysics being conducted concurrently; (xxxi) statements regarding Kipushi's full-year cash cost guidance for 2025 of $0.90/lb. to $1.00/lb. of payable zinc produced, with cash costs expected to steadily improve as the mine achieves nameplate production, and 2025 production guidance of 180,000 to 240,000 tonnes of contained zinc concentrate at Kipushi, with Kipushi targeting a production rate of over 250,000 tonnes of zinc in concentrate for 2026; (xxxii) statements regarding Kamoa-Kakula's 2025 production guidance being set at 520,000 to 580,000 tonnes of copper in concentrate, with Kamoa-Kakula targeting a production rate of approximately 600,000 tonnes of copper in concentrate for 2026; (xxxiii) statements regarding Kipushi's cash cost guidance being based assumptions including feed grades of processed copper ore, reliability of DRC grid power supply the availability and cost of alternative sources of electricity supply and prevailing logistics rates among other variables; (xxxiv) statements regarding the Company's planned capital expenditures for 2025 and 2026; (xxxv) statements regarding targeting and exploration drilling in 2025 at Western Forelands; (xxxvi) statements regarding the results and interpretation of planned passive seismic programs at both Lupemba and Kitoko, with results expected in early 2025; (xxxvii) statements regarding Ivanhoe's commitment to fund $18.7 million exploration activities over an initial two-year period, with earn-in rights to further increase ownership up to 80% over time, in connection with its exploration Joint Venture with UK-based private company Pallas Resources, to explore the Chu-Sarysu Copper Basin in Kazakhstan; (xxxviii) statements regarding Platreef's Phase 2 expansion accelerated by a year to 2027, increasing production to approximately 450 koz of platinum, palladium, rhodium, and gold and its Phase 3 expansion being expected to produce over 1.0 million ounces of platinum, palladium, rhodium, and gold per annum, plus approx. 25,000 tonnes of nickel and 15,000 tonnes of copper; (xxxix) statements regarding first feed of ore into the Platreef Phase 1 concentrator expected in Q4 2025; (xl) statements regarding the 4.1 Mtpa FS, including Phase 1 annual production targets and an increase in total processing capacity to approximately 4.1Mtpa, achieved from a new 3.3-Mtpa Phase 2 concentrator module from Q4 2027; (xli) statements that Phase 1 at Platreef will use both Shaft #1 and Shaft #3 for hoisting ore and waste, with a total combined hoisting capacity of up to 5.0 Mtpa; (xlii) statements that the 4.1 Mtpa FS ranks Platreef as the lowest-cost primary PGM producer; (xliii) statements regarding the initial use of Shaft #1 and Shaft #3 for hoisting ore and waste to feed the Phase 2 concentrator module at Platreef, with Shaft #2 expected to be initially equipped for hoisting labour and materials from 2029; (xliv) statements regarding expansion and incremental capital costs for the 4.1 Mtpa FS and 10.7 Mtpa PEA of $1.2 billion and $803 million respectively; (xlv) statements that the Platreef Phase 3 expansion is expected to consist of two additional 3.3-Mtpa concentrator modules; (xlvi) statements that the Phase 2 expansion of Platreef will be accelerated by re-purposing ventilation Shaft #3 for hoisting and that Shaft #3 will generate additional hoisting capacity of approximately 4 Mtpa, bringing the total hoisting capacity to approximately 5 Mtpa; (xlvii) statements that once equipped Shaft #3 is expected to be ready for hoisting in Q1 2026, well ahead of the completion of the much larger Shaft #2; and (xlviii) statements that the expansion of Shaft #2 to its final diameter of 10 metres will commence in late 2025.
Also, all of the results of the 4.1 Mtpa FS, the 10.7 Mtpa PEA, the Kamoa-Kakula 2023 IDP, the Platreef 2022 feasibility study, and the Kipushi 2022 feasibility study constitute forward-looking statements or information and include future estimates of internal rates of return, net present value, future production, estimates of cash cost, proposed mining plans and methods, mine life estimates, cash flow forecasts, metal recoveries, estimates of capital and operating costs and the size and timing of phased development of the projects.
Furthermore, concerning this specific forward-looking information concerning the operation and development of the Kamoa-Kakula Copper Complex, Platreef Project and Kipushi Mine, and the exploration of the Western Forelands Exploration Project, the Mokopane Feeder Exploration Project and the Chu-Sarya Basin Exploration JV, the company has based its assumptions and analysis on certain factors that are inherently uncertain. Uncertainties include: (i) the adequacy of infrastructure; (ii) geological characteristics; (iii) metallurgical characteristics of the mineralization; (iv) the ability to develop adequate processing capacity; (v) the price of copper, nickel, zinc, platinum, palladium, rhodium and gold; (vi) the availability of equipment and facilities necessary to complete development and exploration; (vii) the cost of consumables and mining and processing equipment; (viii) unforeseen technological and engineering problems; (ix) accidents or acts of sabotage or terrorism; (x) currency fluctuations; (xi) changes in regulations; (xii) the compliance by joint venture partners with terms of agreements; (xiii) the availability and productivity of skilled labour; (xiv) the regulation of the mining industry by various governmental agencies; (xv) the ability to raise sufficient capital to develop such projects; (xvi) changes in project scope or design; (xvii) recoveries, mining rates and grade; (xviii) political factors; (xviii) water inflow into the mine and its potential effect on mining operations; and (xix) the consistency and availability of electric power.
Forward-looking statements and information involve significant risks and uncertainties, should not be read as guarantees of future performance or results, and will not necessarily be accurate indicators of whether such results will be achieved. Many factors could cause actual results to differ materially from the results discussed in the forward-looking statements or information, including, however not limited to, the factors discussed above and under the "Risk Factors" heading in the company's MD&A for the three months ended March 31, 2025, in the company's current annual information form, and elsewhere in this release, as well as unexpected changes in laws, rules or regulations, or their enforcement by applicable authorities; the failure of parties to contracts with the company to perform as agreed; social or labour unrest; changes in commodity prices; and the failure of exploration programs or studies to deliver anticipated results or results that would justify and support continued exploration, studies, development or operations.
Although the forward-looking statements contained in this release are based upon what management of the company believes are reasonable assumptions, the company cannot assure investors that actual results will be consistent with these forward-looking statements. These forward-looking statements are made as of the date of this release and are expressly qualified in their entirety by this cautionary statement. Subject to applicable securities laws, the company does not assume any obligation to update or revise the forward-looking statements contained herein to reflect events or circumstances occurring after the date of this release.
The company's actual results could differ materially from those anticipated in these forward-looking statements as a result of the factors outlined in the "Risk Factors" section in the company's MD&A for the three months ended March 31, 2025, in the company's current annual information and elsewhere in this release.
![]()
To view the source version of this press release, please visit https://www.newsfilecorp.com/release/250287
Source: Ivanhoe Mines Ltd.