Vancouver, British Columbia--(Newsfile Corp. - March 16, 2022) - Hemisphere Energy Corporation (TSXV: HME) (OTCQX: HMENF) ("Hemisphere" or the "Company") is pleased to announce highlights from its independent reserves evaluation (the "Reserve Report"), prepared by McDaniel & Associates Consultants Ltd. ("McDaniel") and effective as at December 31, 2021.
In 2021, Hemisphere invested $12 million in its Atlee Buffalo core area, including drilling seven wells, implementing a polymer flood in the Upper Mannville G oil pool ("G pool"), and upgrading facilities to accommodate additional oil production. With Hemisphere's capital expenditures, corporate production grew by approximately 80% during the year, from 1,340 boe/d in January 2021 to an exit rate of 2,400 boe/d in December 2021. Production has since increased even further to approximately 2,700 boe/d in February 2022 with continued success at Hemisphere's enhanced oil recovery projects. Meanwhile Hemisphere allocated its remaining funds flow to debt repayment, resulting in a 27% reduction in year-end net debt1 to $17.9 million.
Hemisphere's successful drilling program and implementation of the G pool polymer flood was recognized by McDaniel in the Reserve Report, resulting in considerable increases to reserves and reserve values in all categories. Hemisphere's most significant increases came in the Proved Developed Producing ("PDP") category, where the Company achieved an increase in reserve value of 144% to $197 million NPV10 BT, and a 70% increase in reserves when compared to year-end 2020. These outstanding results provide exceptional industry metrics including a 2-year average F&D cost (including changes in FDC) of $4.26/boe, robust recycle ratio of 6.9, and reserve replacement of 553% of 2021 production in the PDP category.
Consistent with the 2020 year-end evaluation, McDaniel's Reserve Report incorporates full corporate abandonment, decommissioning, and reclamation costs ("ADR") in the PDP category. Hemisphere has always been cautious of acquiring additional wellbore and facility liabilities. A direct result of this strategy is that Hemisphere's reserves retain more value per barrel than other companies who must deduct higher ADR from their base valuations to account for their existing liabilities. Current ADR is estimated by management to be $8 million unescalated ($1.9 million NPV10, with costs escalated at 2%/yr), and includes all ADR associated with both active and inactive wells, pipelines, and facilities regardless of whether such wells, pipelines, and facilities had any attributed reserves. Hemisphere stands out among its industry peers as being within the top 7% of Alberta oil and gas operators for its industry-leading 11+ liability management ratio ("LMR"), resulting in Hemisphere having less than 1% of its PDP asset value impaired by ADR.
Hemisphere's low decline, long life, and high value reserves are an indication of the tremendous resources the Company has been developing over the past number of years. These valuable assets are the backbone of Hemisphere and are expected to generate notable free funds flow as they continue to mature and respond to optimization and development of enhanced oil recovery techniques.
2021 Reserve Highlights
Proved Developed Producing ("PDP") Reserves
- NPV10 BT of $197 million, an increase of 144% over year-end 2020.
- Increased reserve volumes by 70% to 7.3 MMboe (99.8% heavy crude oil).
- Replaced 553% of 2021 production through organic development.
- Achieved a two-year average F&D cost of $4.26/boe (including changes in FDC) for a recycle ratio of 6.9.
- RLI of 11 years based on 2021 production.
Proved ("1P") Reserves
- NPV10 BT of $276 million, an increase of 63% over year-end 2020.
- Increased reserve volumes by 2% to 12.0 MMboe (99.9% heavy crude oil).
- Replaced 141% of 2021 production through organic development.
- Achieved a two-year average F&D cost of $6.69/boe (including changes in FDC) for a recycle ratio of 4.4.
- RLI of 18 years based on 2021 production.
- NAV of $2.43 per fully diluted share based on Reserve Report pricing assumptions.
- NAV of $2.90 and $3.68 per fully diluted share based on Reserve Report run internally at McDaniel's pricing sensitivities of $80 and $100 WTI flat pricing.
Proved plus Probable ("2P") Reserves
- NPV10 BT of $351 million, an increase of 66% over year-end 2020.
- Increased reserve volumes by 5% to 15.7 MMboe (99.9% heavy crude oil).
- Replaced 219% of 2021 production through organic development.
- Achieved a two-year average F&D cost of $5.04/boe (including changes in FDC) for a recycle ratio of 5.9.
- RLI of 24 years based on 2021 production.
- NAV of $3.13 per fully diluted share based on Reserve Report pricing assumptions.
- NAV of $3.78 and $4.76 per fully diluted share based on Reserve Report run internally at McDaniel's pricing sensitivities of $80 and $100 WTI flat pricing.
2021 Independent Qualified Reserve Evaluation
The reserves data set forth below is based upon an independent reserves evaluation prepared by McDaniel dated March 8, 2022 with an effective date of December 31, 2021, and is in accordance with definitions, standards, and procedures contained within COGEH and National Instrument 51-101 Standards of Disclosure for Oil and Gas Activities ("NI 51-101"). Additional reserve information as required under NI 51-101 will be included in Hemisphere's Annual Information Form which will be filed on SEDAR on or before April 30, 2022. Due to rounding, certain totals in the columns may not add in the following tables. All dollar values are in Canadian dollars, unless otherwise noted.
Pricing Assumptions
McDaniel's independent evaluation was based on the average of the published price forecasts for McDaniel, GLJ Petroleum Consultants Ltd., and Sproule Associates Ltd. (the "Consultant Average Price Forecast") at January 1, 2022, with the following table detailing pricing and foreign exchange rate assumptions. Hemisphere's corporate production typically averages a discount of approximately $4.00 to WCS pricing. When compared to last year's Consultant Average Price Forecast dated January 1, 2021, the current WCS pricing outlook is up approximately 55% in 2022, 33% in 2023, and 23% thereafter over the next 15-year period, contributing to higher net present values being reported across the board in this year's Reserve Report. Even still, the 2022 Consultant Average Price Forecast uses a 5-year 2022-26 WTI price of US$69.18/bbl and WCS price of Cdn$69.45/bbl, which are significantly lower than actual 2022 market pricing to date and forward strip pricing.
| Consultant Average Price Forecast January 1, 2021 | Consultant Average Price Forecast January 1, 2022 | |||||||||||||
| WTI Crude Oil ($US/bbl) | Edmonton Light Crude Oil ($Cdn/bbl) | Western Canadian Select WCS Crude Oil ($Cdn/bbl) | AECO Spot Price ($Cdn/MM Btu) | Inflation (%) | US/Cdn Exchange Rate ($US/$Cdn) | WTI Crude Oil ($US/bbl) | Edmonton Light Crude Oil ($Cdn/bbl) | Western Canadian Select WCS Crude Oil ($Cdn/bbl) | AECO Spot Price ($Cdn/MM Btu) | Inflation (%) | US/Cdn Exchange Rate ($US/$Cdn) | |||
| 2022 | 50.17 | 59.89 | 48.18 | 2.70 | 1.3 | 0.765 | 2022 | 72.83 | 86.82 | 74.42 | 3.56 | 0 | 0.797 | |
| 2023 | 53.17 | 63.48 | 52.10 | 2.61 | 2 | 0.763 | 2023 | 68.78 | 80.73 | 69.17 | 3.21 | 2.3 | 0.797 | |
| 2024 | 54.97 | 65.76 | 54.10 | 2.65 | 2 | 0.763 | 2024 | 66.76 | 78.01 | 66.54 | 3.05 | 2 | 0.797 | |
| 2025 | 56.07 | 67.13 | 55.19 | 2.70 | 2 | 0.763 | 2025 | 68.09 | 79.57 | 67.87 | 3.11 | 2 | 0.797 | |
| 2026 | 57.19 | 68.53 | 56.29 | 2.76 | 2 | 0.763 | 2026 | 69.45 | 81.16 | 69.23 | 3.17 | 2 | 0.797 | |
| 2027 | 58.34 | 69.95 | 57.42 | 2.81 | 2 | 0.763 | 2027 | 70.84 | 82.78 | 70.61 | 3.23 | 2 | 0.797 | |
| 2028 | 59.50 | 71.40 | 58.57 | 2.87 | 2 | 0.763 | 2028 | 72.26 | 84.44 | 72.02 | 3.30 | 2 | 0.797 | |
| 2029 | 60.69 | 72.88 | 59.74 | 2.92 | 2 | 0.763 | 2029 | 73.70 | 86.13 | 73.46 | 3.36 | 2 | 0.797 | |
| 2030 | 61.91 | 74.34 | 60.93 | 2.98 | 2 | 0.763 | 2030 | 75.18 | 87.85 | 74.69 | 3.43 | 2 | 0.797 | |
| 2031 | 63.15 | 75.83 | 62.15 | 3.04 | 2 | 0.763 | 2031 | 76.68 | 89.61 | 76.19 | 3.50 | 2 | 0.797 | |
| 2032 | 64.41 | 77.34 | 63.40 | 3.10 | 2 | 0.763 | 2032 | 78.21 | 91.40 | 77.71 | 3.57 | 2 | 0.797 | |
| 2033 | 65.70 | 78.89 | 64.66 | 3.16 | 2 | 0.763 | 2033 | 79.78 | 93.23 | 79.27 | 3.64 | 2 | 0.797 | |
| 2034 | 67.01 | 80.47 | 65.96 | 3.23 | 2 | 0.763 | 2034 | 81.37 | 95.09 | 80.85 | 3.71 | 2 | 0.797 | |
| 2035 | 68.35 | 82.08 | 67.28 | 3.29 | 2 | 0.763 | 2035 | 83.00 | 96.99 | 82.47 | 3.79 | 2 | 0.797 | |
| 2036 | 69.72 | 83.72 | 68.63 | 3.36 | 2 | 0.763 | 2036 | 84.66 | 98.93 | 84.12 | 3.86 | 2 | 0.797 | |
Summary of Reserves(1)
| Heavy Oil | Conventional Natural Gas | Total | |||||||
| Reserves Category | (Mbbl) | (MMcf) | (Mboe) | ||||||
| Proved | |||||||||
| Developed Producing | 7,261.2 | 76.1 | 7,273.8 | ||||||
| Developed Non-Producing | 175.8 | 6.4 | 176.9 | ||||||
| Undeveloped | 4,501.0 | - | 4,501.0 | ||||||
| Total Proved | 11,938.1 | 82.4 | 11,951.8 | ||||||
| Probable | 3,753.9 | 35.5 | 3,759.8 | ||||||
| Total Proved plus Probable | 15,691.9 | 117.9 | 15,711.6 |
Notes:
(1) Reserves are presented as "gross reserves" which are the Company's working interest reserves before royalty deductions and without including any royalty interests.
Summary of Net Present Value of Future Net Revenue, Before Tax ("NPV BT") (1)(2)
| NPV BT (M$, except per share amount) | |||||||||
| Discounted at (% per Year) | |||||||||
| Reserves Category | 0% | 5% | 10% | ||||||
| Proved | |||||||||
| Developed Producing | 276,383.1 | 230,823.8 | 196,600.8 | ||||||
| Developed Non-Producing | 5,826.2 | 5,042.7 | 4,450.0 | ||||||
| Undeveloped | 138,315.7 | 100,335.5 | 74,888.5 | ||||||
| Total Proved | 420,525.0 | 336,202.0 | 275,939.4 | ||||||
| Probable | 159,841.4 | 105,461.9 | 75,510.9 | ||||||
| Total Proved plus Probable | 580,366.4 | 441,664.0 | 351,450.3 | ||||||
| Per basic share(3) | |||||||||
| Proved | $ | 4.61 | $ | 3.68 | $ | 3.02 | |||
| Proved plus Probable | $ | 6.36 | $ | 4.84 | $ | 3.85 | |||
Notes:
(1) Based on the average of the published price forecasts for McDaniel, GLJ Petroleum Consultants Ltd., and Sproule Associates Ltd. at January 1, 2022, as outlined in the table herein entitled "Pricing Assumptions".
(2) The net present value of future net revenue does not represent the fair market value of Hemisphere's reserves.
(3) Based on there being 91,289,653 issued and outstanding shares of the Company as of December 31, 2021.
Future Development Costs ("FDC")
The following summarizes the development costs deducted in the estimation of the net present value of the future net revenue attributable to 1P and 2P reserves.
| Forecast Costs (M$) | ||||||
| 1P | 2P | |||||
| 2022 | 7,927 | 7,927 | ||||
| 2023 | 18,814 | 18,814 | ||||
| 2024 | 18,089 | 18,089 | ||||
| 2025 | 1,812 | 4,768 | ||||
| 2026 | 324 | 324 | ||||
| Subsequent years | 800 | 800 | ||||
| Total Undiscounted | 47,765 | 50,721 | ||||
| Total Discounted at 10% | 39,924 | 42,017 | ||||
Finding and Development ("F&D") Costs and Recycle Ratios(1)(2)
| 2021 | 2021 and 2020 2-Year Average | |||||
| PDP | 1P | 2P | PDP | 1P | 2P | |
| Reserve additions, including revisions (Mboe) | 3,670 | 941 | 1,443 | 3,623 | 3,331 | 4,791 |
| Development capital (M$)(4)(5) | 11,169 | 11,169 | 11,169 | 12,225 | 12,225 | 12,225 |
| Total changes in FDC (M$) | 3,541 | 8,966 | 8,511 | 3,222 | 10,043 | 11,969 |
| Total F&D Capital, including changes in FDC (M$) | 14,710 | 20,135 | 19,681 | 15,448 | 22,268 | 24,195 |
| F&D costs(3), including changes in FDC ($/boe) | 4.01 | 21.50 | 13.53 | 4.26 | 6.69 | 5.04 |
| Recycle Ratio(6) | 8.9 | 1.7 | 2.6 | 6.9 | 4.4 | 5.9 |
Notes:
(1) All financial information included in this news release is per Hemisphere's preliminary unaudited financial statements for the year ended December 31, 2021, which have not yet been approved by the Company's audit committee or board of directors and therefore represents management's estimates. Readers are advised that these financial estimates may be subject to change as a result of the completion of the independent audit on Hemisphere's financial statements for the year ended December 31, 2021, and the review and approval of same with the Company's audit committee and board of directors.
(2) See "Oil and Gas Advisories" and "Oil and Gas Metrics".
(3) F&D costs are calculated as the sum of exploration and development capital plus the change in future development capital for the period divided by the change in reserves that are characterized as development for the period. Finding and development costs take into account reserves revisions during the year on a per boe basis, 2021 production of 1,816 boe/d, and 2020 production of 1,706 boe/d.
(4) The aggregate of the exploration and development costs incurred in the financial year and change during that year in estimated future development costs generally will not reflect total finding and development costs related to reserve additions for that year.
(5) The capital expenditures also exclude capitalized administration costs.
(6) Recycle ratio is calculated as Operating netback divided by F&D costs. Operating netback is a non-IFRS measure that does not have any standardized meaning under IFRS and therefore may not be comparable to similar measures presented by other entities. Refer to the section "Non-IFRS and Other Specified Financial Measures". The Company's estimated Operating netback in 2021 was $35.51/boe (unaudited) and the combined two-year average for 2021 and 2020 was $29.57/boe (unaudited).
Reserve Life Index ("RLI")
| As at December 31 | ||
| 2021(1) | 2020(2) | |
| PDP | 11.0 | 6.9 |
| 1P | 18.0 | 18.8 |
| 2P | 23.7 | 24.0 |
Notes:
(1) Calculated as the applicable reserves volume divided by Hemisphere's average 2021 production of 1,816 boe/d.
(2) Calculated as the applicable reserves volume divided by Hemisphere's average 2020 production of 1,706 boe/d.
Net Asset Value ("NAV")(1)
| (MM$ except share amounts) | As at December 31, 2021 | ||
| Consultant Average Price Forecast | $80 WTI | $100 WTI | |
| 1P NPV10 BT(2) | 276 | 327 | 423 |
| 2P NPV10 BT(2) | 352 | 412 | 529 |
| Undeveloped Land and Seismic(3) | 1.4 | ||
| Proceeds from Warrants and Stock Options | 5.7 | ||
| Net Debt(4) | (17.9) | ||
| Million Shares Outstanding (fully diluted) | 109 | ||
| 1P NAV per share (fully diluted) | $2.43 | $2.90 | $3.78 |
| 2P NAV per share (fully diluted) | $3.13 | $3.68 | $4.76 |
Notes:
(1) Calculated using the respective net present values of 1P and 2P reserves, before tax and discounted at 10%, plus internally valued undeveloped land & seismic and proceeds from warrants and stock options, less net debt(4), and divided by fully diluted outstanding shares. Net present values are shown at various price forecasts including the Consultant Average Price Forecasts used in the McDaniel Reserve Report, as well as sensitivities run internally at McDaniel's flat WTI price forecasts of US$80 and US$100 WTI paired with US$16.54 and US$19.84 WCS differentials respectively, and 0.8 USD/CAD FX.
(2) 100% of existing and future corporate ADR has been included in the McDaniel Reserve Report. Total corporate ADR accounted for in the 2021 reserve report amounts to $2.5 million and $2.4 million NPV10 BT in each of the 1P and 2P categories, respectively.
(3) Based on an internal evaluation by management of Hemisphere as of December 31, 2021, with an average value of $50 per acre for 17,289 undeveloped net acres, and $0.55 million for seismic.
(4) Net debt is a non-GAAP measure that does not have any standardized meaning under IFRS and therefore may not be comparable to similar measures presented by other entities. Refer to the section "Non-GAAP and Other Specified Financial Measures". All financial information as at December 31, 2021 is per Hemisphere's preliminary unaudited financial statements for the year ended December 31, 2021, which has not yet been approved by the Company's audit committee or board of directors and therefore represents management's estimates. Readers are advised that these financial estimates may be subject to changes as a result of the completion of the independent audit on Hemisphere's financial statements for the year ended December 31, 2021, and the review and approval of same with the Company's audit committee and board of directors.
About Hemisphere Energy Corporation
Hemisphere is a Canadian oil company focused on sustainable growth of its high netback, low decline conventional heavy oil assets through water and polymer flood enhanced recovery methods. Hemisphere trades on the TSX Venture Exchange as a Tier 1 issuer under the symbol "HME" and on the OTCQB Venture Marketplace under the symbol "HMENF".
For further information, please visit the Company's website at www.hemisphereenergy.ca to view its corporate presentation or contact:
Don Simmons, President & Chief Executive Officer
Telephone: (604) 685-9255
Email: info@hemisphereenergy.ca
Definitions and Abbreviations
| bbl | barrel | $US | United States dollar |
| Mbbl | thousands of barrels | $Cdn | Canadian dollar |
| MMbbl | millions of barrels | M$ | thousand dollars |
| boe | barrel of oil equivalent | MM | million |
| boe/d | barrel of oil equivalent per day | NPV BT | Net Present Value of future net revenue, before tax |
| Mboe | thousands of barrels of oil equivalent | NPV10 BT | NPV BT, discounted at 10% |
| MMboe | millions of barrels of oil equivalent | FX | Foreign Exchange |
| MMcf | million cubic feet | FDC | Future Development Costs |
| MMbtu | million British Thermal Unit | F&D Cost | Finding and Development Costs |
| AECO | Alberta Energy Company | NAV | Net Asset Value |
| WCS | Western Canadian Select | RLI | Reserve Life Index |
| WTI | West Texas Intermediate |
Forward-looking Statements
This news release contains certain forward-looking information and statements within the meaning of applicable securities laws. The use of any of the words "expect", "anticipate", "continue", "estimate", "may", "will", "project", "should", "believe", "plans", "intends" and similar expressions are intended to identify forward-looking information or statements. In particular, but without limiting the foregoing, this news release contains forward-looking information and statements pertaining to the following: the Company's expectations that its assets are expected to generate notable free funds flow as they continue to mature and respond to optimization and development of enhanced oil recovery techniques; the volumes of Hemisphere's oil and gas reserves and the estimated net present values of the future net revenues of such reserves; and the Company's anticipated filing date for its annual information form for the year ending December 31, 2021. In addition, statements relating to "reserves" are deemed to be forward-looking statements, as they involve the implied assessment, based on certain estimates and assumptions, that the reserves described can be profitably produced in the future.
The estimates of Hemisphere's reserves and the recovery factors provided herein are estimates only and there is no guarantee that the estimated reserves will be recovered. In addition, forward-looking statements or information are based on a number of material factors, expectations or assumptions of Hemisphere which have been used to develop such statements and information, but which may prove to be incorrect. Although Hemisphere believes that the expectations reflected in such forward-looking statements or information are reasonable, undue reliance should not be placed on forward-looking statements because Hemisphere can give no assurance that such expectations will prove to be correct. In addition to other factors and assumptions which may be identified herein, assumptions have been made regarding, among other things: that Hemisphere will continue to conduct its operations in a manner consistent with past operations; results from drilling and development activities are consistent with past operations; the quality of the reservoirs in which Hemisphere operates and continued performance from existing wells; the continued and timely development of infrastructure in areas of new production; the accuracy of the estimates of Hemisphere's reserve volumes; certain commodity price and other cost assumptions; continued availability of debt and equity financing and cash flow to fund Hemisphere's current and future plans and expenditures; the impact of increasing competition; the general stability of the economic and political environment in which Hemisphere operates; the impact of COVID-19 on the Company's operations and demand for oil and natural gas; the general continuance of current industry conditions; the timely receipt of any required regulatory approvals; the ability of Hemisphere to obtain qualified staff, equipment and services in a timely and cost efficient manner; drilling results; the ability of the operator of the projects in which Hemisphere has an interest in to operate the field in a safe, efficient and effective manner; the ability of Hemisphere to obtain financing on acceptable terms; field production rates and decline rates; the ability to replace and expand oil and natural gas reserves through acquisition, development and exploration; the timing and cost of pipeline, storage and facility construction and expansion and the ability of Hemisphere to secure adequate product transportation; future commodity prices; currency, exchange and interest rates; regulatory framework regarding royalties, taxes and environmental matters in the jurisdictions in which Hemisphere operates; and the ability of Hemisphere to successfully market its oil and natural gas products.
The forward-looking information and statements included in this news release are not guarantees of future performance and should not be unduly relied upon. Such information and statements, including the assumptions made in respect thereof, involve known and unknown risks, uncertainties and other factors that may cause actual results or events to defer materially from those anticipated in such forward-looking information or statements including, without limitation: changes in commodity prices; changes to, or restrictions of, labour, supplies, and infrastructure as a result of COVID-19; changes in the demand for or supply of Hemisphere's products, the early stage of development of some of the evaluated areas and zones; unanticipated operating results or production declines; changes in tax or environmental laws, royalty rates or other regulatory matters; changes in development plans of Hemisphere or by third party operators of Hemisphere's properties, increased debt levels or debt service requirements; inaccurate estimation of Hemisphere's oil and gas reserve volumes; limited, unfavourable or a lack of access to capital markets; increased costs; a lack of adequate insurance coverage; the impact of competitors; and certain other risks detailed from time-to-time in Hemisphere's public disclosure documents, (including, without limitation, those risks identified in this news release and in Hemisphere's annual information form).
The forward-looking information and statements contained in this news release speak only as of the date of this news release, and Hemisphere does not assume any obligation to publicly update or revise any of the included forward-looking statements or information, whether as a result of new information, future events or otherwise, except as may be required by applicable securities laws.
Oil and Gas Advisories
All reserve references in this news release are "gross" or "Company interest reserves". Such reserves are the Company's total working interest reserves before the deduction of any royalties and without including any royalty interests of the Company.
It should not be assumed that the net present value of the estimated net revenues presented in this news release represent the fair market value of the reserves. There is no assurance that the forecast prices and costs assumptions will be attained, and variances could be material. The recovery and reserve estimates of Hemisphere's crude oil, natural gas liquids and natural gas reserves provided herein are estimates only and there is no guarantee that the estimated reserves will be recovered. Actual crude oil, natural gas and natural gas liquids reserves may be greater than or less than the estimates provided herein.
All future net revenues are estimated using forecast prices, arising from the anticipated development and production of our reserves, net of the associated royalties, operating costs, development costs and abandonment and reclamation costs and are stated prior to provision for interest and general and administrative expenses. Future net revenues have been presented in this news release on a before tax basis.
"Boe" means barrel of oil equivalent on the basis of 6 mcf of natural gas to 1 bbl of oil. Boe's may be misleading, particularly if used in isolation. A boe conversion ratio of 6 mcf: 1 bbl is based on an energy equivalency conversion method primarily applicable at the burner tip and does not represent a value equivalency at the wellhead. In addition, given that the value ratio based on the current price of crude oil as compared to natural gas is significantly different from the energy equivalency of 6:1, utilizing a conversion on a 6:1 basis may be misleading as an indication of value.
Oil and Gas Metrics
This news release contains metrics commonly used in the oil and natural gas industry, such as finding and development ("F&D") costs, "recycle ratio", "operating netback" and "reserve life index ("RLI")". These terms do not have a standardized meaning and the Company's calculation of such metrics may not be comparable to the calculation method used or presented by other companies for the same or similar metrics, and therefore should not be used to make such comparisons.
"Finding and development costs" or "F&D costs" are calculated as the sum of development capital plus the change in future development capital ("FDC") for the period divided by the change in reserves that are characterized as development for the period. Finding and development costs take into account reserves revisions during the year on a per boe basis. The aggregate of the exploration and development costs incurred in the financial year and changes during that year in estimated future development costs generally will not reflect total finding and development costs related to reserves additions for that year. Management uses F&D costs as a measure of capital efficiency for organic reserves development.
"Development capital" means the aggregate exploration and development costs incurred in the financial year on reserves that are categorized as development. Development capital excludes capitalized administration costs.
"Recycle ratio" is calculated as the operating netback divided by the F&D cost per boe for the year. Operating netback is a non-IFRS financial measure (refer to the section "Non-IFRS and Other Specified Financial Measures"). Management uses recycle ratio to relate the cost of adding reserves to the expected cash flows to be generated.
"Reserve life index" is calculated as total company interest reserves divided by annual production, for the year indicated.
Management uses these oil and gas metrics for its own performance measurements and to provide shareholders with measures to compare the Company's operations over time. Readers are cautioned that the information provided by these metrics, or that can be derived from the metrics presented in this news release, should not be relied upon for investment or other purposes.
Financial Information
All financial information included in this news release is per Hemisphere's preliminary unaudited financial statements for the year ended December 31, 2021, which have not yet been approved by the Company's audit committee or board of directors and therefore represents management's estimates. Readers are advised that these financial estimates may be subject to change as a result of the completion of the independent audit on Hemisphere's financial statements for the year ended December 31, 2021, and the review and approval of same with the Company's audit committee and board of directors. All amounts are expressed in Canadian dollars unless otherwise noted.
Non-IFRS and Other Specified Financial Measures
Certain measures commonly used in the oil and natural gas industry referred to herein, including "Net debt" and "Operating netback", do not have standardized meanings prescribed by IFRS and therefore may not be comparable with the calculation of similar measures by other companies. These non-IFRS measures are further described and defined below. Investors are cautioned that these measures should not be construed as alternatives to or more meaningful than the most directly comparable IFRS measures as indicators of Hemisphere's performance. Set forth below are descriptions of the non-IFRS financial measures used in this press release.
"Net debt" is closely monitored by the Company to ensure that its capital structure is maintained by a strong balance sheet to fund the future growth of the Company. Net debt is used in this document in the context of liquidity and is calculated as the total of the Company's bank debt plus current assets, less current liabilities, excluding the fair value of financial instruments, lease and warrant liabilities. Net debt is reconciled to bank debt, which is the most directly comparable IFRS measure.
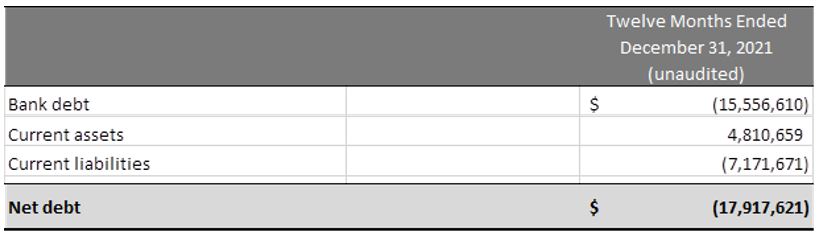
Net Debt Table
To view an enhanced version of this graphic, please visit:
https://orders.newsfilecorp.com/files/3810/116948_hmetable1.jpg
"Operating netback" is a benchmark used in the oil and natural gas industry and a key indicator of profitability relative to current commodity prices. It is calculated as Operating field netback plus realized commodity hedging gains (losses). "Operating field netback" is calculated as oil and gas sales, less royalties, operating expenses, and transportation costs on an absolute and per barrel of oil equivalent basis. Operating netback per boe and Operating field netback per boe are calculated by dividing the respective terms by the applicable barrels of oil equivalent of production. A reconciliation of Operating netback and Operating field netback per boe to the most directly comparable measure calculated and presented in accordance with IFRS is as follows:

Operating Netback Table
To view an enhanced version of this graphic, please visit:
https://orders.newsfilecorp.com/files/3810/116948_hmetable2.jpg
The Company has provided additional information on how these measures are calculated in the Management's Discussion and analysis for the year ended December 31, 2020 and for the three and nine month period ended September 30, 2021, which are available under the Company's SEDAR profile at www.sedar.com.
Neither the TSX Venture Exchange nor its Regulation Services Provider (as that term is defined in the policies of the TSX Venture Exchange) accepts responsibility for the adequacy or accuracy of this news release.
1 Net debt is a non-IFRS measure that does not have any standardized meaning under IFRS and therefore may not be comparable to similar measures presented by other entities. Refer to the section "Non-IFRS and Other Specified Financial Measures"
![]()
To view the source version of this press release, please visit https://www.newsfilecorp.com/release/116948
Source: Hemisphere Energy Corporation