
HIGHLIGHTS:
The changes from the previous Preliminary Economic Assessment issued in December 2025 ("Previous PEA") include:
an upgrade in the tungsten mineral resource from inferred to measured and indicated ("M & I") mineral resources,
updated capital and operating costs, and
a change in the tungsten recovery methodology from gravity to flotation concentration.
350% increase in annual tungsten production from the Previous PEA. The use of flotation instead of gravity as the recovery method, significantly improves overall tungsten recoveries and concentrate grades.
Pre-tax net present value ("NPV") of $2.15 billion1, 2, an Internal Rate of Return ("IRR") of 44% and an after-tax NPV of $1.23 billion and IRR of 33% at an 8% discount rate compared to an after-tax NPV of $1.03 billion and an IRR of 32% in the Previous PEA.
Average cash cost of $12.75 per kilogram ("kg") or $5.78 per pound ("lb") or US$4.25 per lb of molybdenum ("Mo") and All-In Sustaining Cost ("AISC") of $13.08 per kg or $5.93 per lb or US$4.36 per lb of Mo, net of copper ("Cu") and tungsten ("W") production credits compared to AISC of $10.03 or US$7.65 per pound Mo in the Previous PEA.
1.5-year payback compared to 2.3 years in the Previous PEA.
As an illustrative scenario3 to the base case above, and assuming average metal prices and CA:US exchange rate for September 2026, the Davidson Project has an after-tax NPV of $3.0 billion, an IRR of 57% at an 8% discount rate, payback of 0.8 years, and AISC of $-7.00 per lb or US$-5.00 per pound of Mo.
20-year mine life based on 10,000 tonnes of mill throughput per day or 3.65 million tonnes per year;
Initial capital cost of $750.1 million including $118.5 million of contingency;
Annual average production of 6,020,000 kg or 13,270,000 lbs of Mo; 679,600 kg or 1,498,500 lbs of Cu and 686 tonnes or 1,513,000 lbs of W03;
Underground mine using primarily battery powered mining equipment to minimise carbon emission;
Underground processing facilities and paste backfilling to minimise surface footprint;
A M & I mineral resource of 80,756,000 tonnes grading 0.304% MoS2 (0.182% Mo) and 0.037% Cu and 0.036% WO3 at a cut-off grade of 0.22% MoS2; and
Life-of-mine direct income and mining taxes of $2.29 billion.
(1) All dollar amounts are stated in Canadian Dollars unless otherwise stated.
(2) Assumes long-term metal prices of US$51.60. per kg or US$23.41 per lb of Mo; US$10.25 per kg or US $4.65 per lb. of Cu and US$953 per metric tonne unit ("MTU") or US$43.25 per lb of WO3; and a CA:US dollar exchange rate of $0.74.
(3) The illustrative scenario assumes average September 2026 spot metal prices of US $33.50/lb Mo., $6.50/lb Cu and US $3,000/MTU Wo.
Toronto, Ontario--(Newsfile Corp. - October 22, 2026) - Moon River Moly Ltd. (TSXV: MOO) (OTCQB: MRIVF) ("Moon River" or the "Company") is pleased to announce that an updated preliminary economic assessment ("PEA") has been completed on the Davidson Molybdenum-Copper-Tungsten- Critical Minerals Project (the "Project" or "Davidson Project") located near Smithers, British Columbia.
Paul Parisotto, President and Chief Executive Officer, says of the updated PEA results: "We are very pleased with an over 23% increase in the after-tax NPV and the decrease in the payback period to 1.5 years. It is our intention to progress the Davidson Project to a Pre-Feasibility Study in the first half of 2027."
Ian McDonald, Chairman, went on to state: "A key contributor to the improved economics in the updated PEA is the 350% increase in tungsten recovery reflecting the use of flotation instead of gravity as the recovery method. This improvement in tungsten recovery helped lower the AISC to produce one pound of molybdenum to US$4.36 per pound, net of co-product metal credits.
"The very low AISC, coupled with the potential to extend the mine life and a location in a mining-friendly jurisdiction, demonstrates that the Davidson Project is a highly prospective undeveloped molybdenum, copper and tungsten project.1
"The Davidson Project complements our nearby 25% owned Endako Project(1) that generates an after-tax NPV at 8% of $790 million, an IRR of 40% as per our November 2025 PEA. We estimate that Endako could be in production in approximately 24 to 30 months from the time a production decision is made."
The updated PEA was prepared by A-Z Mining Professionals Ltd. ("AMPL") for Moon River. The Project, located in west central British Columbia, is approximately nine kilometres ("km") northwest of the town of Smithers. On November 15, 2023, Moon River acquired all of the rights, interests and obligations of Generation Mining Ltd. under a vending agreement dated April 1, 2016, as amended, entered into with Roda Holdings Inc. and Mr. Donald Davidson, thus granting Moon River the exclusive right to access, prospect, develop and mine the Davidson Project and to acquire 100% of the Davidson Project. The Project comprises development of an underground mine with potentially economic mineralisation processed in an underground, on-site processing facility, with an estimated minimum 20-year mine life.
PROJECT DESIGN
The Davidson Project is located inside Hudson Bay Mountain and does not outcrop on surface. The deposit has an existing portal on the east side of the mountain and over 2,100 metres ("m") of exploration drifting. The access road and portal can be seen from the town of Smithers. The proposed underground mine access and surface facilities will be located on the west side of the mountain (out of sight of the town of Smithers) with the existing eastern portal used only for initial development.
To minimise the surface footprint of the whole operation, the processing plant will be located underground in specially designed and excavated openings above the top elevation of the mining zones. This eliminates having to move mineralized material from the underground to a surface processing plant 8 km away. This also eliminates the need for a source of backfill material from surface. The mill tailings will provide a ready source of material for backfilling mined areas and significantly reduces the size of the tailings management facility on surface. Additionally, the incorporation of dry stacked tailings eliminates the need for a traditional wet tailings facility.
The mine will utilise rubber-tired, battery-powered and automated mining equipment wherever possible to minimise manpower requirements, underground ventilation volumes, mine air heating costs, and CO2 emissions.
Surface infrastructure required would include:
- Upgrading of access road
- Powerline construction
- Electrical substations and distribution
- Site roads and materials handling area
- Maintenance shop/offices/dry/warehouse complex (temporary)
- Two cement storage silos
- Water supply system and water treatment plant
- Dry stack tailings dewatering plant and impoundment area
- Development waste storage
- Landfill site
- Sewage disposal site
The mine will employ 256 persons when in full operation. There is a history of mining in the region and many skilled workers in the area currently work from Smithers, which has a population of 5,400 people and many support services.
MINE PLAN
Underground mining methods will be utilised to extract the potentially economic mineralisation of the deposit. An underground internal ramp from the bottom to the top of the mining zone will access mining areas and the underground processing plant facility. In total, some 37,000 m of pre-production development will be required to bring the deposit into production.
The mining method to be employed would be Longhole Open Stoping with cemented paste (densified tailings) backfill to maximise recovery of potentially economic mineralisation. Dilution of 5% has been included in the mined potentially economic mineralisation at a grade of 0.20% MoS2.
The mineralized zone is large and irregular in shape, with higher grade concentrations towards the centre of the mineralized zones being mined. The mine would produce 10,000 tonnes per day of potentially economic mineralisation. The mineralized zone geometry is highly amenable to bulk mining of large tonnage stopes with inherent economies of scale and low mining costs. The stopes will be approximately 160,000 tonnes each.
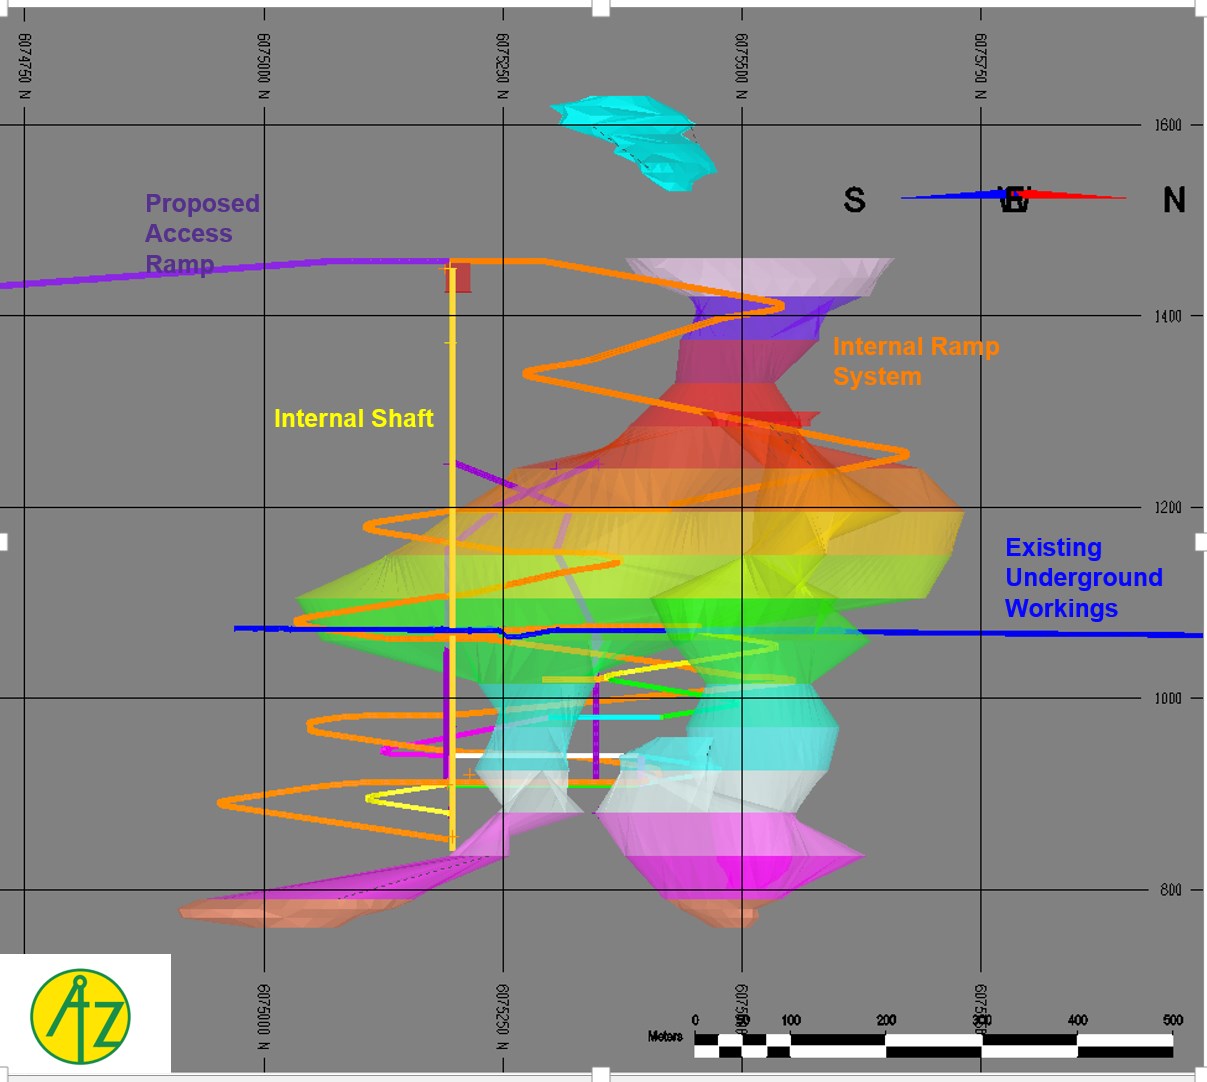
Figure 1 Underground Mine Design
To view an enhanced version of this graphic, please visit:
https://images.newsfilecorp.com/files/7009/320318_4477c282b49f0a37_001full.jpg
Potentially economic mineralisation removed from stopes by load-haul-dump (LHD) units will be sent by ore passes to jaw crushers at the bottom of the mine, to a coarse ore bin and then to secondary and tertiary cone crushers below the coarse ore bin. The crushed potentially economic mineralisation will be conveyed to a vertical lift conveyor system which feeds the fine ore bin connected to the underground processing facility.
Other underground facilities will include:
- Paste backfill plant
- Equipment maintenance shops and underground warehouses
- Explosives storage magazines
- Refuge stations
- Fuel bays
- Materials storage areas
- Main dewatering sumps
- Offices
- Warehousing facilities
PROCESSING
The processing plant, located completely underground, will be a conventional flotation plant producing molybdenum, copper and tungsten concentrates for shipment to smelters.
The potentially economic mineralisation from the fine ore bin will feed two grinding lines, each consisting of one rod mill, one ball mill, and a set of cyclones for classification. Each grinding line cyclone overflow stream will feed a dedicated molybdenum rougher flotation line using tank cells, with rougher concentrate advancing to molybdenum cleaning and tails continuing to pyrite flotation.
Molybdenum rougher concentrate will be reground in a stirred mill, then cleaned in a circuit using four stages of column flotation. The molybdenum final concentrate stream will be thickened, filtered, dried, and packaged for shipment to a smelter while first cleaner tails molybdenum values will be scavenged in tank cells.
Byproduct copper will be recovered from the molybdenum cleaner scavenger flotation tails stream using tank cells for copper rougher flotation and a column cell for cleaning. Copper rougher tails will report to the final tailings thickener, while copper concentrate will be thickened and filtered prior to shipment to a smelter.
Pyrite flotation will be used to prepare molybdenum rougher flotation tails for tungsten recovery, with flotation occurring in tank cells. The pyrite flotation concentrate will report to the final tails thickener, while the remaining desulphurised tailings will feed conditioners ahead of tungsten flotation. After conditioning, the slurry will advance to rougher flotation, with tungsten rougher tails reporting to the final tails thickener and the rougher concentrate advancing to cleaner flotation. Cleaner flotation will be done in four stages, with the first stage using tank cells and the latter three stages using trough cells. Tungsten final concentrate will be thickened, filtered and packaged for shipment to a refinery.
The tailings thickener underflow will be primarily made into paste backfill for backfilling of stopes, with the balance pumped to a dry stack tailings facility on surface. At the dry stack tailings facility, the tailings will be filtered for water removal, with the filter product being stacked in a near dry form for permanent storage and the water removed being either returned underground for re-use in the processing plant or being forwarded to a water treatment plant in preparation for return to the environment.
The processing plant is expected to have recovery rates of greater than 94% molybdenum, 52% copper and 53% tungsten.
The proposed processing plant will be arranged to fit in two long rooms. In the main room, the grinding mills will be located at one end, with grinding cyclone overflow gravitating to molybdenum rougher flotation and subsequently through pyrite flotation and tungsten rougher flotation. The tungsten cleaner flotation and concentrate dewatering circuits will be situated alongside the tungsten rougher flotation cells in the main room, while the molybdenum cleaner flotation and concentrate dewatering along with the byproduct copper circuit will be arranged in the second room. The second room will also be used for staging of the three flotation concentrates for periodic transport to surface in preparation for final shipment. The construction cost of an underground plant is not significantly different from that for a plant located on surface.
The processing (metallurgical) test work, operating costs and capital costs were all completed by Mr. Cameron Lilly, P. Eng. and a qualified person. This test work was peer reviewed by Mr. John Eggert, P. Eng. and a qualified person. Mr. Eggert found no issues with any of this test work. Mr. Eggert is unaware of any known legal, political, environmental, or other risks that could materially affect the processing (metallurgical) test work, operating costs and capital costs.
MINERAL RESOURCES
The data used to generate the resource calculation was reviewed and approved by F. Bakker, P.Geo. This included site visits by Mr. Bakker from July 30, 2024, to August 26, 2024 and from June 26 to July 4, 2026. Sampling methods, QAQC programs and databases were examined. In addition, during the 2024 visit, he supervised a diamond drill program that was used to gather metallurgical samples. Mr. Bakker is of the opinion that the accuracy of the data was sufficient for a mineral resource statement.
The mineral resource was calculated utilizing commercial 3D Block Modelling Software (HxGN Mine Plantm 3D). For the current mineral resource estimate, a mineralized solid was constructed around a roughly designed and manually constrained 0.1% MoS2 grade shell to constrain the estimate. In addition, the model utilized geostatistics (variograms) to better confine the mineralized limits. This resource model was used for determining the mineral resources estimate and to undertake an underground mine production plan.
The effective date of the mineral resource is October 22, 2026, the date of this news release. Mr. Bakker is unaware of any known legal, political, environmental, or other risks that could materially affect the potential development of mineral resources or mineral reserves.
Inferred mineral resources were not included in the PEA economic analysis. Only Measured and Indicated Resources were used in the mine plan and economic analysis. Mineral resources that are not mineral reserves do not have demonstrated economic viability. The PEA is preliminary in nature and there is no certainty that the PEA will be realized.
The following tables present the mineral resource estimate for the Davidson Project at various cut-off grades.
The mineral resource estimate has been recalculated to include both copper and tungsten values for the Davidson Project and is included in the updated PEA.
| Table 1: Measured Resources for MoS2, Copper and WO3 | |||||||||
| Category | Cut-off | Tonnes | Grade | Grade | Grade | Grade | Contained | Contained | Contained |
| Grade | % MoS2 | % Mo | %Cu | % WO3 | Mo (Kg) | Cu (Kg) | WO3 (Kg) | ||
| % MoS2 | |||||||||
| Measured | >0.100 | 128,457,000 | 0.203 | 0.122 | 0.036 | 0.032 | 156,354,000 | 46,630,000 | 41,235,000 |
| Measured | >0.110 | 118,655,000 | 0.211 | 0.127 | 0.037 | 0.033 | 150,180,000 | 43,546,000 | 38,682,000 |
| Measured | >0.120 | 107,899,000 | 0.221 | 0.132 | 0.037 | 0.033 | 142,836,000 | 40,138,000 | 35,715,000 |
| Measured | >0.130 | 97,680,000 | 0.231 | 0.138 | 0.038 | 0.034 | 135,217,000 | 36,923,000 | 32,820,000 |
| Measured | >0.140 | 88,115,000 | 0.242 | 0.145 | 0.039 | 0.034 | 127,519,000 | 33,924,000 | 30,047,000 |
| Measured | >0.150 | 79,982,000 | 0.251 | 0.151 | 0.039 | 0.035 | 120,444,000 | 31,193,000 | 27,674,000 |
| Measured | >0.160 | 72,442,000 | 0.262 | 0.157 | 0.039 | 0.035 | 113,472,000 | 28,470,000 | 25,355,000 |
| Measured | >0.170 | 65,205,000 | 0.272 | 0.163 | 0.040 | 0.035 | 106,354,000 | 25,821,000 | 23,083,000 |
| Measured | >0.180 | 58,803,000 | 0.283 | 0.170 | 0.040 | 0.036 | 99,681,000 | 23,462,000 | 20,993,000 |
| Measured | >0.190 | 53,103,000 | 0.294 | 0.176 | 0.040 | 0.036 | 93,390,000 | 21,294,000 | 19,117,000 |
| Measured | >0.200 | 47,928,000 | 0.304 | 0.182 | 0.040 | 0.036 | 87,361,000 | 19,315,000 | 17,446,000 |
| Measured | >0.210 | 42,771,000 | 0.316 | 0.189 | 0.041 | 0.037 | 81,036,000 | 17,322,000 | 15,782,000 |
| Measured | >0.220 | 38,418,000 | 0.328 | 0.196 | 0.041 | 0.037 | 75,458,000 | 15,559,000 | 14,330,000 |
| Measured | >0.230 | 34,406,000 | 0.340 | 0.204 | 0.041 | 0.038 | 70,051,000 | 13,969,000 | 12,937,000 |
| Measured | >0.240 | 30,973,000 | 0.352 | 0.211 | 0.041 | 0.038 | 65,232,000 | 12,606,000 | 11,770,000 |
| Measured | >0.250 | 27,866,000 | 0.364 | 0.218 | 0.041 | 0.039 | 60,691,000 | 11,369,000 | 10,728,000 |
| Measured | >0.260 | 25,079,000 | 0.376 | 0.225 | 0.041 | 0.039 | 56,439,000 | 10,232,000 | 9,731,000 |
| Measured | >0.270 | 22,584,000 | 0.388 | 0.232 | 0.041 | 0.039 | 52,488,000 | 9,192,000 | 8,830,000 |
| Measured | >0.280 | 20,417,000 | 0.400 | 0.240 | 0.041 | 0.039 | 48,931,000 | 8,310,000 | 8,024,000 |
| Measured | >0.209 | 18,456,000 | 0.412 | 0.247 | 0.041 | 0.039 | 45,591,000 | 7,512,000 | 7,272,000 |
| Measured | >0.300 | 16,786,000 | 0.424 | 0.254 | 0.041 | 0.040 | 42,642,000 | 6,798,000 | 6,647,000 |
| Measured | >0.310 | 15,242,000 | 0.436 | 0.261 | 0.040 | 0.040 | 39,825,000 | 6,143,000 | 6,036,000 |
| Measured | >0.320 | 13,869,000 | 0.448 | 0.269 | 0.040 | 0.040 | 37,243,000 | 5,575,000 | 5,506,000 |
| 1. Mineral Resources were estimated using the CIM Standards on Mineral Resources and Reserves, Definitions and Guidelines prepared by the CIM Standing Committee on Reserve Definitions and adopted by the CIM Council. | |||||||||
| 2. Mineral Resources that are not Mineral Reserves do not have demonstrated economic viability. | |||||||||
| 3. The PEA mine plan and economic model include numerous assumptions, but use only Indicated and Measured Resources. | |||||||||
| 4. The estimate of Mineral Resources may be materially affected by environmental, permitting, legal, marketing, or other relevant issues. | |||||||||
| 5. The approximate 3-year trailing average (to September 30, 2026) metal price for molybdenum of US$51.60 per kg or US$23.41 (rounded down) per lb, US$953.15 per MTU or US$43.25 per pound WO3, and US$10.25 per kg or US$4.65 per pound Cu was used in estimating the Mineral Resources and a CA$:US$ exchange rate of $1.36 was used. | |||||||||
| 6. A description of the key assumptions, parameters, and methods used to estimate the resources, and any known risks, as well as the data verification processes, will be contained in this Technical Report. | |||||||||
| Table 2: Indicated Resources for MoS2, Copper and WO3 | |||||||||
| Category | Cut-off | Tonnes | Grade | Grade | Grade | Grade | Contained | Contained | Contained |
| Grade | % MoS2 | % Mo | %Cu | % WO3 | Mo (Kg) | Cu (Kg) | WO3 (Kg) | ||
| % MoS2 | |||||||||
| Indicated | >0.100 | 360,595,000 | 0.159 | 0.095 | 0.028 | 0.026 | 343,434,000 | 102,048,000 | 92,673,000 |
| Indicated | >0.110 | 317,987,000 | 0.166 | 0.100 | 0.029 | 0.026 | 316,568,000 | 90,626,000 | 83,313,000 |
| Indicated | >0.120 | 270,065,000 | 0.176 | 0.105 | 0.029 | 0.027 | 283,904,000 | 79,129,000 | 72,647,000 |
| Indicated | >0.130 | 229,447,000 | 0.185 | 0.111 | 0.030 | 0.028 | 253,574,000 | 68,146,000 | 63,327,000 |
| Indicated | >0.140 | 192,639,000 | 0.194 | 0.116 | 0.030 | 0.028 | 223,858,000 | 58,177,000 | 54,709,000 |
| Indicated | >0.150 | 158,417,000 | 0.205 | 0.123 | 0.031 | 0.029 | 194,338,000 | 48,476,000 | 46,258,000 |
| Indicated | >0.160 | 130,259,000 | 0.216 | 0.129 | 0.031 | 0.030 | 168,300,000 | 40,250,000 | 39,078,000 |
| Indicated | >0.170 | 107,639,000 | 0.227 | 0.136 | 0.031 | 0.031 | 146,038,000 | 33,691,000 | 33,045,000 |
| Indicated | >0.180 | 88,553,000 | 0.238 | 0.142 | 0.031 | 0.032 | 126,084,000 | 27,806,000 | 28,071,000 |
| Indicated | >0.190 | 72,355,000 | 0.250 | 0.150 | 0.032 | 0.033 | 108,222,000 | 23,009,000 | 23,660,000 |
| Indicated | >0.200 | 60,443,000 | 0.261 | 0.156 | 0.032 | 0.033 | 94,351,000 | 19,281,000 | 20,007,000 |
| Indicated | >0.210 | 50,863,000 | 0.271 | 0.162 | 0.032 | 0.034 | 82,626,000 | 16,429,000 | 17,090,000 |
| Indicated | >0.220 | 42,338,000 | 0.283 | 0.169 | 0.033 | 0.034 | 71,694,000 | 13,929,000 | 14,522,000 |
| Indicated | >0.230 | 35,902,000 | 0.293 | 0.176 | 0.033 | 0.035 | 63,032,000 | 11,884,000 | 12,386,000 |
| Indicated | >0.240 | 30,579,000 | 0.303 | 0.182 | 0.033 | 0.035 | 55,573,000 | 9,938,000 | 10,672,000 |
| Indicated | >0.250 | 26,202,000 | 0.313 | 0.188 | 0.032 | 0.035 | 49,172,000 | 8,463,000 | 9,197,000 |
| Indicated | >0.260 | 22,474,000 | 0.323 | 0.193 | 0.032 | 0.035 | 43,482,000 | 7,192,000 | 7,888,000 |
| Indicated | >0.270 | 18,572,000 | 0.335 | 0.201 | 0.033 | 0.035 | 37,301,000 | 6,073,000 | 6,500,000 |
| Indicated | >0.280 | 15,548,000 | 0.347 | 0.208 | 0.033 | 0.035 | 32,326,000 | 5,177,000 | 5,473,000 |
| Indicated | >0.209 | 12,867,000 | 0.360 | 0.216 | 0.035 | 0.035 | 27,762,000 | 4,452,000 | 4,439,000 |
| Indicated | >0.300 | 10,932,000 | 0.372 | 0.223 | 0.035 | 0.035 | 24,353,000 | 3,837,000 | 3,870,000 |
| Indicated | >0.310 | 9,292,000 | 0.384 | 0.230 | 0.035 | 0.035 | 21,362,000 | 3,289,000 | 3,280,000 |
| Indicated | >0.320 | 8,123,000 | 0.394 | 0.236 | 0.036 | 0.036 | 19,161,000 | 2,884,000 | 2,908,000 |
| 1. Mineral Resources were estimated using the CIM Standards on Mineral Resources and Reserves, Definitions and Guidelines prepared by the CIM Standing Committee on Reserve Definitions and adopted by the CIM Council. | |||||||||
| 2. Mineral Resources that are not Mineral Reserves do not have demonstrated economic viability. | |||||||||
| 3. The PEA mine plan and economic model include numerous assumptions, but use only Indicated and Measured Resources. | |||||||||
| 4. The estimate of Mineral Resources may be materially affected by environmental, permitting, legal, marketing, or other relevant issues. | |||||||||
| 5. The approximate 3-year trailing average (to September 30, 2026) metal price for molybdenum of US$51.60 per kg or US$23.41 (rounded down) per lb, US$953.15 per MTU or US$43.25 per pound WO3, and US$10.25 per kg or US$4.65 per pound Cu was used in estimating the Mineral Resources and a CA$:US$ exchange rate of $1.36 was used. | |||||||||
| 6. A description of the key assumptions, parameters, and methods used to estimate the resources, and any known risks, as well as the data verification processes, will be contained in this Technical Report. | |||||||||
| Table 3: Measured and Indicated Resources for MoS2, Copper and WO3 | |||||||||
| Category | Cut-off | Tonnes | Grade | Grade | Grade | Grade | Contained | Contained | Contained |
| Grade | % MoS2 | % Mo | %Cu | %WO3 | Mo (Kg) | Cu (Kg) | WO3 (Kg) | ||
| % MoS2 | |||||||||
| Measured and Indicated | >0.100 | 489,053,000 | 0.171 | 0.102 | 0.030 | 0.027 | 499,789,000 | 148,679,000 | 133,908,000 |
| Measured and Indicated | >0.110 | 436,642,000 | 0.178 | 0.107 | 0.031 | 0.028 | 466,748,000 | 134,173,000 | 121,994,000 |
| Measured and Indicated | >0.120 | 377,964,000 | 0.188 | 0.113 | 0.032 | 0.029 | 426,740,000 | 119,267,000 | 108,362,000 |
| Measured and Indicated | >0.130 | 327,127,000 | 0.198 | 0.119 | 0.032 | 0.029 | 388,792,000 | 105,069,000 | 96,148,000 |
| Measured and Indicated | >0.140 | 280,754,000 | 0.209 | 0.125 | 0.033 | 0.030 | 351,377,000 | 92,101,000 | 84,757,000 |
| Measured and Indicated | >0.150 | 238,399,000 | 0.220 | 0.132 | 0.033 | 0.031 | 314,782,000 | 79,669,000 | 73,932,000 |
| Measured and Indicated | >0.160 | 202,701,000 | 0.232 | 0.139 | 0.034 | 0.032 | 281,772,000 | 68,720,000 | 64,432,000 |
| Measured and Indicated | >0.170 | 172,844,000 | 0.244 | 0.146 | 0.034 | 0.032 | 252,392,000 | 59,512,000 | 56,128,000 |
| Measured and Indicated | >0.180 | 147,356,000 | 0.256 | 0.153 | 0.035 | 0.033 | 225,765,000 | 51,268,000 | 49,064,000 |
| Measured and Indicated | >0.190 | 125,459,000 | 0.268 | 0.161 | 0.035 | 0.034 | 201,614,000 | 44,304,000 | 42,778,000 |
| Measured and Indicated | >0.200 | 108,371,000 | 0.280 | 0.168 | 0.036 | 0.035 | 181,712,000 | 38,596,000 | 37,452,000 |
| Measured and Indicated | >0.210 | 93,634,000 | 0.292 | 0.175 | 0.036 | 0.035 | 163,662,000 | 33,751,000 | 32,872,000 |
| Measured and Indicated | >0.220 | 80,756,000 | 0.304 | 0.182 | 0.037 | 0.036 | 147,152,000 | 29,489,000 | 28,852,000 |
| Measured and Indicated | >0.230 | 70,308,000 | 0.316 | 0.189 | 0.037 | 0.036 | 133,083,000 | 25,852,000 | 25,323,000 |
| Measured and Indicated | >0.240 | 61,552,000 | 0.328 | 0.196 | 0.037 | 0.036 | 120,805,000 | 22,544,000 | 22,442,000 |
| Measured and Indicated | >0.250 | 54,068,000 | 0.339 | 0.203 | 0.037 | 0.037 | 109,864,000 | 19,833,000 | 19,925,000 |
| Measured and Indicated | >0.260 | 47,554,000 | 0.351 | 0.210 | 0.037 | 0.037 | 99,923,000 | 17,424,000 | 17,619,000 |
| Measured and Indicated | >0.270 | 41,156,000 | 0.364 | 0.218 | 0.037 | 0.037 | 89,789,000 | 15,265,000 | 15,331,000 |
| Measured and Indicated | >0.280 | 35,965,000 | 0.377 | 0.226 | 0.038 | 0.038 | 81,258,000 | 13,487,000 | 13,497,000 |
| Measured and Indicated | >0.209 | 31,323,000 | 0.391 | 0.234 | 0.038 | 0.037 | 73,353,000 | 11,964,000 | 11,711,000 |
| Measured and Indicated | >0.300 | 27,718,000 | 0.404 | 0.242 | 0.038 | 0.038 | 66,996,000 | 10,635,000 | 10,517,000 |
| Measured and Indicated | >0.310 | 24,534,000 | 0.416 | 0.249 | 0.038 | 0.038 | 61,187,000 | 9,432,000 | 9,316,000 |
| Measured and Indicated | >0.320 | 21,992,000 | 0.428 | 0.256 | 0.038 | 0.038 | 56,404,000 | 8,459,000 | 8,414,000 |
| 1. Mineral Resources were estimated using the CIM Standards on Mineral Resources and Reserves, Definitions and Guidelines prepared by the CIM Standing Committee on Reserve Definitions and adopted by the CIM Council. | |||||||||
| 2. Mineral Resources that are not Mineral Reserves do not have demonstrated economic viability. | |||||||||
| 3. The PEA mine plan and economic model include numerous assumptions, but use only Indicated and Measured Resources. | |||||||||
| 4. The estimate of Mineral Resources may be materially affected by environmental, permitting, legal, marketing, or other relevant issues. | |||||||||
| 5. The approximate 3-year trailing average (to September 30, 2026) metal price for molybdenum of US$51.60 per kg or US$23.41 (rounded down) per lb, US$953.15 per MTU or US$43.25 per pound WO3, and US$10.25 per kg or US$4.65 per pound Cu was used in estimating the Mineral Resources and a CA$:US$ exchange rate of $1.36 was used. | |||||||||
| 6. A description of the key assumptions, parameters, and methods used to estimate the resources, and any known risks, as well as the data verification processes, will be contained in this Technical Report. | |||||||||
| Table 4: Inferred Resources for MoS2, Copper and WO3 | |||||||||
| Category | Cut-off | Tonnes | Grade | Grade | Grade | Grade | Contained | Contained | Contained |
| Grade | %MoS2 | % Mo | %Cu | % WO3 | Mo (Kg) | Cu (Kg) | WO3 (Kg) | ||
| % MoS2 | |||||||||
| Inferred | >0.100 | 29,114,000 | 0.150 | 0.090 | 0.021 | 0.023 | 26,229,000 | 6,201,000 | 6,696,000 |
| Inferred | >0.110 | 24,995,000 | 0.158 | 0.095 | 0.020 | 0.025 | 23,656,000 | 5,099,000 | 6,124,000 |
| Inferred | >0.120 | 20,359,000 | 0.168 | 0.101 | 0.020 | 0.026 | 20,475,000 | 4,113,000 | 5,314,000 |
| Inferred | >0.130 | 16,734,000 | 0.177 | 0.106 | 0.020 | 0.028 | 17,772,000 | 3,280,000 | 4,702,000 |
| Inferred | >0.140 | 14,233,000 | 0.185 | 0.111 | 0.019 | 0.030 | 15,772,000 | 2,747,000 | 4,241,000 |
| Inferred | >0.150 | 11,574,000 | 0.194 | 0.116 | 0.019 | 0.033 | 13,470,000 | 2,199,000 | 3,808,000 |
| Inferred | >0.160 | 9,094,000 | 0.205 | 0.123 | 0.018 | 0.037 | 11,178,000 | 1,601,000 | 3,328,000 |
| Inferred | >0.170 | 7,257,000 | 0.216 | 0.129 | 0.017 | 0.040 | 9,372,000 | 1,248,000 | 2,888,000 |
| Inferred | >0.180 | 6,059,000 | 0.224 | 0.134 | 0.015 | 0.043 | 8,119,000 | 933,000 | 2,593,000 |
| Inferred | >0.190 | 4,873,000 | 0.233 | 0.140 | 0.014 | 0.044 | 6,813,000 | 687,000 | 2,130,000 |
| Inferred | >0.200 | 3,494,000 | 0.248 | 0.149 | 0.013 | 0.042 | 5,199,000 | 440,000 | 1,474,000 |
| Inferred | >0.210 | 2,861,000 | 0.258 | 0.155 | 0.013 | 0.040 | 4,427,000 | 378,000 | 1,156,000 |
| Inferred | >0.220 | 2,444,000 | 0.266 | 0.159 | 0.013 | 0.040 | 3,890,000 | 320,000 | 987,000 |
| Inferred | >0.230 | 2,037,000 | 0.274 | 0.164 | 0.014 | 0.040 | 3,338,000 | 287,000 | 805,000 |
| Inferred | >0.240 | 1,725,000 | 0.281 | 0.168 | 0.014 | 0.038 | 2,907,000 | 248,000 | 662,000 |
| Inferred | >0.250 | 1,591,000 | 0.285 | 0.170 | 0.013 | 0.039 | 2,711,000 | 213,000 | 619,000 |
| Inferred | >0.260 | 1,447,000 | 0.287 | 0.172 | 0.013 | 0.039 | 2,490,000 | 187,000 | 566,000 |
| Inferred | >0.270 | 1,072,000 | 0.295 | 0.177 | 0.014 | 0.038 | 1,896,000 | 154,000 | 410,000 |
| Inferred | >0.280 | 477,000 | 0.321 | 0.192 | 0.018 | 0.037 | 917,000 | 85,000 | 176,000 |
| Inferred | >0.209 | 357,000 | 0.334 | 0.200 | 0.016 | 0.038 | 714,000 | 56,000 | 135,000 |
| Inferred | >0.300 | 246,000 | 0.352 | 0.211 | 0.022 | 0.032 | 519,000 | 54,000 | 80,000 |
| Inferred | >0.310 | 190,000 | 0.366 | 0.219 | 0.025 | 0.032 | 417,000 | 47,000 | 62,000 |
| Inferred | >0.320 | 180,000 | 0.369 | 0.221 | 0.024 | 0.033 | 398,000 | 43,000 | 59,000 |
| 1. Mineral Resources were estimated using the CIM Standards on Mineral Resources and Reserves, Definitions and Guidelines prepared by the CIM Standing Committee on Reserve Definitions and adopted by the CIM Council. | |||||||||
| 2. Mineral Resources that are not Mineral Reserves do not have demonstrated economic viability. | |||||||||
| 3. The PEA mine plan and economic model include numerous assumptions, but use only Indicated and Measured Resources. | |||||||||
| 4. The estimate of Mineral Resources may be materially affected by environmental, permitting, legal, marketing, or other relevant issues. | |||||||||
| 5. The approximate 3-year trailing average (to September 30, 2026) metal price for molybdenum of US$51.60 per kg or US$23.41 (rounded down) per lb, US$953.15 per MTU or US$43.25 per pound WO3, and US$10.25 per kg or US$4.65 per pound Cu was used in estimating the Mineral Resources and a CA$:US$ exchange rate of $1.36 was used. | |||||||||
| 6. A description of the key assumptions, parameters, and methods used to estimate the resources, and any known risks, as well as the data verification processes, will be contained in the Technical Report. | |||||||||
CAPITAL EXPENDITURES
The estimated Project total pre-production capital expenditure, inclusive of contingencies and working capital, is approximately $750 million. A summary of Project pre-production capital expenditures is presented in the following table.
Table 5: Pre-Production Capital
| TOTAL PROJECT CAPITAL EXPENDITURE ESTIMATES ($000) | |||||
| Component | Year -3 | Year -2 | Year -1 | Year 1 | Total |
| Exploration | $1,000 | $1,000 | $1,000 | $3,000 | |
| Mine | $45,304 | $58,445 | $62,798 | $41,473 | $208,019 |
| Equipment Leasing | $11,725 | $11,495 | $11,264 | $34,485 | |
| Underground Infrastructure | $6,811 | $2,716 | $32,936 | $30,461 | $72,924 |
| Processing Plant | $70,000 | $94,523 | $35,000 | $199,523 | |
| Surface Infrastructure & Mobile Equipment | $22,448 | $2,555 | $18,213 | $43,216 | |
| Tailings Management Facilities | $9,150 | $9,150 | |||
| Owner's Costs | $6,747 | $6,747 | $6,747 | $2,000 | $22,241 |
| Contingency | $18,807 | $30,591 | $47,326 | $21,787 | $118,512 |
| Working Capital | $29,018 | $29,018 | |||
| Mine Closure | $10,000 | $10,000 | |||
| Total Capital Expenditures | $112,842 | $183,548 | $293,958 | $159,739 | $750,088 |
OPERATING COSTS
The estimated total average operating cost (excluding smelting and refining) for the mine is approximately $50.14 per tonne of potentially economic mineralisation. This equates to $26.49 per kg of Mo ($12.02 per lb). The following table presents a summary of life of mine average operating costs per tonne.
Table 6: Life of Mine Average Operating Costs
| Life of Mine Average Operating Costs | |
| Component | Cost |
| Diamond Drilling - Infill | $0.50 |
| Underground Mining | $24.28 |
| Equipment Leasing | $2.18 |
| Processing | $18.14 |
| Tailings Management Facility | $1.48 |
| Mine Indirects | $0.88 |
| Surface Department | $0.61 |
| General & Administration | $2.05 |
| Total Minesite Operating Cost | $50.14 |
ECONOMIC ANALYSIS
The expected cash flow estimates are calculated using the forecast mine plan, operating costs, and capital expenditures incorporating expected long-term metal prices based on the three-year trailing average for molybdenum on the London Metals Exchange of US$51.60 per kg or US$23.41 per pound of Mo, US$10.25 or US$4.65 per pound of Cu and US $953 per MTU or US$43.25 per pound of W and a CA:US dollar exchange rate of $0.74.
A summary of the expected parameters used for the financial analysis is presented below.
Parameters Used in Financial Analysis
| Cashflow Model Input Parameters | |||
| Parameter | |||
| Longterm Metal Price ($US) | $51.60 | ($23.41 /lb) | |
| Exchange Rate | $1.36 $Can per $1 US | ||
| Diluted Mineral Resource | 72,074,709 | tonnes | |
| Dilution (at adjacent mineral grade) | 5% | ||
| Average Head Grade to Mill | 0.30% | ||
| Mill Recovery | 94% | ||
| Payability | 97% | ||
| Pre-Production Capital | $750.10 | million | |
| Total Sustaining Capital | $45.90 | million | |
| Working Capital | $29.00 | million | |
| Reclamation and Closure | $10.00 | million | |
| Estimated Operating Costs ($/tonne) | $50.14 | ||
| Life of Project | 20 Years | ||
The overall level of accuracy of this study is approximately ±30%.
The Project's expected investment and returns based on the base case cashflow parameters are shown below.
| Base Case: Expected Project Returns | |||||||
| PRE-TAX | AFTER-TAX | ||||||
| NPV | 5% | $3,057 | billion | NPV | 5% | $1,796 | billion |
| 8% | $2,153 | billion | 8% | $1,235 | billion | ||
| 10% | $1,723 | billion | 10% | $968 | billion | ||
| IRR | 44% | IRR | 33% | ||||
| Payback Period | 1.5 Years | All In Sustaining Cost | $Can 5.93 | $US 4.36 | |||
The Project's expected investment and returns based on the Illustrative case cashflow parameters are shown below.
| Illustrative Case Expected Project Returns | |||||||
| PRE-TAX | AFTER-TAX | ||||||
| NPV | 5% | $7,016 | billion | NPV | 5% | $4,253 | billion |
| 8% | $5,049 | billion | 8% | $3,036 | billion | ||
| 10% | $4,113 | billion | 10% | $2,458 | billion | ||
| IRR | 72% | IRR | 57% | ||||
| Payback Period | 0.8 Years | All In Sustaining Cost | $Can -7.02 | $US -5.01 | |||
SENSITIVITY ANALYSIS
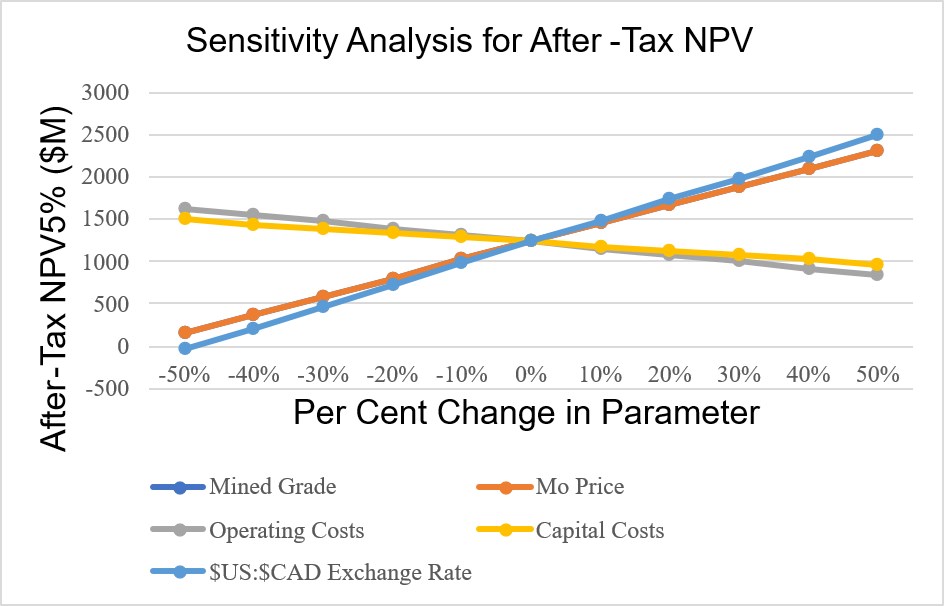
Sensitivity analyses were performed for capital expenditures, operating costs, mined grades, metal prices and currency exchange rates using 50% positive and negative variations. The Project is most sensitive to the mined grade, metal price and the exchange rate and less sensitive to capital and operating costs. The results of the sensitivity analysis for positive and negative changes of 10% in key Project parameters are presented in the following tables and graphs.
| Sensitivity Analysis for After-Tax NPV @ 8% | |||||||||||||||||||||||
| Parameter | After-Tax NPV ($M) | ||||||||||||||||||||||
| -50% | -40% | -30% | -20% | -10% | 0% | 10% | 20% | 30% | 40% | 50% | |||||||||||||
| Mined Grade | 156 | 363 | 584 | 804 | 1,022 | 1,235 | 1,448 | 1,661 | 1,875 | 2,088 | 2,302 | ||||||||||||
| Mo Price | 156 | 363 | 584 | 804 | 1,022 | 1,235 | 1,448 | 1,661 | 1,875 | 2,088 | 2,302 | ||||||||||||
| Operating Costs | 1,628 | 1,549 | 1,471 | 1,392 | 1,314 | 1,235 | 1,156 | 1,078 | 999 | 917 | 836 | ||||||||||||
| Capital Costs | 1,494 | 1,442 | 1,390 | 1,338 | 1,287 | 1,235 | 1,183 | 1,131 | 1,079 | 1,024 | 969 | ||||||||||||
| $US:$CAD Exchange Rate | -32 | 209 | 468 | 727 | 984 | 1,235 | 1,486 | 1,737 | 1,987 | 2,238 | 2,490 | ||||||||||||
Note: The lines for Grade, Metal Price and Exchange Rate are virtually the same and overlay each other.
To view an enhanced version of this graphic, please visit:
https://images.newsfilecorp.com/files/7009/320318_4477c282b49f0a37_011full.jpg
| Sensitivity Analysis for After-Tax IRR @ 8% | ||||||||||||||||||||||
| Parameter | After-Tax IRR (%) | |||||||||||||||||||||
| -50% | -40% | -30% | -20% | -10% | 0% | 10% | 20% | 30% | 40% | 50% | ||||||||||||
| Mined Grade | 12 | 17 | 21 | 25 | 29 | 33 | 37 | 40 | 43 | 46 | 49 | |||||||||||
| Mo Price | 12 | 17 | 21 | 25 | 29 | 33 | 37 | 40 | 43 | 46 | 49 | |||||||||||
| Operating Costs | 39 | 38 | 37 | 35 | 34 | 33 | 32 | 31 | 29 | 28 | 27 | |||||||||||
| Capital Costs | 59 | 51 | 45 | 40 | 36 | 33 | 30 | 28 | 26 | 24 | 22 | |||||||||||
| $US:$CAD Exchange Rate | 7 | 13 | 19 | 24 | 29 | 33 | 37 | 41 | 44 | 48 | 51 | |||||||||||
Sensitivity Analysis IRR
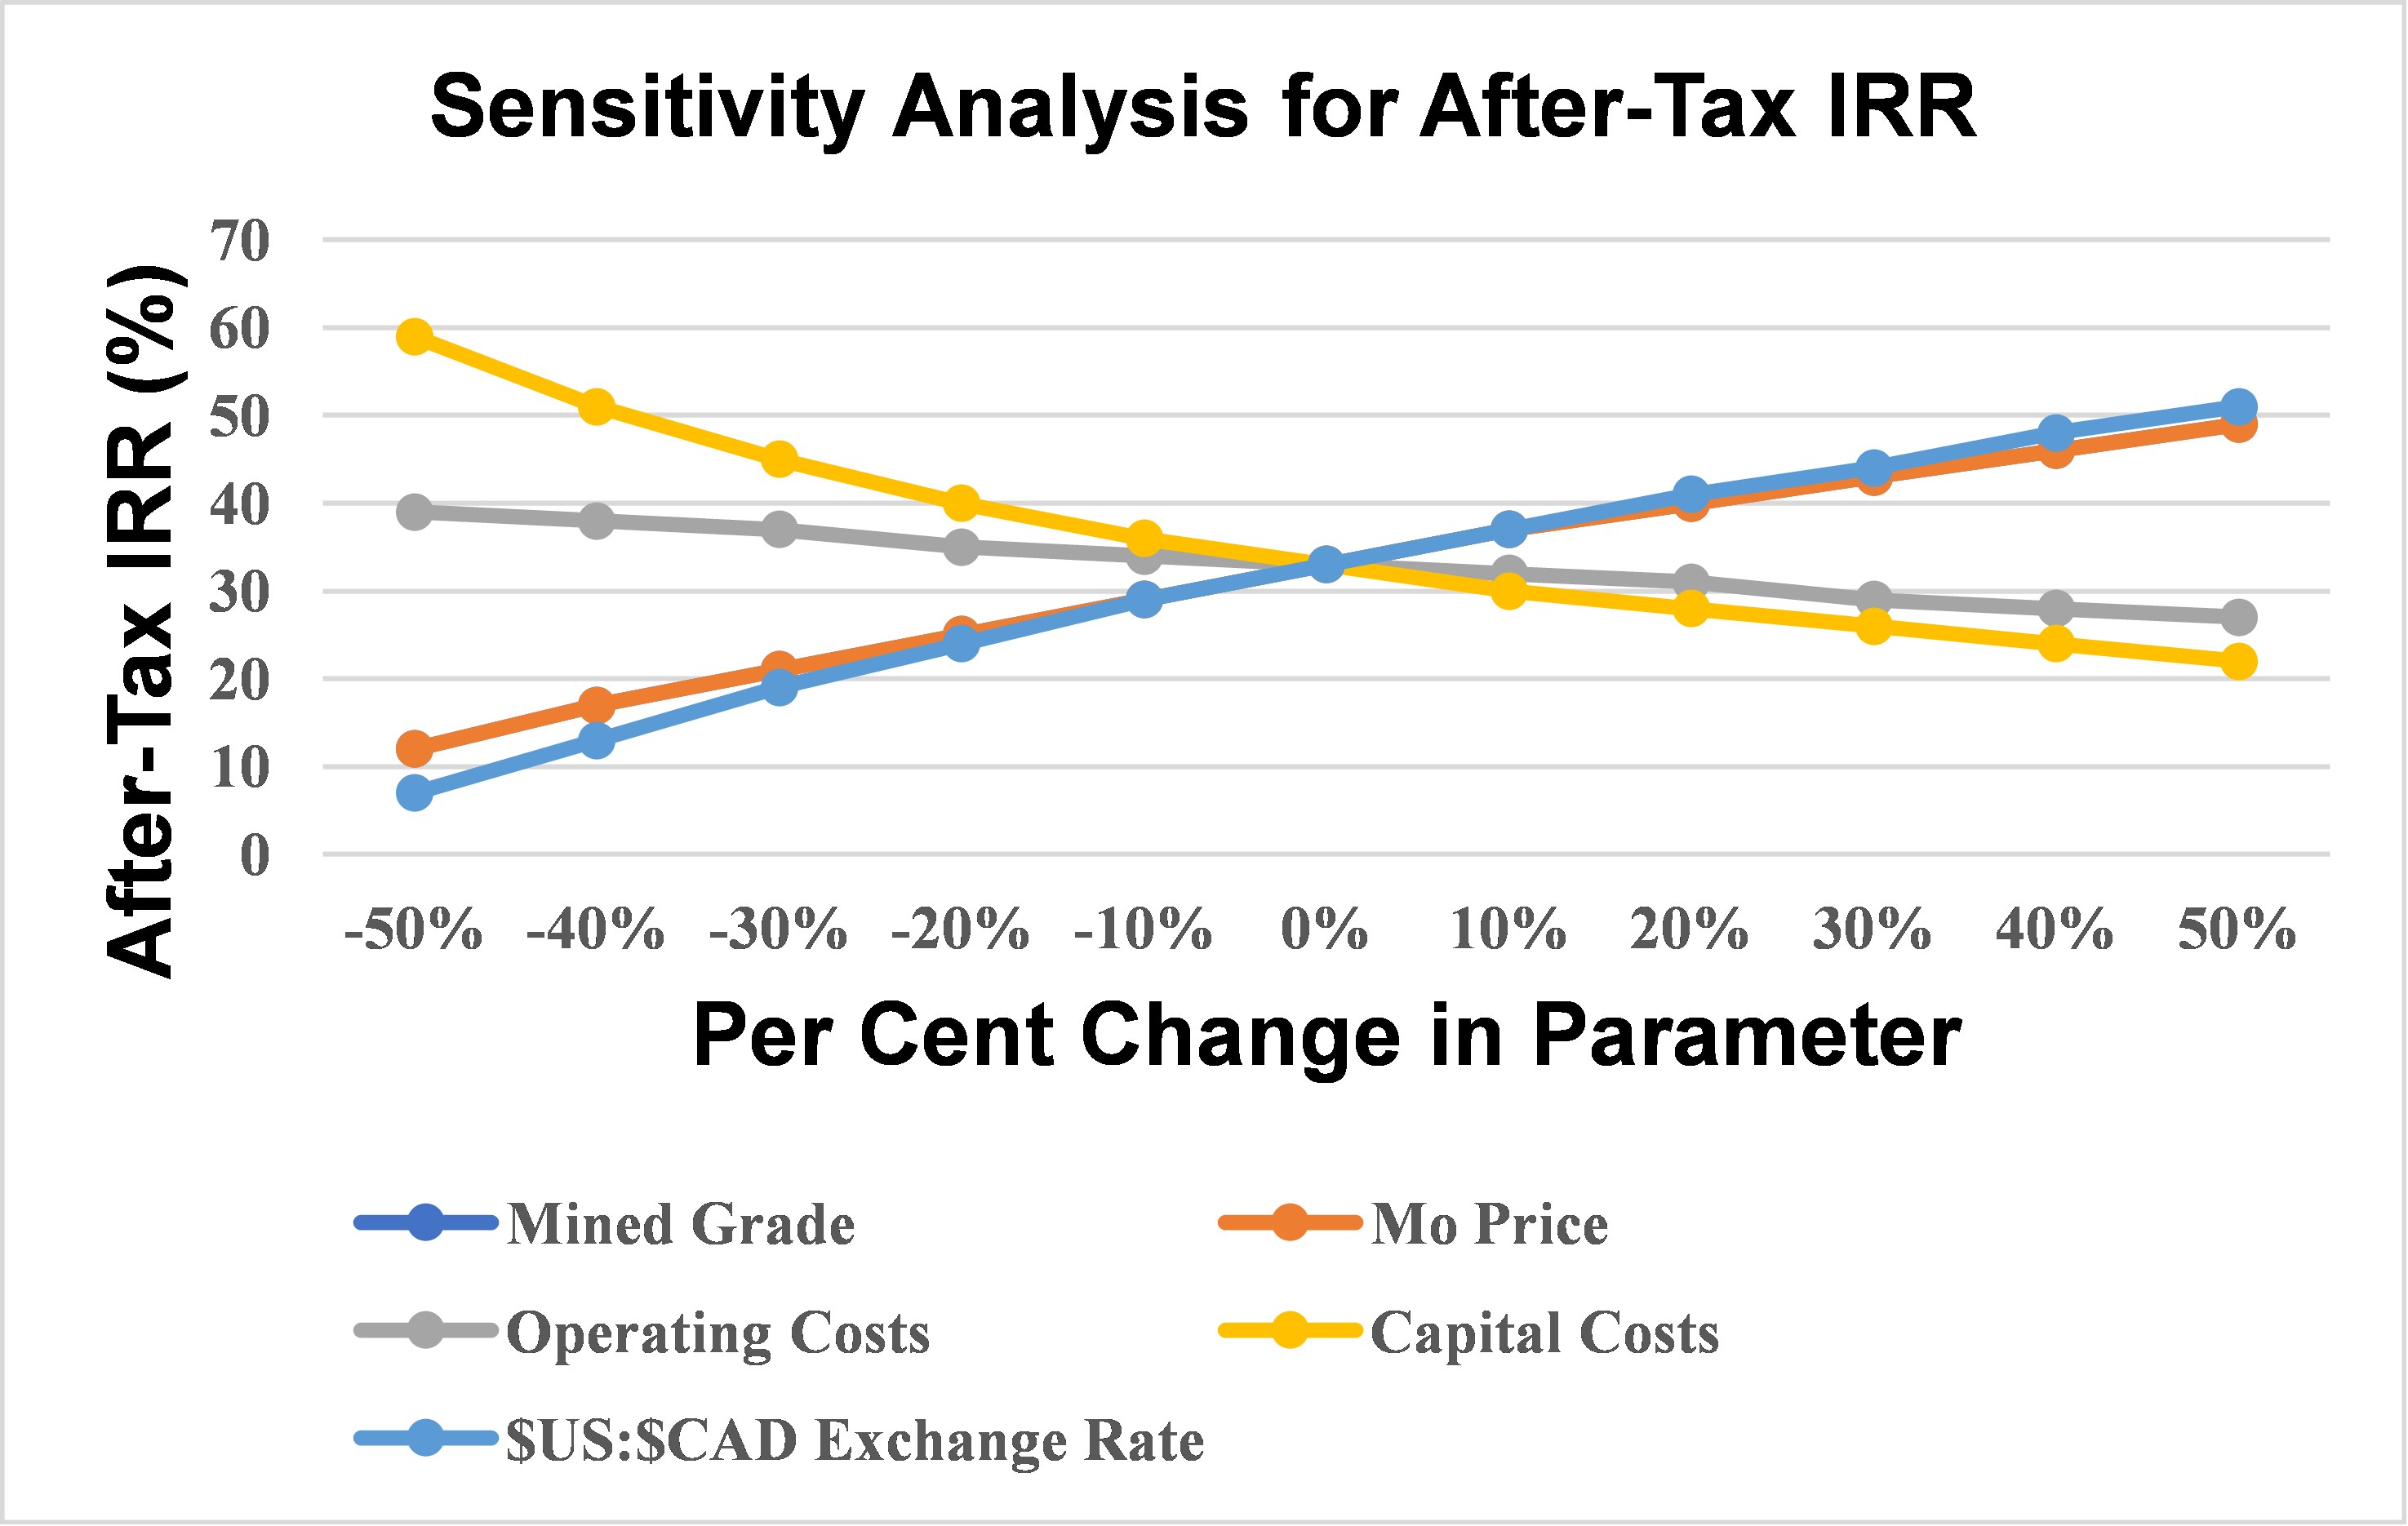
Note: The lines for Grade and Metal Price are virtually the same and overlay each other.
To view an enhanced version of this graphic, please visit:
https://images.newsfilecorp.com/files/7009/320318_4477c282b49f0a37_013full.jpg
Non-IFRS Financial Measures
The Company has included certain terms or performance measures commonly used in the mining industry that are not defined under International Financial Reporting Standards ("IFRS") in this news release. These include Operating Costs, Cash Cost, AISC, Pre-Production Capital Expenditures, Sustaining Capital Expenditures and Life of Mine Average Operating Costs. Non-IFRS measures do not have any standardized meaning prescribed under IFRS, and therefore, they may not be comparable to similar measures employed by other companies. The data presented are intended to provide additional information and should not be considered in isolation or as a substitute for measures prepared in accordance with IFRS. Non-IFRS financial measures used in this news release and common to the mining industry are defined.
Operating Costs include mining, processing, general and administrative, concentrate transportation costs, treatment and refining charges, etc.
Cash costs include on-site mining costs plus on-site G&A, royalties/production taxes and permitting/community costs related to current operations, less byproduct credits, if any.
AISC includes total cash costs plus reclamation costs, exploration and study costs, sustaining capital exploration/development and sustaining capital expenditure.
Next Steps
The Company has commenced baseline environmental studies and further engineering studies to advance and de-risk the Project from a design and environmental standpoint. Moon River is also working with First Nations to discuss potential impacts and mitigation measures as well as economic opportunities. The Company expects to issue a Pre-Feasibility Study in the first half of 2027.
Technical Report & Qualified Persons
A Technical Report on the PEA (the "Technical Report") prepared in accordance with National Instrument 43-101 Standards of Disclosure for Mineral Projects ("NI 43-101") will be filed on SEDAR+ under the Company's profile within 45 days of the date of this news release. Readers are encouraged to read the Technical Report in its entirety, including all qualifications, assumptions and exclusions that relate to the Mineral Resource. The Technical Report is intended to be read as a whole, and sections should not be read or relied upon out of context.
Qualified Persons
The scientific and technical content of this news release was reviewed, verified, and approved by Mr. Brian LeBlanc, P. Eng., President of AMPL, an independent "Qualified Person" ("QP") as defined by NI 43-101. Mr. LeBlanc is the QP responsible for the scientific and technical information contained in this news release. Mr. Finley Bakker P. Geo. and a QP reviewed, verified, and approved the mineral resource information in this news release. Processing (metallurgical) test work, operating costs and capital costs were peer reviewed by Mr. John Eggert, P. Eng. and a QP. Mr. Eggert found no issues with any of this test work. Mr. John Eggert, P. Eng. reviewed, verified, and approved and was the QP responsible for processing (metallurgical) information in this news release.
About Moon River
Moon River is a Canadian-based resource company focused on the acquisition, exploration and development of mineral projects. Moon River is focused on the development of the Davidson Project which hosts a large molybdenum-copper-tungsten deposit and is located near Smithers, British Columbia. The Company also holds a 25% interest in the Endako molybdenum mine also located in British Columbia.
For further information please contact:
Paul Parisotto, President, Chief Executive Officer and Director, at (416) 800-1753 or info@moonrivermoly.com.
Neither the TSXV nor its Regulation Services Provider (as that term is defined in the policies of the TSXV) accepts responsibility for the adequacy or accuracy of this release.
Forward-looking Statements:
This news release contains forward-looking statements and forward-looking information (collectively, "forward-looking statements") within the meaning of applicable securities laws. Any statements that are contained in this news release that are not statements of historical fact may be deemed to be forward-looking statements. Forward-looking statements are often identified by terms such as "may", "should", "anticipate", "will", "estimates", "believes", "intends", "expects", "plans" and similar expressions, which are intended to identify forward-looking statements. More particularly and without limitation, this news release contains forward-looking statements concerning metal price assumptions, cash flow forecasts, projected capital and operating costs, metal recoveries, mine life, production rates, infrastructure, permitting, potential enhancements to the Project, expected Project returns, and future plans set out in the Technical Report in respect of the PEA. These forward-looking statements reflect the current views of the Company, represent the expectations of the Company as of the date of this news release, and are based on certain assumptions that the Company and its consultants have made in preparing this PEA and Technical Report that will be filed in respect thereto within 45 days of this news release. There can be no assurance that the results particularly the expected Project returns will be achieved or the Mineral Resources that are not Mineral Reserves will be economically viable. The PEA mine plan and economic model include numerous assumptions. Inferred Resources listed in this news release are considered to be too speculative geologically to have the economic considerations applied to them that would enable them to be categorized as mineral reserves and to be used in an economic analysis except as allowed for by NI 43-101 in PEA studies. There is no guarantee that Inferred Resources can be converted to Indicated or Measured Resources. There is also no guarantee the economics described herein will be achieved. Readers are encouraged to read the Technical Report in its entirety, including all qualifications, assumptions and exclusions that relate to the Mineral Resources. The Technical Report is intended to be read as a whole, and sections should not be read or relied upon out of context.
Although the Company believes the expectations and material factors and assumptions reflected in these forward-looking statements are reasonable as of the date hereof, there can be no assurance that these expectations, factors and assumptions will prove to be correct. These forward-looking statements are not guarantees of future performance and are subject to a number of known and unknown risks and uncertainties including risks detailed in the PEA and continuous disclosure including the Technical Report, which are or will be available on SEDAR+ at www.sedarplus.ca. Accordingly, readers should not place undue reliance on the forward-looking statements contained in this news release.
These risk factors should not be construed as exhaustive. Readers are cautioned that events or circumstances could cause results to differ materially from those predicted, forecasted or projected in the PEA and the Technical Report in respect thereof. The forward-looking statements contained in this news release speak only as of the date of this news release.
The Company does not undertake any obligation to publicly update or revise any forward-looking statements or information contained herein, except as required by applicable laws. The forward-looking statements contained in this document are expressly qualified by this cautionary statement.
(1) See "National Instrument 43-101 Technical Report for the Endako Mine Restart Preliminary Economic Assessment" dated January 5, 2026 with an effective date of November 21, 2025, which is available for review on SEDAR+ (www.sedarplus.ca) under the Company's issuer profile.

To view the source version of this press release, please visit https://www.newsfilecorp.com/release/320318
Source: Moon River Moly Ltd.