
Production of 41,447 boe/d exceeded Saturn's guidance for the eighth consecutive quarter
Adjusted funds flow(1) of $123 million ($0.68/share) drove free funds flow(1) of $82 million ($0.46/share)
Nimble asset base and flexible capital program supported the acceleration of $20 million of capital from Q3 into Q2 to bring volumes on sooner into a stronger oil price environment
Continued execution of our blueprint strategy with 'core-up' acquisitions in the quarter that expand scale, increase drilling inventory and enhance asset value
Calgary, Alberta--(Newsfile Corp. - July 29, 2026) - Saturn Oil & Gas Inc. (TSX: SOIL) (OTCQX: OILSF) ("Saturn" or the "Company"), a light oil-weighted producer focused on unlocking value through the development of assets in Saskatchewan and Alberta, is pleased to report our operating and financial results for the three and six months ended June 30, 2026, featuring production ahead of guidance and strong adjusted funds flow ("AFF") of $122.6 million ($0.68/share basic) driving free funds flow of $82.5 million ($0.46/share basic). Saturn's financial statements ("Financial Statements"), as well as Management's Discussion and Analysis ("MD&A") for the three and six months ended June 30, 2026 are available on our website and filed on SEDAR+ at sedarplus.ca. As previously released, a conference call and webcast to discuss the results has been scheduled for Thursday, July 30, 2026 at 8:00 am Mountain Time (10:00 am Eastern Time). Access details for the conference call and webcast are provided below.
"Saturn's Q2/26 results reflect the positive momentum we are building throughout the organization, highlighted by quarterly production exceeding our previous guidance and analyst expectations for the eighth consecutive period. To capitalize on elevated oil prices during the quarter, we accelerated capital from the back half of 2026 into Q2, demonstrating the agile nature of our asset base and nimble capital program. Our development team rapidly mobilized to get drilling rigs back in the field a month sooner than originally planned," said John Jeffrey, Chief Executive Officer. "We have also continued 'coring-up' in our key operating areas, targeting accretive acquisitions that can further expand our drilling inventory, increase our size and scale, and enhance the value of our overall asset base. Saturn supported all of these efforts with the announced issue of new, dual-tranche US and Canadian dollar denominated Senior Unsecured Notes due 2031, which improve our financial flexibility, significantly lower our interest rate and relax covenants that were features of our previous secured senior notes."
Q2 2026 HIGHLIGHTS
Production averaged 41,447 boe/d(2) (81% oil and liquids) in Q2, reflecting continued outperformance of Saturn's wells, slightly offset by some weather-related downtime in June. During the first half of 2026, volumes averaged 42,277 boe/d(2).
Record corporate revenue of $359 million in Q2, reflecting strong production volumes and supportive pricing, with first half 2026 revenue also setting a record at $629 million.
AFF(1) was $123 million ($0.68/share basic) in Q2, bringing our first half AFF to $230 million, while adjusted EBITDA(1) was $142 million in the quarter and $269 million in the first half of 2026. Net income during the period was $108 million ($0.60/share basic).
Free funds flow(1) totaled $82.5 million ($0.46/share basic) in the quarter, with $145 million generated through the first half of 2026. Saturn has continued to direct free funds flow to ongoing debt repayment, our ongoing tuck-in acquisition strategy, and returning capital to our shareholders through buybacks.
Capital expenditures(1)(4) in Q2 totaled $40 million and include the previously announced acceleration of capital from Q3 into Q2 to capture stronger oil prices. Saturn was able to get rigs back into the field a full month sooner than originally planned due to our flexible capital program, along with favourable weather conditions at the tail end of the spring break-up period. Five rigs were deployed in late May and started drilling in early June, which resulted in 17 gross (11.4 net) wells being drilled and brought on production, with inclement weather delaying some capital and having a short-term impact on operations in southeast Saskatchewan ("SE SK").
Enhanced Saturn's size and scale, with $45 million directed to close a series of strategic tuck-in acquisitions in the quarter. In addition to expanding Saturn's drilling inventory and land position within our existing core SE SK and Alberta areas, the acquisitions provide the Company with further synergies, cost reduction opportunities, infrastructure streamlining plus production optimization and reactivation potential.
Net debt(1) of $762 million at June 30, 2026 included US$504 million (C$716 million) outstanding on our 2029 Senior Notes, and a net $40.4 million draw on our credit facility, reflecting the tuck-in acquisitions and accelerated capital program described above. Saturn's net debt to annualized adjusted EBITDA ratio was 1.3x at June 30, 2026.
Returned $8.4 million to shareholders during the quarter through the repurchase and cancellation of 1.3 million shares via our normal course issuer bid ("NCIB") at a weighted average price of $6.36 per share, continuing our steady return of capital to Saturn shareholders.
EVENTS SUBSEQUENT TO QUARTER END
Strategic SE SK 'core-up' with the accretive tuck-in acquisitions of privately-held Burgess Creek Exploration Inc., expected to close in early August, and Triland Energy Inc., which closed in the latter part of July (collectively, the "SE SK Acquisitions"). Integrating the SE SK Acquisitions into Saturn's portfolio enhances the Company's size, scale and profitability. The total purchase price of the SE SK Acquisitions is estimated at $173 million, prior to customary closing adjustments, resulting in attractive acquisition metrics of less than 2x estimated 2026 net operating income.
Priced a private placement dual-tranche offering of Senior Unsecured Notes due 2031, including US$575 million at 8.5% and C$185 million at 7.5%, issued at par (together, the "New Notes"), and announced the planned redemption of Saturn's outstanding senior secured second lien notes due 2029 (the "2L Notes"). Refinancing the 2L Notes significantly reduces interest costs and enhances our financial flexibility by transitioning to a senior unsecured note from a senior secured note. In addition, we have extended the tenor on the New Notes to 2031, eliminated the mandatory 10% amortization feature and relaxed some covenants that were required under the 2L Notes.
Extended and increased syndicated credit facility to three years, expanding the elected commitment to $200 million with a total available borrowing base and commitments up to $500 million, improving financial flexibility and lowering our cost of borrowing.
Successfully completed our NCIB, repurchasing a total of 12.1 million shares in the open market from August 27, 2025 to July 22, 2026 at a weighted average price per share of $3.29, bringing Saturn's total return to shareholders since August of 2024 to $66 million, including our substantial issuer bid, and cancelling 24.2 million shares.
FINANCIAL AND OPERATING HIGHLIGHTS
| Three months ended | Six months ended | |||||||||||||||
| ($000s, except per share amounts) | June 30, 2026 | March 31, 2026 | June 30, 2025 | June 30, 2026 | June 30, 2025 | |||||||||||
| FINANCIAL HIGHLIGHTS | ||||||||||||||||
| Petroleum and natural gas sales | 358,714 | 270,237 | 236,712 | 628,951 | 514,793 | |||||||||||
| Cash flow from operating activities | 126,955 | 113,246 | 89,865 | 240,201 | 255,237 | |||||||||||
| Operating netback, net of derivatives(1) | 147,272 | 132,740 | 131,833 | 280,012 | 289,400 | |||||||||||
| Adjusted EBITDA(1) | 142,055 | 126,528 | 131,712 | 268,583 | 284,897 | |||||||||||
| Adjusted funds flow(1) | 122,609 | 107,228 | 108,854 | 229,837 | 239,975 | |||||||||||
| per share - Basic(1) | 0.68 | 0.59 | 0.56 | 1.27 | 1.22 | |||||||||||
| - Diluted(1) | 0.64 | 0.59 | 0.53 | 1.20 | 1.16 | |||||||||||
| Free funds flow(1) | 82,528 | 62,478 | 93,012 | 145,006 | 150,838 | |||||||||||
| per share - Basic(1) | 0.46 | 0.34 | 0.48 | 0.80 | 0.77 | |||||||||||
| - Diluted(1) | 0.43 | 0.34 | 0.45 | 0.76 | 0.73 | |||||||||||
| Net income (loss) | 108,116 | (97,324 | ) | 95,054 | 10,792 | 132,873 | ||||||||||
| per share - Basic | 0.60 | (0.53 | ) | 0.49 | 0.06 | 0.67 | ||||||||||
| - Diluted | 0.57 | (0.53 | ) | 0.46 | 0.06 | 0.64 | ||||||||||
| Acquisitions, net of cash acquired | 45,665 | (1,713 | ) | 5,132 | 43,952 | 5,132 | ||||||||||
| Proceeds from dispositions | - | (3,503 | ) | - | (3,503 | ) | - | |||||||||
| Capital expenditures(1)(3) | 40,081 | 44,750 | 15,842 | 84,831 | 89,137 | |||||||||||
| Total assets | 2,192,572 | 2,174,597 | 2,103,571 | 2,192,572 | 2,103,571 | |||||||||||
| Net debt(1), end of period | 761,553 | 724,763 | 694,835 | 761,553 | 694,835 | |||||||||||
| Shareholders' equity | 909,286 | 845,780 | 929,573 | 909,286 | 929,573 | |||||||||||
| Common shares outstanding, end of period | 178,300 | 179,987 | 194,809 | 178,300 | 194,809 | |||||||||||
| Weighted average, basic | 179,788 | 181,989 | 195,644 | 180,883 | 196,872 | |||||||||||
| Weighted average, diluted | 191,025 | 181,989 | 206,040 | 191,744 | 207,268 | |||||||||||
| OPERATING HIGHLIGHTS | ||||||||||||||||
| Average production volumes | ||||||||||||||||
| Light and medium crude oil (bbls/d) | 26,614 | 27,645 | 26,712 | 27,130 | 27,202 | |||||||||||
| Heavy crude oil (bbls/d) | 3,244 | 3,199 | 3,438 | 3,218 | 3,441 | |||||||||||
| NGLs (bbls/d) | 3,858 | 3,938 | 3,310 | 3,898 | 3,314 | |||||||||||
| Natural gas (mcf/d) | 46,385 | 50,004 | 41,740 | 48,185 | 42,526 | |||||||||||
| Total boe/d | 41,447 | 43,116 | 40,417 | 42,277 | 41,045 | |||||||||||
| % Oil and NGLs | 81% | 81% | 83% | 81% | 83% | |||||||||||
| Average realized prices | ||||||||||||||||
| Crude oil ($/bbl) | 122.14 | 88.94 | 79.72 | 105.36 | 85.15 | |||||||||||
| NGLs ($/bbl) | 58.35 | 43.08 | 40.24 | 50.68 | 46.57 | |||||||||||
| Natural gas ($/mcf) | 1.81 | 2.19 | 1.80 | 2.01 | 2.14 | |||||||||||
| Processing expenses ($/boe) | (0.34 | ) | (0.46 | ) | (0.26 | ) | (0.40 | ) | (0.26 | ) | ||||||
| Petroleum and natural gas sales ($/boe) | 95.11 | 69.64 | 64.36 | 82.19 | 69.29 | |||||||||||
| Operating netback ($/boe) | ||||||||||||||||
| Petroleum and natural gas sales | 95.11 | 69.64 | 64.36 | 82.19 | 69.29 | |||||||||||
| Royalties | (12.25 | ) | (7.76 | ) | (7.68 | ) | (9.97 | ) | (8.36 | ) | ||||||
| Net operating expenses(1) | (20.98 | ) | (20.49 | ) | (18.28 | ) | (20.73 | ) | (18.93 | ) | ||||||
| Transportation expenses | (1.75 | ) | (1.73 | ) | (1.65 | ) | (1.74 | ) | (1.60 | ) | ||||||
| Operating netback(1) | 60.13 | 39.66 | 36.75 | 49.75 | 40.40 | |||||||||||
| Realized loss on derivatives | (21.09 | ) | (5.45 | ) | (0.91 | ) | (13.16 | ) | (1.44 | ) | ||||||
| Operating netback, net of derivatives(1) | 39.04 | 34.21 | 35.84 | 36.59 | 38.96 | |||||||||||
OPERATIONAL UPDATE
For the eighth consecutive quarter, Saturn's average production of 41,447 boe/d in Q2/26 exceeded previous guidance and analyst expectations. The continued outperformance of our wells during April and May was somewhat muted by weather impacts in June that caused short-term production downtime in SE SK, and delayed the start of the Company's accelerated Q2 capital program. Since spring break-up conditions in Q2 typically result in minimal capital spending and lower production, we are very pleased that Saturn was able to continue the momentum we built through Q1, which contributed to volumes again coming in above our guidance.
To capitalize on stronger oil prices in the second quarter, Saturn elected to accelerate capital from Q3 into Q2, which was supported by favourable surface conditions that enabled us to get rigs back into the field four to five weeks earlier than we typically would expect. With five rigs running during June, we drilled 17 gross (11.4 net) wells, including 13 in SE SK, two of which were open-hole multi-lateral ("OHML") wells.
Building on our growing expertise in OHML drilling, Saturn drilled our first-ever OHML Torquay well in June, the 7-16, positioning the Company as the only operator to have drilled OHML wells into four different formations in SE SK, including the Bakken, Spearfish, Midale and Torquay. Based on early production performance from the 7-16 well, volumes are trending ahead of our 180 bbl/d type curve(3) expectations, consistent with the outperformance exhibited by the majority of our OHML drills to date. We also drilled an OHML Bakken well at Viewfield during Q2, and our second OHML Torquay well at 8-22 finished drilling in early July.
Through the second quarter, Saturn successfully closed a series of strategic tuck-in acquisitions (the "Tuck-Ins") for an aggregate approximately $45 million, bolstering our footprint in SE SK and Alberta. The Tuck-Ins allow the Company to expand our operational scale in existing core areas, add incremental production, grow our development inventory and benefit from acquired infrastructure. Consistent with our strategic blueprint, we anticipate the integrated assets will provide meaningful operational synergies, enhance capital efficiencies going forward, and further consolidate Saturn's position across several of our highest-return operating areas. We also expanded our acreage position through some small Crown land sales in Saskatchewan, growing our secondary P1 Spearfish play that the team is excited to drill.
Consistent with our blueprint strategy, Saturn advanced the SE SK Acquisitions subsequent to the end of the quarter. The two assets are weighted approximately 96% to light oil and liquids, provide ideal expansion to our core acreage in SE SK, expand our booked location inventory and increase our OHML drilling targets. The purchase price for each company is less than the proved developed producing reserve net present values, while the acquired assets are expected to be accretive to our light oil weighting, operating netback and operating costs per boe.
OUR CONTINUED EVOLUTION
With the higher oil price environment that prevailed through most of Q2/26, we generated record revenue of $359 million, given our production is weighted over 80% to light oil and liquids. This strong performance in the quarter highlights the strength of our underlying business and the expertise of our technical teams, which collectively translated into robust AFF of $123 million and free funds flow of $82.5 million. Although hedge losses impacted our AFF during the quarter, Saturn's risk management portfolio served the intended purpose of protecting cash flows and limiting downside risk. Hedging continues to be an important part of Saturn's strategy, acting as a form of 'insurance' that adds certainty through volatile commodity price cycles.
With the issuance of our New Notes, Saturn realizes numerous benefits, including financial flexibility moving from a secured to unsecured structure, reduced interest costs, an extension of our tenor to 2031, and a more relaxed covenant framework that affords us greater control over capital allocation, operational decision-making and corporate strategy. As a result, the Company enters the second half of 2026 with an improved capital structure and enhanced flexibility that supports our primary focus of maximizing returns for Saturn shareholders.
We are also very proud to report that since first launching our NCIB in August of 2024, and including our substantial issuer bid, Saturn has returned $66 million to our shareholders, through the repurchase and cancellation of 24.2 million shares, or approximately 12% of the issued and outstanding shares in Aug/24. On July 22, 2026, we successfully completed the final purchase under our current NCIB, taking up 12.1 million shares from the open market during the period from August 27, 2025 to July 22, 2026. Upon the expiry of the current NCIB on August 26, 2026, we plan to renew our NCIB program with the Toronto Stock Exchange (the "TSX") for another 12-month period.
OUTLOOK
In addition to the issuance of our Q2/26 results, the Company has issued a separate press release dated July 29, 2026 outlining increased 2026 guidance, including an expanded full year development capital expenditure(1) budget of approximately $355 to $375 million. This is expected to drive estimated organic production growth of approximately 10% through the end of the year, with Saturn targeting to exit 2026 between 48,000 and 50,000 boe/d(2), weighted approximately 84% to oil and liquids. Full year 2026 annual production is anticipated to average between 43,000 and 44,000 boe/d(2), with higher capital in the second half offsetting a muted capital budget for the first half given lower oil prices.
For the third quarter of 2026, we expect capital spending to range between $165 and $175 million, with production expected to average between 42,000 to 43,000 boe/d(2), reflecting the higher capital and drilling activity planned in the quarter.
CONFERENCE CALL AND WEBCAST
The Company plans to host a conference call on Thursday, July 30, 2026, at 8:00 am Mountain Time (10:00 am Eastern Time), which will include a discussion with Saturn's leadership team, who will provide an overview of our Q2 2026 results, followed by a question-and-answer session with attendees.
Date: Thursday, July 30, 2026
Time: 8:00 am MT (10:00 am ET)
Live Webcast Link: https://www.gowebcasting.com/14721
North America (Toll Free) Dial In: 1-800-715-9871
International Dial In: 1-647-932-3411
An audio replay of the webcast will be available one hour after the end of the call at the link above and will remain accessible for 12 months. The replay link will also be posted on Saturn's website.
NOTES
(1) See reader advisory: Non-GAAP and Other Financial Measures.
(2) See reader advisory: Supplemental Information Regarding Product Types.
(3) See reader advisory 'Type Curve and Initial Production'.
(4) Includes capitalized G&A.
ABOUT SATURN
Saturn is a returns-driven Canadian energy company focused on the efficient, responsible and innovative development of high-quality, light oil weighted assets, supported by an acquisition strategy targeting accretive and complementary opportunities. The Company's portfolio of free-cash flowing, low-decline operated assets in Saskatchewan and Alberta provide a deep inventory of long-term economic drilling opportunities across multiple zones. With an unwavering commitment to building an entrepreneurial and safety-focused culture, Saturn's goal is to increase per share reserves, production and cash flow at an attractive return on invested capital. The Company's shares are listed for trading on the TSX under ticker 'SOIL' and on the OTCQX under the ticker 'OILSF'. Further information and our corporate presentation are available on Saturn's website at www.saturnoil.com.
INVESTOR & MEDIA CONTACTS
John Jeffrey, MBA – Chief Executive Officer
Tel: +1 (587) 392-7900
www.saturnoil.com
Cindy Gray, MBA – VP Investor Relations
Tel: +1 (587) 392-7900
info@saturnoil.com
READER ADVISORIES
Non-GAAP and Other Financial Measures
Throughout this news release and in other materials disclosed by the Company, Saturn employs certain measures to analyze financial performance, financial position and cash flow. These non-GAAP and other financial measures do not have any standardized meaning prescribed under IFRS and therefore may not be comparable to similar measures presented by other entities. The non-GAAP and other financial measures should not be considered to be more meaningful than GAAP measures which are determined in accordance with IFRS, such as net income (loss), cash flow from operating activities, and cash flow used in investing activities, as indicators of Saturn's performance.
The disclosure under the section "Non-GAAP and Other Financial Measures" in our MD&A, including non-GAAP financial measures and ratios, capital management measures and supplementary financial measures in the Company's Financial Statements and MD&A are incorporated by reference into this news release.
This news release may use the terms "Adjusted EBITDA", "Adjusted Funds Flow", "Net Debt", "Free Funds Flow", "Net Debt to Annualized Adjusted EBITDA" and "Net Debt to Annualized AFF" which are capital management financial measures. See the disclosure under "Capital Management" in our Financial Statements for the three and six months ended June 30, 2026, for an explanation and composition of these measures, how these measures provide useful information to an investor, and the additional purposes, if any, for which management uses these measures, and, where applicable, a reconciliation of the Company's historical non-GAAP financial measures to the most directly comparable measure calculated in accordance with GAAP for the applicable period then ended.
Capital Expenditures
Saturn uses capital expenditures to monitor its capital investments relative to those budgeted by the Company on an annual basis. Saturn's capital budget excludes acquisition and disposition ("A&D") activities as well as the accounting impact of any accrual changes or payments under certain lease arrangements. The most directly comparable GAAP measure for capital expenditures is cash flow used in investing activities. The following table reconciles capital expenditures and capital expenditures, net A&D to the nearest GAAP measure, cash flow used in investing activities.
| Three months ended | Six months ended | ||||||||||||||
| ($000s) | June 30, 2026 | March 31, 2026 | June 30, 2025 | June 30, 2026 | June 30, 2025 | ||||||||||
| Cash flow used in investing activities | 76,798 | 54,473 | 67,934 | 131,271 | 167,454 | ||||||||||
| Change in non-cash working capital | 8,948 | (14,939 | ) | (46,960 | ) | (5,991 | ) | (73,185 | ) | ||||||
| Capital expenditures, net A&D | 85,746 | 39,534 | 20,974 | 125,280 | 94,269 | ||||||||||
| Acquisitions, net of cash acquired | (45,665 | ) | 1,713 | (5,132 | ) | (43,952 | ) | (5,132 | ) | ||||||
| Proceeds from disposition | - | 3,503 | - | 3,503 | - | ||||||||||
| Capital expenditures | 40,081 | 44,750 | 15,842 | 84,831 | 89,137 | ||||||||||
F&D and FD&A Expenditures
Saturn uses F&D and FD&A expenditures as a basis to monitor its capital efficiency. The Company's F&D expenditures are calculated by removing certain capitalized overhead costs from capital expenditures. The Company's FD&A expenditures are calculated by adding A&D to FD&A expenditures. Both measures calculate the capital cost outlay associated with the Company's exploration and development activities for the purposes of finding, developing and, when desired, acquiring its reserves.
Adjusted Funds Flow per Share
Adjusted funds flow per share is a non-GAAP ratio by management to better analyze the Company's performance against prior periods on a more comparable basis. Adjusted funds flow per share is calculated as adjusted funds flow from operations divided by weighted average shares outstanding during the applicable period on a basic or diluted basis.
Free Funds Flow and Free Funds Flow per Share
Saturn uses free funds flow as an indicator of the efficiency and liquidity of its business, measuring its funds after capital investment available to manage debt levels, pursue acquisitions and gauge optionality to pay dividends and/or return capital to shareholders through activities such as share repurchases. Saturn calculates free funds flow as adjusted funds flow in the period less capital expenditures. By removing the impact of current period capital expenditures from adjusted funds flow, management monitors its free funds flow to inform its capital allocation decisions. Free funds flow is also presented on a per share basis as a non-GAAP financial ratio. The following table reconciles adjusted funds flow to free funds flow.
| Three months ended | Six months ended | ||||||||||||||
| ($000s) | June 30, 2026 | March 31, 2026 | June 30, 2025 | June 30, 2026 | June 30, 2025 | ||||||||||
| Adjusted funds flow | 122,609 | 107,228 | 108,854 | 229,837 | 239,975 | ||||||||||
| Capital expenditures | (40,081 | ) | (44,750 | ) | (15,842 | ) | (84,831 | ) | (89,137 | ) | |||||
| Free funds flow | 82,528 | 62,478 | 93,012 | 145,006 | 150,838 | ||||||||||
Gross Petroleum and Natural Gas Sales
Gross petroleum and natural gas sales is calculated by adding crude oil, natural gas and NGLs revenue, before deducting certain gas processing expenses in arriving at petroleum and natural gas revenue as required under IFRS 15 Revenue from Contracts with Customers. These processing expenses associated with the processing of natural gas and NGLs revenue are a result of the Company transferring custody of the product at the terminal inlet, and therefore receiving net prices. This metric is used by management to quantify and analyze the realized price received before required processing deductions, against benchmark prices. The calculation of the Company's gross petroleum and natural gas sales is shown within the "Petroleum and Natural Gas Sales" section within the MD&A.
Royalties as a Percentage of Gross Petroleum and Natural Gas Sales
Royalties as a percentage of gross petroleum and natural gas sales is calculated as royalties divided by gross petroleum and natural gas sales. This metric is used by management to quantify the Company's royalty costs as they relate to revenue before deducting certain processing expenses and to better analyze how royalty rates change over time and compare to prior periods.
Net Operating Expenses
Net operating expense is calculated by deducting processing income primarily generated by processing third party production at processing facilities where the Company has an ownership interest, from operating expenses presented on the Statement of income (loss). Where the Company has excess capacity at one of its facilities, it will process third-party volumes to reduce the cost of ownership in the facility. The Company's primary business activities are not that of a midstream entity whose activities are focused on earning processing and other infrastructure-based revenues, and as such third-party processing revenue is netted against operating expenses in the MD&A. This metric is used by management to evaluate the Company's net operating expenses on a unit of production basis. Net operating expense per boe is a non-GAAP financial ratio and is calculated as net operating expense divided by total barrels of oil equivalent produced over a specific period of time. The calculation of the Company's net operating expenses is shown within the "Net Operating Expenses" section within the MD&A.
| Three months ended | Six months ended | |||||||||||||||||||
| ($000s) | June 30, 2026 | March 31, 2026 | June 30, 2025 | June 30, 2026 | June 30, 2025 | |||||||||||||||
| Petroleum and natural gas sales | 358,714 | 270,237 | 236,712 | 628,951 | 514,793 | |||||||||||||||
| Royalties | (46,191 | ) | (30,095 | ) | (28,239 | ) | (76,286 | ) | (62,132 | ) | ||||||||||
| Net operating expenses | (79,124 | ) | (79,518 | ) | (67,226 | ) | (158,642 | ) | (140,667 | ) | ||||||||||
| Transportation expenses | (6,585 | ) | (6,716 | ) | (6,077 | ) | (13,301 | ) | (11,922 | ) | ||||||||||
| Operating netback | 226,814 | 153,908 | 135,170 | 380,722 | 300,072 | |||||||||||||||
| Realized loss on derivatives | (79,542 | ) | (21,168 | ) | (3,337 | ) | (100,710 | ) | (10,672 | ) | ||||||||||
| Operating netback, net of derivatives | 147,272 | 132,740 | 131,833 | 280,012 | 289,400 | |||||||||||||||
| ($ per boe amounts) | ||||||||||||||||||||
| Petroleum and natural gas sales | 95.11 | 69.64 | 64.36 | 82.19 | 69.29 | |||||||||||||||
| Royalties | (12.25 | ) | (7.76 | ) | (7.68 | ) | (9.97 | ) | (8.36 | ) | ||||||||||
| Net operating expenses | (20.98 | ) | (20.49 | ) | (18.28 | ) | (20.73 | ) | (18.93 | ) | ||||||||||
| Transportation expenses | (1.75 | ) | (1.73 | ) | (1.65 | ) | (1.74 | ) | (1.60 | ) | ||||||||||
| Operating netback | 60.13 | 39.66 | 36.75 | 49.75 | 40.40 | |||||||||||||||
| Realized loss on derivatives | (21.09 | ) | (5.45 | ) | (0.91 | ) | (13.16 | ) | (1.44 | ) | ||||||||||
| Operating netback, net of derivatives | 39.04 | 34.21 | 35.84 | 36.59 | 38.96 | |||||||||||||||
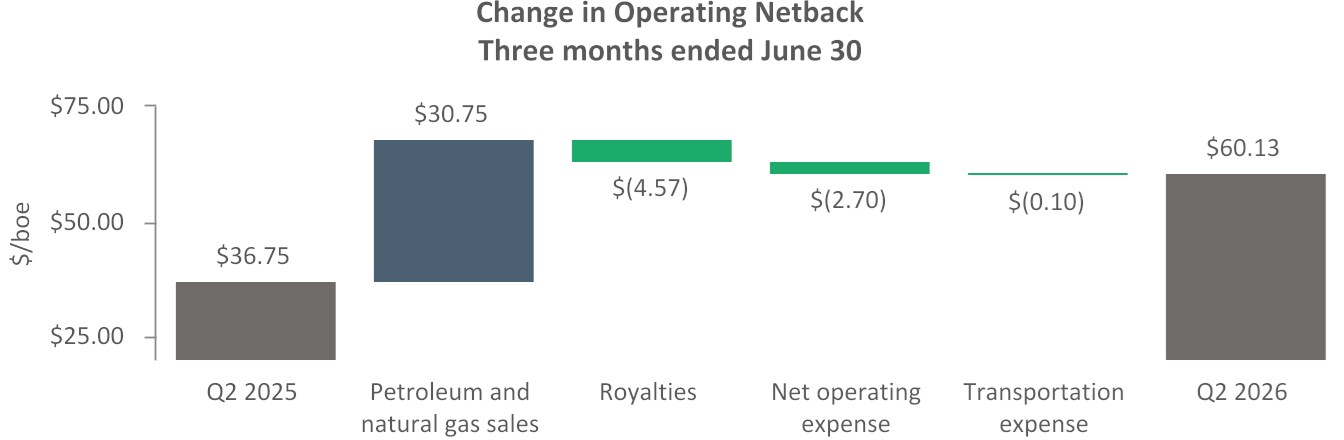
To view an enhanced version of this graphic, please visit:
https://images.newsfilecorp.com/files/8024/307151_04a7724a14b9aaeb_001full.jpg
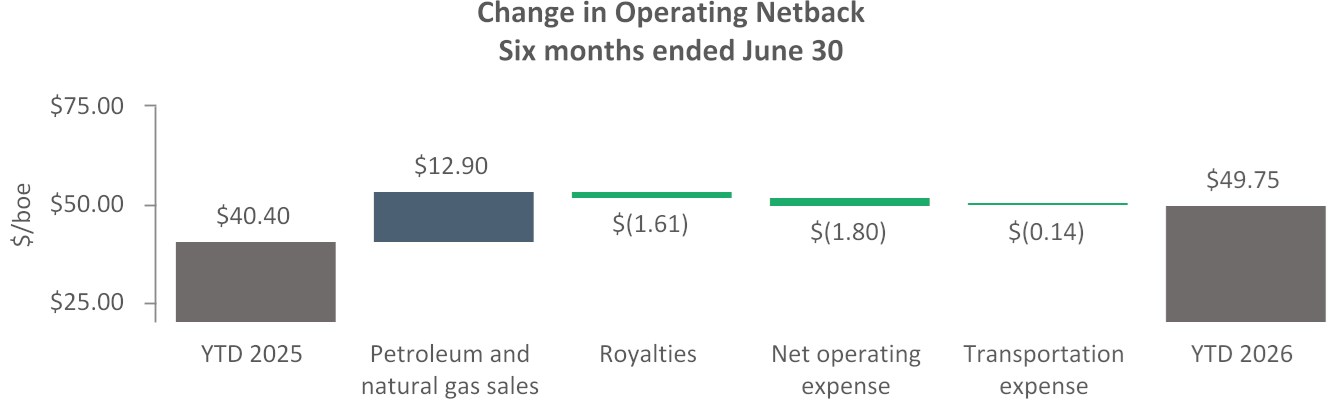
To view an enhanced version of this graphic, please visit:
https://images.newsfilecorp.com/files/8024/307151_04a7724a14b9aaeb_002full.jpg
Enterprise Value
The Company's enterprise value is calculated as total market capitalization plus net debt. Enterprise value is used to assess the valuation of the Company. Refer to the Liquidity and Capital Resources section in the MD&A for further information.
Capital Management Measures
NI 52-112 defines a capital management measure as a financial measure that: (i) is intended to enable an individual to evaluate an entity's objectives, policies and processes for managing the entity's capital; (ii) is not a component of a line item disclosed in the primary financial statements of the entity; (iii) is disclosed in the notes to the financial statements of the entity; and (iv) is not disclosed in the primary financial statements of the entity. Please refer to note 13 "Capital Management" in Saturn's financial statements as at and for the period ended June 30, 2026, for additional disclosure on: adjusted working capital deficit (surplus), net debt, adjusted EBITDA, adjusted funds flow, free funds flow, annualized quarterly adjusted funds flow, and net debt to annualized quarterly adjusted funds flow, each of which are capital management measures used by the Company in the MD&A.
Supplementary Financial Measures
NI 52‐112 defines a supplementary financial measure as a financial measure that: (i) is, or is intended to be, disclosed on a periodic basis to depict the historical or expected future financial performance, financial position or cash flow of an entity; (ii) is not disclosed in the financial statements of the entity; (iii) is not a non‐GAAP financial measure; and (iv) is not a non‐GAAP ratio. The supplementary financial measures used in this news release are either a per unit disclosure of a corresponding GAAP measure, or a component of a corresponding GAAP measure, presented in the financial statements. Supplementary financial measures that are disclosed on a per unit basis are calculated by dividing the aggregate GAAP measure (or component thereof) by the applicable unit for the period. Supplementary financial measures that are disclosed on a component basis of a corresponding GAAP measure are a granular representation of a financial statement line item and are determined in accordance with GAAP.
Product Type Information
The Company's aggregate average production for the past eight quarters and the references to "crude oil", "NGLs", and "natural gas" reported in this news release consist of the following product types, as defined in NI 51-101 and using a conversion ratio of 1 Bbl : 6 Mcf where applicable:
| 2026 | 2025 | 2024 | ||||||||||||||||||||||
| Q2 | Q1 | Q4 | Q3 | Q2 | Q1 | Q4 | Q3 | |||||||||||||||||
| Average daily production | ||||||||||||||||||||||||
| Light & medium crude oil (bbls/d) | 26,614 | 27,645 | 27,962 | 25,825 | 26,712 | 27,697 | 27,330 | 24,992 | ||||||||||||||||
| Heavy crude oil (bbls/d) | 3,244 | 3,199 | 3,325 | 3,327 | 3,438 | 3,445 | 3,119 | 4,002 | ||||||||||||||||
| NGLs (bbls/d) | 3,858 | 3,938 | 4,052 | 4,180 | 3,310 | 3,318 | 3,381 | 3,407 | ||||||||||||||||
| Conventional natural gas (mcf/d) | 46,385 | 50,004 | 49,906 | 46,860 | 41,740 | 43,319 | 43,328 | 39,885 | ||||||||||||||||
| Total (boe/d) | 41,447 | 43,116 | 43,657 | 41,142 | 40,417 | 41,680 | 41,051 | 39,049 | ||||||||||||||||
References to gas or natural gas and NGLs in this press release refer to conventional natural gas and natural gas liquids product types, respectively, as defined in National Instrument 51-101, Standards of Disclosure for Oil and Gas Activities, except where specifically noted otherwise.
- Q3 2026 average production, at the midpoint of the guidance range, is anticipated to be comprised of approximately 82% crude oil and NGLs and 18% natural gas.
- Full year 2026 average production, at the midpoint of the guidance range, is anticipated to be comprised of approximately 82% crude oil and NGLs and 18% natural gas
- Exit 2026 production, at the midpoint of the guidance range, is anticipated to be comprised of approximately 84% crude oil and NGLs and 16% natural gas.
Boe Presentation
Boe means barrel of oil equivalent. All boe conversions in this press release are derived by converting gas to oil at the ratio of six thousand cubic feet ("Mcf") of natural gas to one barrel ("Bbl") of oil. Boe may be misleading, particularly if used in isolation. A boe conversion rate of 1 Bbl : 6 Mcf is based on an energy equivalency conversion method primarily applicable at the burner tip and does not represent a value equivalency at the wellhead. Given that the value ratio of oil compared to natural gas based on currently prevailing prices is significantly different than the energy equivalency ratio of 1 Bbl: 6 Mcf, utilizing a conversion ratio of 1 Bbl : 6 Mcf may be misleading as an indication of value.
Type Curve and Initial Production
Certain type curve disclosure presented herein represents estimates of the production decline and ultimate volumes expected to be recovered over time. "Results Projected" are based on a forward estimate of ultimate volumes to be recovered over time based on the initial 30 days average production data. "Guidance Well Type Curves" are the forecasted well performance used in setting the Company's guidance for expected results of the drilling program. Projected Results and Type Curves are useful in confirming and assessing the potential for the presence of hydrocarbons; however, such rates are not determinative of the rates at which such wells will continue production and decline thereafter, are not necessarily indicative of long-term performance or of long-term economics of the relevant well or fields, including future wells to be drilled, or of ultimate recovery of hydrocarbons.
Future Oriented Financial Information
This press release contains future oriented financial information and financial outlook information (collectively, "FOFI") about Saturn's production, capital expenditures and exit production, all of which are subject to the same assumptions and risk factors as other forward-looking information and statements provided in the paragraphs below. Saturn's management believe that FOFI has been prepared on a reasonable basis, reflecting management's best estimates and judgments, and are provided to assist readers in understanding management's expectations for the Company's near-term operating performance and may not be appropriate for other purposes. Saturn disclaims any intention or obligation to update or revise any FOFI contained in this document, whether as a result of new information, future events, or otherwise unless required pursuant to applicable law.
Forward-Looking Information and Statements
Certain information included in this press release constitutes forward-looking information under applicable securities legislation. Forward-looking information typically contains statements with words such as "anticipate", "believe", "expect", "plan", "intend", "estimate", "propose", "project", "scheduled", "will" or similar words suggesting future outcomes or statements regarding an outlook. Forward-looking information in this press release may include, but is not limited to, the Company's drilling and development plans, the anticipated benefits of the Company's increased credit facility and the New Notes, Saturn's plans with respect to our return of capital framework and the renewal of our NCIB, production, exit production and capital expenditures, the ability of the Company to realize the benefits of acquisitions, including expansion in its core areas, the post-adjustment purchase price and the synergies and cost reductions realized from tuck in acquisitions, expectations regarding netbacks, hedging strategy, the business plan, cost model and strategy of the Company and expectations regarding anticipated pricing trends, growth opportunities and market conditions.
The forward-looking statements contained in this press release are based on certain key expectations and assumptions made by Saturn, including expectations and assumptions concerning: the timing of and success of future drilling, commodity prices, development and completion activities, the performance of existing wells, the performance of new wells, the availability and performance of facilities and pipelines, the ability to allocate capital to pay down debt and grow or maintain production, the impact of our hedging strategy, the geological characteristics of Saturn's properties, successful integration of acquired assets and realization of anticipated synergies, regulatory approvals, the application of regulatory and licensing requirements, the availability of capital, labour and services, the creditworthiness of industry partners and the ability to integrate acquisitions.
Although Saturn believes that the expectations and assumptions on which the forward-looking statements are based are reasonable, undue reliance should not be placed on the forward-looking statements because Saturn can give no assurance that they will prove to be correct. Since forward-looking statements address future events and conditions, by their very nature they involve inherent risks and uncertainties. Actual results could differ materially from those currently anticipated due to a number of factors and risks. These include, but are not limited to, risks associated with the oil and gas industry in general (e.g., operational risks in development, exploration and production; the uncertainty of reserve estimates; the uncertainty of estimates and projections relating to production, costs and expenses, and health, safety and environmental risks), constraints in the availability of services, commodity price and exchange rate fluctuations, actions of OPEC and OPEC+ members, conflicts in Iran and elsewhere; changes in legislation impacting the oil and gas industry, adverse weather or break-up conditions and uncertainties resulting from potential delays or changes in plans with respect to exploration or development projects or capital expenditures. These and other risks are set out in more detail in Saturn's Annual Information Form for the year ended December 31, 2025, available on SEDAR+ at sedarplus.ca.
Forward-looking information is based on a number of factors and assumptions which have been used to develop such information but which may prove to be incorrect. Although Saturn believes that the expectations reflected in its forward-looking information are reasonable, undue reliance should not be placed on forward-looking information because Saturn can give no assurance that such expectations will prove to be correct. In addition to other factors and assumptions which may be identified in this press release, assumptions have been made regarding and are implicit in, among other things, our capital expenditure and drilling programs, production and revenue guidance, ESG initiatives, debt repayment plans and future growth plans. Readers are cautioned that the foregoing list is not exhaustive of all factors and assumptions which have been used.
The forward-looking information in this news release reflects the Company's current expectations, assumptions and/or beliefs based on information currently available to the Company. The forward-looking information contained in this press release is made as of the date hereof and Saturn undertakes no obligation to update publicly or revise any forward-looking information, whether as a result of new information, future events or otherwise, except as may be required by applicable securities laws. The forward-looking information contained in this press release is expressly qualified by this cautionary statement.
All dollar figures included herein are presented in Canadian dollars, unless otherwise noted.

To view the source version of this press release, please visit https://www.newsfilecorp.com/release/307151
Source: Saturn Oil & Gas Inc.