Vancouver, British Columbia--(Newsfile Corp. - June 16, 2021) - Karus Gold Corp. ("Karus Gold" or the "Company") announces that detailed interpretation of the 2020 drill program validates the Company's exploration thesis that structural controls generate repeating higher-grade gold vein corridors within the previously defined Upper and Lower zones at the FG Gold Project ("Project" or "FG Gold"). FG Gold is part of the Company's 1,000 square kilometer ("km") South Cariboo Gold District in British Columbia (Figure 1).
Highlights
- 2020 drilling defined two higher-grade structurally controlled vein corridors (Figure 2)
- Both corridors extend 650 m along strike and are open for extension
- Provides exploration roadmap for further upgrades and new underground grade discoveries
- Remains open at depth and on-strike for over 20 km to discover additional corridors
- Corridor 1, located 100 meters ("m") down dip of historical drilling and within the "Upper Zone", is traced for 650 m along strike by the following intercepts:
- 10 m of 5.5 g/t gold in FG-20-382
- 4.5 m of 7.7 g/t gold in FG-20-383
- 5.3 m of 10.2 g/t gold in FG-20-385
- 6.6 m of 9.7 g/t gold in FG-20-378
- 12.4 m of 4.3 g/t gold in FG-20-376
- Corridor 2, located 300 m down-dip of historical drilling and within the "Lower Zone", is traced for 650 m along strike by the following intercepts:
- 29 m of 1.5 g/t gold, including 15.5 m of 1.9 g/t gold in FG-20-380
- 7 m of 3.1 g/t gold in FG-20-381
- 17 m of 1.7 g/t gold, including 3 m of 5.8 g/t gold in FG-20-379
- 14.4 m of 6.4 g/t gold in FG-20-377
Karus Gold CEO Andrew Kaip comments, "Results from the 2020 drilling program have set the stage for a 15,000 m drill program in 2021 to: 1) validate our understanding of the controls for high-grade gold mineralization; 2) further step out drilling to expand known corridors; and 3) to discover new corridors of high-grade gold mineralization below and along strike of historical drilling."
FG Gold Structural Controls
Following a review of previously released drill results from the 2020 drill program conducted by KORE Mining Ltd., the technical team at Karus Gold has an increased confidence in the structural controls of higher-grade gold mineralization. The salient features of these high-grade gold corridors are outlined below.
- Typical of sediment hosted orogenic gold deposits, high-grade gold mineralization is localized in zones of increased quartz veining related to deformation of the sedimentary rocks that host FG Gold.
- The favourable stratigraphic unit that is the preferential host to gold mineralization at FG Gold is folded around a large-scale northwest trending synform called the Eureka Syncline shown in Figure 3. Related to, and parallel to this synform are smaller-scale fold zones called parasitic folds. These parasitic folds, or "hinge zones" effectively "thicken" gold bearing veins into the hinges, creating a series of periodic plunge lines containing increased quartz veining and higher-grade gold.
- These zones are roughly parallel to the axial plane of the Eureka Syncline and form elongate corridors oriented in a northwest/southeast direction.
- Hinge zones commonly contain a broad zone of low-grade gold mineralization cored by a higher-grade interval associated with increased quartz veining.
Given an enhanced understanding of the orientation of these high-grade gold corridors the Company believes that intercept below define newly discovered high-grade gold corridors, the dimensions of which will be fully evaluated through further confirmation drilling.
- Corridor 1 - FG-20-382 intersected 42.2 m of 2 g/t gold, including 10 m of 5.5 g/t gold and FG-20-383 returned 48.2 m of 2 g/t gold, including 4.5 m of 7.7 g/t gold, approximately 100 m below historical drilling. FG-20-385, confirms the continuity of gold mineralization 100 m along strike to the northwest and includes 17.7 m of 3 g/t gold, including 5.3 m of 10.2 g/t gold. Three hundred and fifty meters to the northwest, FG-20-378 intersected 62.3 m of 1.7 g/t gold, including 6.6 m of 9.7 g/t gold and FG-20-376, located a further 150 m to the northwest returned 47.9 m of 1.6 g/t gold, including 12.4 m of 4.3 g/t gold are interpreted to be the northwest continuation of Corridor 1. These intersections outline 600 m of strike potential with Corridor 1 open to further extension to the southeast and northwest.
- Corridor 2 - FG-20-381 of 24 m of 1.1 g/t gold, including 7 m of 3.1 g/t gold and FG-20-380, located 100 m to the northwest, of 49.9 m of 1.1 g/t gold, including 15.5 m of 1.9 g/t gold, approximately 300m below historical drilling correlate with Corridor 2. Three hundred meters to the northwest, FG-20-379 intersected 50.5 m of 0.8 g/t gold, including 3 m of 5.8 g/t gold and FG-20-377, located a further 150 meters to the northwest returned 31.4 m of 3.2 g/t gold, including 14.4 m of 6.4 g/t gold, approximately 330m below historical drilling. The intersections outline 600 m of strike potential with Corridor 2 open to further extension to the southeast and northwest.
A plan map of the drill collars and traces is included in Figure 2, including the location of the cross sections in Figures 4 and 5, which show the above-mentioned intercepts related to the development of high-grade gold corridors.
Table of Significant Drill Results that Outline Higher-Grade Gold Corridors
| Drill Hole | Zone | From | To | Length1,2 | Gold Grade3 |
| (m) | (m) | (m) | (g/t) | ||
| FG-20-376 | Corridor 1 | 239.4 | 287.3 | 47.9 | 1.6 |
| incl. | 239.4 | 260.3 | 20.9 | 2.9 | |
| incl. | 239.4 | 251.8 | 12.4 | 4.3 | |
| FG-20-377 | Corridor 2 | 369 | 400.35 | 31.35 | 3.22 |
| incl. | 386 | 400.35 | 14.35 | 6.44 | |
| FG-20-378 | Upper | 174.1 | 177 | 2.9 | 7.7 |
| and | Corridor 1 | 195.9 | 258.3 | 62.3 | 1.7 |
| incl. | 195.9 | 202.5 | 6.6 | 9.7 | |
| incl. | 214 | 224.6 | 10.6 | 1.8 | |
| and | Lower | 236.4 | 250.3 | 13.9 | 1 |
| FG-20-379 | Upper | 286 | 297.5 | 11.5 | 2.4 |
| and | Corridor 2 | 430.1 | 480.5 | 50.5 | 0.8 |
| incl. | 432 | 449 | 17 | 1.7 | |
| incl. | 445 | 448 | 3 | 5.8 | |
| FG-20-380 | Corridor 2 | 346.7 | 396.5 | 49.9 | 1.1 |
| incl. | 349.5 | 378.5 | 29 | 1.5 | |
| incl. | 363 | 378.5 | 15.5 | 1.9 | |
| FG-20-381 | Upper | 272.5 | 287.1 | 14.6 | 0.6 |
| and | Corridor 2 | 333 | 357 | 24 | 1.1 |
| incl. | 344 | 351 | 7 | 3.1 | |
| FG20-382 | Corridor 1 | 122.8 | 165 | 42.2 | 2 |
| incl. | 124 | 134 | 10 | 5.5 | |
| FG20-383 | Upper | 13.3 | 17.6 | 4.3 | 1.8 |
| and | Upper | 46.2 | 48.2 | 2 | 14.5 |
| and | Corridor 1 | 127.6 | 166.5 | 38.9 | 2 |
| incl. | 150 | 154.5 | 4.5 | 7.7 | |
| FG20-384 | Upper | 106.3 | 121.9 | 15.5 | 0.9 |
| incl. | 108.64 | 112.5 | 3.9 | 1.7 | |
| FG20-385 | Upper | 82.5 | 83.74 | 1.2 | 9.4 |
| and | Corridor 1 | 139 | 156.7 | 17.7 | 3.3 |
| incl. | 142.3 | 147.6 | 5.3 | 10.2 |
1. Karus Gold has not been able to determine true width yet due to complexity of the vein structures within the mineralized zones. The 2020 drill program was designed to better understand the geometry and how the mineralized zones are related. The orientation of individual quartz veins within the mineralized zones are quite variable. Reported widths are drill indicated core length and not true width, for the reasons above. Average grades are calculated with un-capped gold assays, as insufficient drilling has been completed to determine capping levels for higher grade gold intercepts.
2. Drilling data on the Lower Zone is currently limited and the true thickness and orientation of the zone is not firmly known. However, based on current data, it is estimated that intercept represents ~50%-65% of the true thickness of the zone.
3. Composites are calculated using a 0.3 g/t Au cutoff, incorporating no more than 7 m downhole dilution. Higher grade composite sections are calculated using a 1 g/t and 3g/t cutoff incorporating no more than 5 m downhole dilution. Screen metallic assay data is present as it is more representative of the true sample value due to the increased sample volume processed and the multiple gold size fractions analyzed.
Regional Geology
The FG Gold property straddles the boundary between the Omineca and Intermontane tectonics belts of the Canadian Cordillera. The eastward emplacement of the Intermontane Belt onto the Omineca Belt along the Eureka Thrust Fault caused widespread regional metamorphism and structural deformation of both Belts. The regional scale, northwest trending, shallowly plunging, Eureka Syncline is the dominant resulting structure in the project area. Rocks in the core of the Eureka Syncline are comprised of basalt, augite porphyry flows, tuffs and volcanic breccias metamorphosed to a low grade; they are structurally emplaced onto metavolcanic and sedimentary rocks of the Quesnel Terrane. The Quesnel Terrane is recognized for its prevalence of copper, gold and molybdenum mines and showings such as those at Highland Valley, Boss Mountain, QR and Mount Polley.
Property Geology
The FG Gold Project is centrally located over the Eureka Syncline, strategically encompassing two limbs and the hinge zone of a gold-bearing meta-sedimentary rock unit of the Quesnel Terrane. FG Gold hosts an orogenic gold project on the northeast limb of the Eureka syncline. The gold-bearing rock, a 'knotted' phyllite, is the host rock for gold mineralization and has been traced for over the 3.5 km strike length by shallow drilling (see Figure 2). Past drilling averages only 93 m deep into a moderately dipping sedimentary host rock. Mineralization is open at depth and along almost the entire trend.
Surface mapping, surface geochemistry and geophysical inversion of airborne electromagnetic (EM) data suggests the knotted phyllite has a strike length of over 20 km with potentially thickened regions occurring in the Eureka Syncline hinge zone. Figure 3 is a regional view to the northwest of the host rock potential of the Eureka syncline and that extends through Eureka Ridge and highlighting the tens of kilometers of exploration potential relative to the area of historical drilling.
The FG Gold Project consists of 35 claims, totaling 13,008 hectares, in the eastern Cariboo region of central British Columbia, approximately 100 km east of Williams Lake. The project is at low elevation and accessible by forestry roads. The Project also hosts copper-gold porphyry mineralization at the Nova Zone, discovered in 2018.
FG Gold is part of Karus Gold's 1,000 km2 South Cariboo Gold District which hosts 110 km of the Eureka thrust structural trend ("Trend") that drives gold mineralization in the District. The Trend is highly prospective for orogenic gold deposits, some of largest in the world, and includes the Company's Gold Creek Project. The Cariboo region is accessible with local power, well developed road network and skilled local labour from multiple current and past operating mines.
More information on the NI 43-101 technical report dated December 16, 2020 "Technical Report on the South Cariboo Gold Property" filed under Karus Gold's Profile on SEDAR at www.sedar.com and on Karus Gold's website at www.karusgold.com.
About Karus Gold
Karus Gold is 100% owner of the 1,000 km2 South Caribou Gold District that includes the drill-stage FG Gold and Gold Creek projects in British Columbia. Karus Gold is supported by strategic investors Eric Sprott; and insiders, together with the management and Board, own approximately 59% of the basic shares outstanding.
Further information on Karus Gold and its assets can be found on the Company's website at www.karusgold.com and at www.sedar.com, or by contacting us as info@karusgold.com or by telephone at (888) 455-7620.
On behalf of Karus Gold
"Andrew Kaip"
Chief Executive Officer
(647) 515-7858
Investor Relations
Nima Shafigh - Kin Communications
(604) 684-6730
KAR@kincommunications.com
QA/QC and Qualified Person
Once the drill core was received from the drill site, individual samples were determined, logged for geological attributes, sawn in half, labelled, and bagged for assay submittal. The remaining drill core was then stored at a secure site in Horsefly, BC. The Company inserted quality control samples at regular intervals within the sample stream which included blanks, preparation duplicates, and standard reference materials with all sample shipments intended to monitor laboratory performance. Sample shipment was conducted under a chain of custody procedure.
Drill core samples were submitted to Bureau Veritas' analytical facility in Vancouver, British Columbia for preparation and analysis. Sample preparation included drying and weighing the samples, crushing the entire sample, and pulverizing 250 grams. Analysis for gold was by method FA450: 50g fire assay fusion with atomic absorption (AAS) finish with a lower limit of 0.005 ppm and upper limit of 10 ppm. Gold assays greater than 10ppm are automatically analyzed by method FA550: 50g fire assay fusion with a gravimetric fusion. Metallic screen techniques were employed to assay gold mineralized zones thought to contain coarse gold. Approximately 1,000 grams of coarse reject material are pulverized and screened. Two splits of the fine fraction are assayed, as well as all material that does not pass through the screen (the coarse fraction). The final gold assay reported is a weighted average of the coarse and fine fractions.
Bureau Veritas is accredited to the ISO/IEC 17025 standard for gold assays, and all analytical methods include quality control materials at set frequencies with established data acceptance criteria. Parameters for Bureau Veritas' internal and Karus Gold's external blind quality control samples were acceptable for the analyses returned.
Technical information with respect to the South Caribou Gold District contained in this news release has been reviewed and approved by Andrew Kaip, P.Geo., who is Karus Gold's CEO and is a qualified person under National Instrument 43-101 responsible for the technical matters of this news release.
Cautionary Statement Regarding Forward-Looking Information
This news release contains forward-looking statements relating to the future operations of the Company and other statements that are not historical facts. Forward-looking statements are often identified by terms such as "will", "may", "should", "anticipate", "expects", "suggests" and similar expressions. All statements other than statements of historical fact, included in this release, including, without limitation, statements regarding the future plans and objectives of the Company are forward-looking statements. Such forward-looking statements, and any assumptions upon which they are based, are made in good faith and reflect our current judgment regarding the direction of our business. Management believes that these assumptions are reasonable. Forward-looking information involves known and unknown risks, uncertainties and other factors which may cause the actual results, performance, or achievements of the Company to be materially different from any future results, performance or achievements expressed or implied by the forward-looking information.
Such factors include, among others: risks related to exploration and development activities at the Company's projects, and factors relating to whether or not mineralization extraction will be commercially viable; risks related to the hazards and risks normally encountered in the exploration of minerals, such as unusual and unexpected geological formations; uncertainties regarding regulatory matters, including obtaining permits and complying with laws and regulations governing exploration, development, production, taxes, labour standards, occupational health, waste disposal, toxic substances, land use, environmental protection, site safety and other matters, and the potential for existing laws and regulations to be amended or more stringently implemented by the relevant authorities; risks related to title to the Company's properties, including the risk that the Company's title may be challenged or impugned by third parties; the ability of the Company to access necessary resources, including mining equipment and crews, on a timely basis and at reasonable cost; competition within the mining industry for the discovery and acquisition of properties from other mining companies, many of which have greater financial, technical and other resources than the Company, for, among other things, the acquisition of mineral claims, leases and other mineral interests as well as for the recruitment and retention of qualified employees and other personnel; access to suitable infrastructure, such as roads, energy and water supplies in the vicinity of the Company's properties; and risks related to the stage of the Company's development, including risks relating to limited financial resources, limited availability of additional financing and potential dilution to existing shareholders; reliance on its management and key personnel; inability to obtain adequate or any insurance; exposure to litigation or similar claims; currently unprofitable operations; risks regarding the ability of the Company and its management to manage growth; and potential conflicts of interest.
Forward-looking statements contained herein are made as of the date of this news release and the Company disclaims any obligation to update any forward-looking statements, whether as a result of new information, future events, or results, except as may be required by applicable securities laws. There can be no assurance that forward-looking information will prove to be accurate, as actual results and future events could differ materially from those anticipated in such statements. Accordingly, readers should not place undue reliance on forward-looking information.
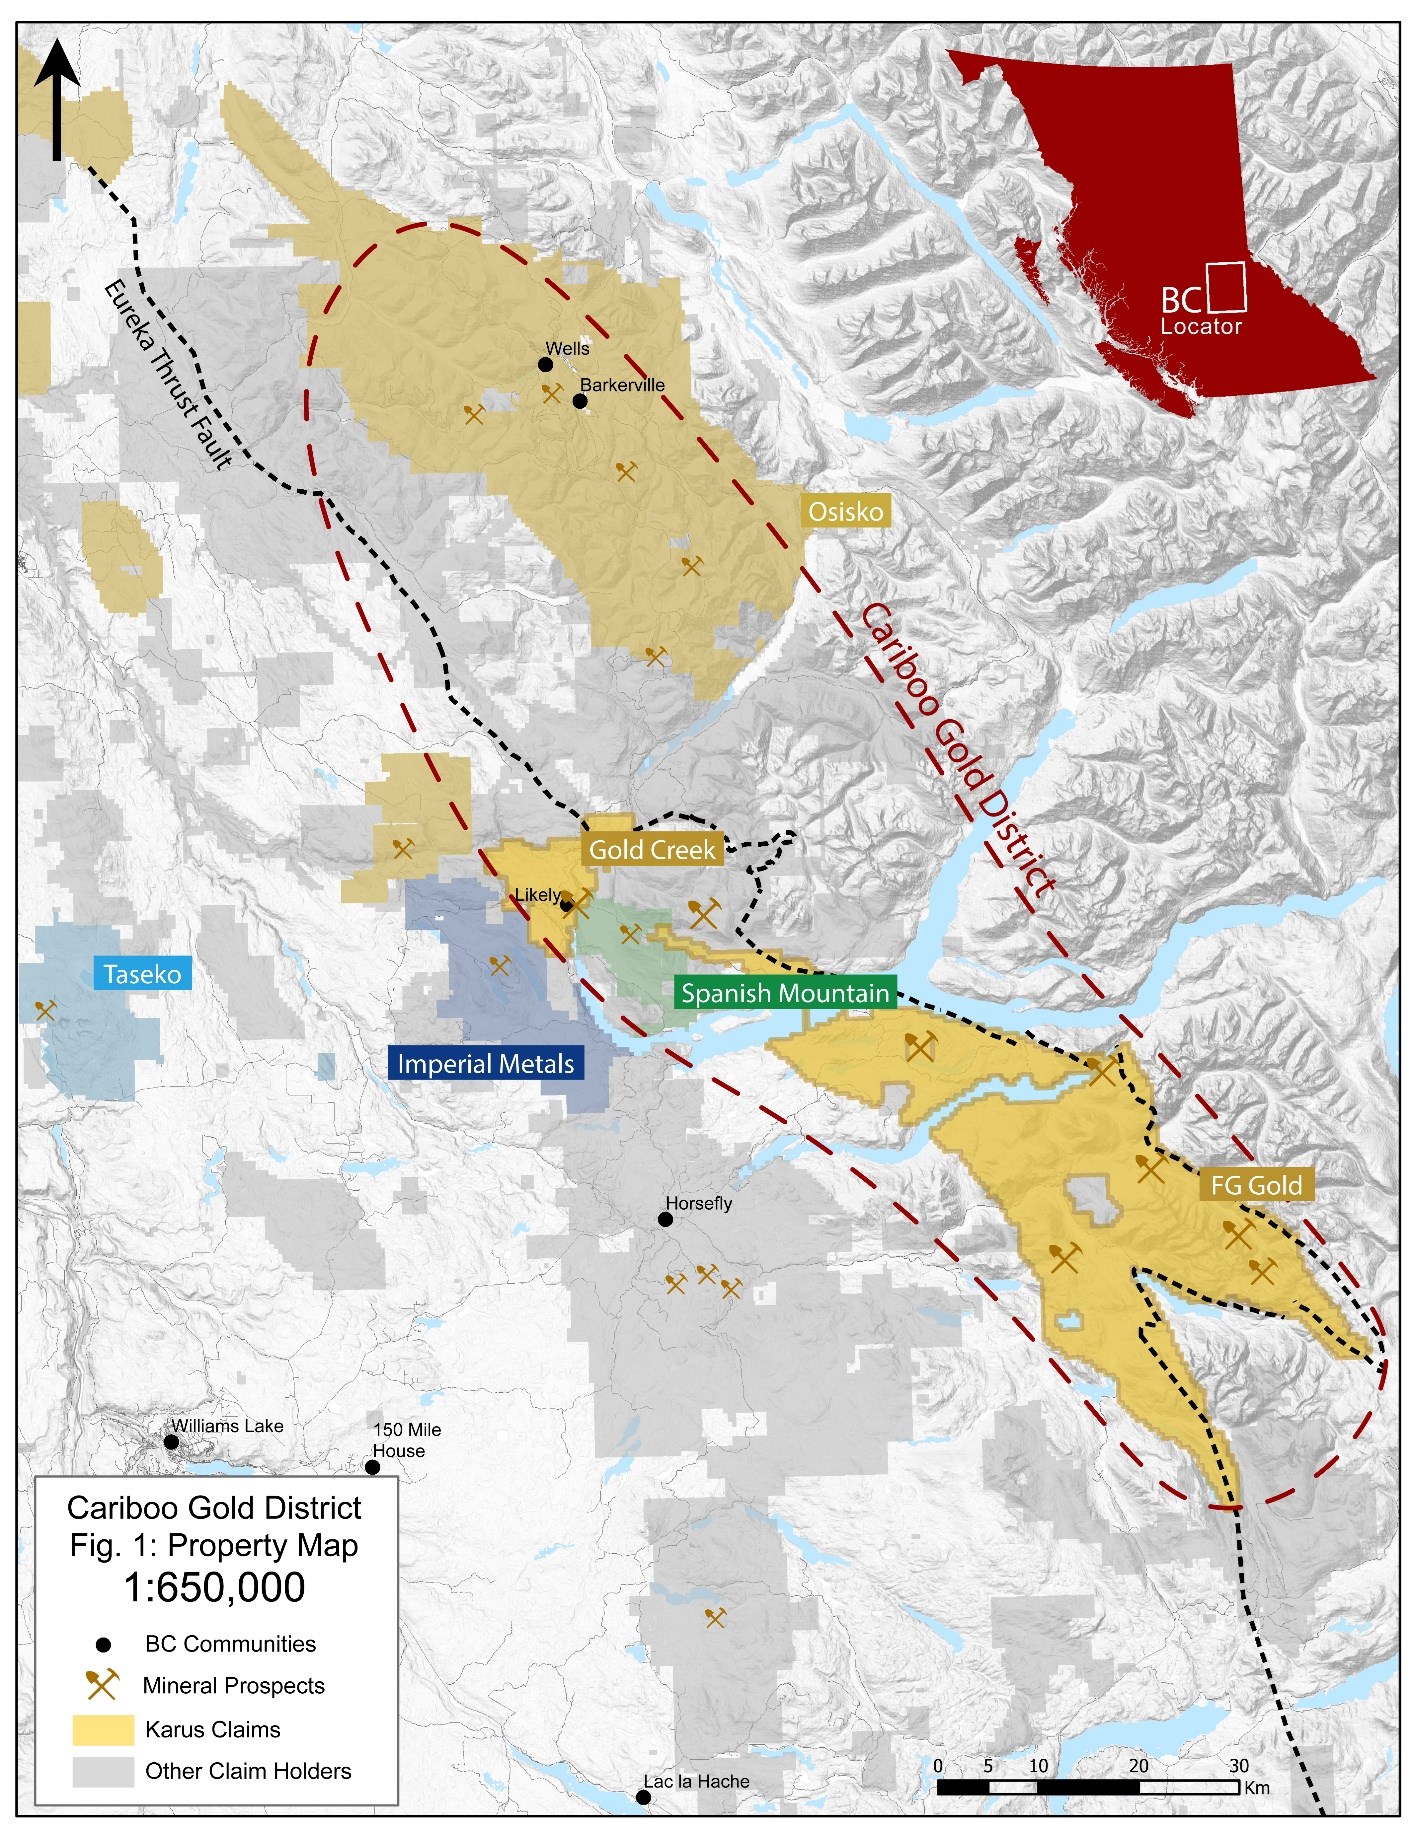
Figure 1. Location of the 1,000 square km South Cariboo Gold District
To view an enhanced version of this graphic, please visit:
https://orders.newsfilecorp.com/files/7720/87794_6352f7d9543c098d_001full.jpg
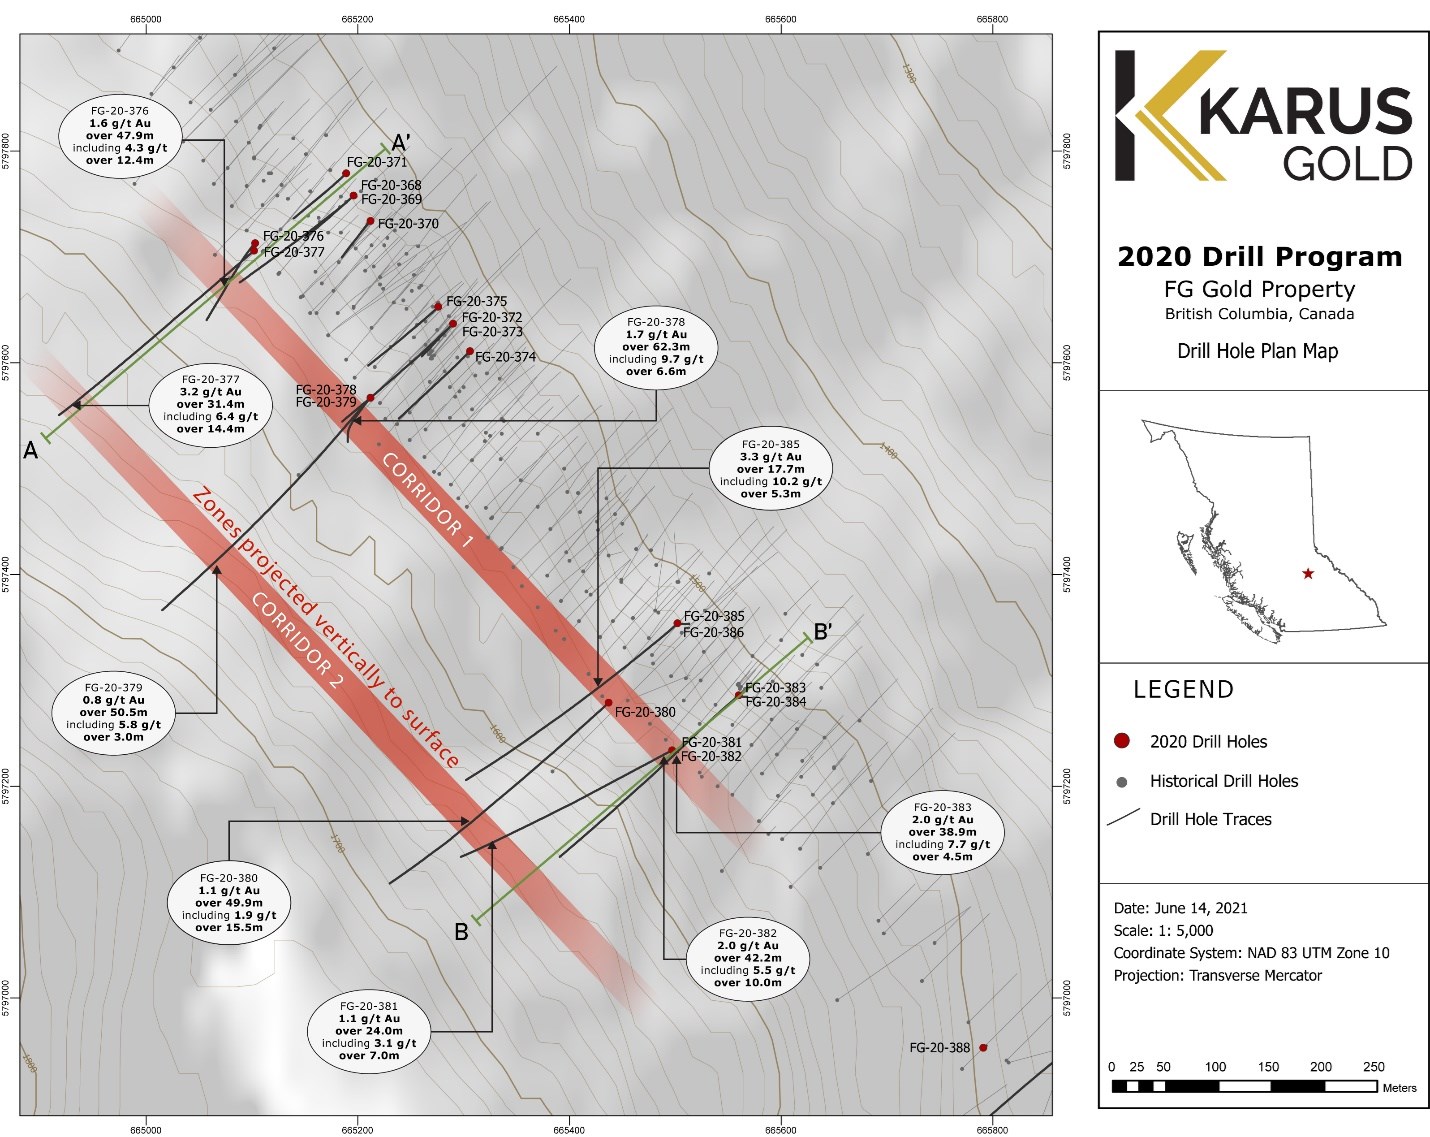
Figure 2. Location of FG Gold High-Grade Gold Corridors and Section Lines
To view an enhanced version of this graphic, please visit:
https://orders.newsfilecorp.com/files/7720/87794_6352f7d9543c098d_002full.jpg

Figure 3. View to the northwest of the Eureka Syncline showing the Property-scale Potential to Expand Gold Mineralization Potential at FG Gold
To view an enhanced version of this graphic, please visit:
https://orders.newsfilecorp.com/files/7720/87794_6352f7d9543c098d_003full.jpg

Figure 4. Cross Section A to A' (View to Northwest)
To view an enhanced version of this graphic, please visit:
https://orders.newsfilecorp.com/files/7720/87794_6352f7d9543c098d_004full.jpg

Figure 5. Cross Section B to B' (View to Northwest)
To view an enhanced version of this graphic, please visit:
https://orders.newsfilecorp.com/files/7720/87794_6352f7d9543c098d_005full.jpg
![]()
To view the source version of this press release, please visit https://www.newsfilecorp.com/release/87794
Source: Karus Mining Inc.