The IDP comprises three development scenarios: Kakula definitive feasibility study (DFS), Kakula-Kansoko pre-feasibility study (PFS), and Kamoa-Kakula preliminary economic assessment (PEA)
■
Ultra-high copper grades; clean, renewable hydropower; and approximately half of tailings stored underground, positions Kamoa-Kakula to produce the world's most environmentally-responsible copper
■
The DFS evaluates the stage-one, 6-million-tonnes-per-annum (Mtpa) Kakula Mine currently being constructed; this first stage yields an after-tax NPV8% of US$5.5 billion, IRR of 77% over a 21-year mine life, and payback of 2.3 years
■
Ivanhoe fully funded to initial production at the Kakula Mine − expected in less than a year. Kakula's expected average ore-feed grade is 6.6% copper, and mine-site cash cost US$0.48/lb. copper, in first five years of operation
■
The PFS evaluates mining 1.6 Mtpa from the Kansoko Mine, in addition to 6 Mtpa from Kakula, to fill a 7.6-Mtpa processing plant at Kakula; this scenario yields an after-tax NPV8% of US$6.6 billion, IRR of 69% over a 37-year mine life, and payback of 2.5 years
■
The PEA evaluates an integrated, multi-staged development to achieve a 19-Mtpa production rate; yielding a potential after-tax NPV8% of US$11.1 billion, IRR of 56% over a plus 40-year mine life, and payback of 3.6 years
■
The phased expansion scenario to 19 Mtpa would position Kamoa-Kakula as the world's second largest copper mining complex, with peak annual copper production of more than 800,000 tonnes
■
Estimated remaining initial capital cost for all three development scenarios is between US$0.6 billion and US$0.7 billion, of which Ivanhoe's share is approximately 50%, with subsequent expansions funded by cash flows
■
Kamoa-Kakula engineers are working to further optimize the mine plan and bring forward, from Q1 2023 to Q2 2022, the expansion of the Kakula processing plant to 7.6 Mtpa
Kolwezi, Democratic Republic of Congo--(Newsfile Corp. - September 8, 2020) - Ivanhoe Mines' (TSX: IVN) (OTCQX: IVPAF) Co-Chairs Robert Friedland and Yufeng "Miles" Sun announced today that the company and its partners, Zijin Mining Group, Crystal River Global Limited and the government of the Democratic Republic of Congo (DRC), welcome the extremely positive findings of an independent definitive feasibility study (DFS) for the development of the Kakula Copper Mine; together with an updated pre-feasibility study (PFS) that includes ore mined from the nearby Kansoko Copper Mine in addition to ore mined from Kakula; and an updated, expanded preliminary economic assessment (PEA) for the overall development plan of all the copper discoveries made to date at the Kamoa-Kakula Project on the Central African Copperbelt in the DRC.
Today's DFS, PFS and updated PEA, collectively referred to as the Kamoa-Kakula Integrated Development Plan 2020 (Kamoa-Kakula IDP20), builds on the excellent results of the previous studies announced in February 2019. The new DFS incorporates the advancement of development and construction activities to date, and has once again confirmed the outstanding economics of the first phase Kakula Mine. As well, the expanded PEA shows the excellent potential to develop the project to a much larger scale and with a significantly larger production capacity.
Economics for all three studies modelled on a 100%-equity basis
"The definitive feasibility study is an independent verification by nine of the world's top engineering firms of the robust economics generated by our initial, 6-Mtpa starter mine at Kakula; while the updated preliminary economic assessment is further validation of Kamoa-Kakula's potential to rapidly expand to become the world's second largest copper mine, with annual copper output of more than 800,000 tonnes," said Mr. Friedland.
"The definitive feasibility study also confirms what we've been telling investors for the past year and a half, and showcasing monthly in our progress galleries - the Kakula Mine is being rapidly built, it is ahead of schedule, and is on budget. The estimated remaining initial capital costs for the phased development at Kamoa-Kakula is US$0.7 billion, of which an estimated US$0.65 billion is to complete the 6-Mtpa mine at Kakula. Our proportionate share of the remaining initial capital costs is approximately 50%, with subsequent expansions funded by cash flows. The economic models assume financing will be on the basis of 100% equity, providing the opportunity to increase returns by leveraging commercial or other debt facilities."
"Most importantly, the Kakula Mine has been designed to produce the world's most environmentally-responsible copper, which is crucial for today's new generation of environmentally- and socially-focused investors.
"Zijin shares our commitment to build the new mines at Kamoa-Kakula to industry-leading standards in terms of resource efficiency, water and energy usage, and minimizing emissions. We are blessed with ultra-high copper grades in thick, shallow and flat-lying orebodies ─ allowing for large-scale, highly-productive, mechanized underground mining operations; and access to abundant clean, sustainable hydro electricity to power our mines ─ providing us with a distinct advantage in our goal to become the world's 'greenest' copper miner and be among the world's lowest greenhouse gas emitters per unit of copper produced.
Hatch Ltd., a leading engineering firm, to independently audit the greenhouse gas intensity metrics for Kamoa-Kakula' copper
Mr. Friedland also said that Kamoa-Kakula recently retained Hatch Ltd., of Mississauga, Canada, a leading, international environmental consulting firm, to independently audit the greenhouse gas intensity metrics for the copper that will be produced at Kamoa-Kakula, demonstrating the company's pledge to be a leader in environmentally-responsible copper mining.
"Kakula is projected to have an average grade of 6.6% copper over the initial five years of operation ─ a grade that is an order of magnitude higher than the majority of the world's other major copper mines. In addition, approximately one half of the mine's tailings will be mixed with cement and pumped back underground to fill mined-out voids, resulting in a surface tailings containment facility that is tiny compared to other major mines.
"Massive, high-grade deposits like we have found at Kamoa-Kakula ─ which have the potential to produce large quantities of copper for multiple generations ─ are very long-term plays. Conventional discounted cash flow analysis does not appropriately appraise the long-term option value inherent in tier one assets like Kamoa-Kakula. As history has shown, such large-scale assets that produce for decades − through multiple commodity cycles − tend to generate profound value through phased expansions and exploration over their mine lives.
"People involved in the mining industry understand how incredibly challenging and time consuming it is to discover, permit, and build a tier-one mine anywhere in the world today. Kamoa-Kakula's success is a testament to the perseverance and entrepreneurial spirit of the entire Ivanhoe management team; our talented employees at Kamoa-Kakula, comprised mainly of bright, young Congolese men and women; as well as the outstanding cooperation and teamwork of our joint-venture partners − Zijin Mining, Crystal River and the government of the DRC.
"Kakula is on track to begin production in under one year from now, which, considering we've been working in Africa for 27 years now, feels like tomorrow morning. I look forward to welcoming our loyal institutional shareholders, mining analysts and government supporters to our grand opening ceremony to witness firsthand the state-of-the-art mining complex we are building at Kamoa-Kakula. Our guests also will see the remarkable, recent infrastructure upgrades in the area around our project, including new highways, power plants and transmission lines," Mr. Friedland concluded.
Developing the world's next great copper district
Mr. Sun commented: "In our journey to build Kamoa-Kakula and our adjoining, wholly-owned Western Foreland exploration licences, into the world's next great copper district, Kakula is the first step. Our opportunity for value creation for all stakeholders is tremendous. Together with the DRC government and our Chinese partners, we are united in our shared objective of ensuring that the major copper discoveries we have made at Kamoa and Kakula, and the new discoveries still to come, can be predictably, efficiently and expeditiously developed into a world-scale mining venture with a lifespan of multiple generations."
"We will continue working closely with our partners and the Congolese people to realize the full potential of Kamoa-Kakula and Western Foreland, generating widely-shared economic benefits and providing skills training to young Congolese women and men for the thousands of meaningful direct and indirect jobs that will be created in the years ahead," Mr. Sun added.
Kamoa-Kakula providing good, well-paying jobs for local Congolese and meaningful community benefits
Marna Cloete, Ivanhoe President and CFO, said: "Approximately 85% of our 4,700-strong workforce at Kamoa-Kakula are Congolese from nearby communities in Lualaba Province, and we continue to train and develop our local employees into management positions. We are extremely proud of our talented team of Congolese women and men."
"We also are very proud of the meaningful community benefits and economic opportunities generated by our Sustainable Livelihoods team at Kamoa-Kakula, including new schools, housing, clinics, fish farms and sustainable agriculture initiatives, and enterprise development opportunities in the project's supply chain for local community members."
Development scenarios at Kamoa-Kakula
The Kamoa-Kakula Integrated Development Plan 2020 encompasses three development scenarios:
- Definitive feasibility study for stage one Kakula Mine development. The Kakula 2020 DFS evaluates the development of a stage one, 6-Mtpa underground mine and surface processing complex at the Kakula Deposit with a capacity of 7.6 Mtpa, built in two modules of 3.8 Mtpa, with the first already under advanced construction.
- Pre-feasibility study including Kansoko Mine development. The Kakula-Kansoko 2020 PFS evaluates the development of mining activities at the Kansoko Deposit in addition to the Kakula Mine, initially at a rate of 1.6 Mtpa to fill the concentrator at Kakula, eventually ramping up to 6 Mtpa as the reserves at Kakula are depleted.
- Expanded, subsequent development to four producing mines. The Kamoa-Kakula 2020 PEA includes an analysis of the potential for an integrated, 19-Mtpa, multi-stage development, beginning with initial production from the Kakula Mine, to be followed by subsequent, separate underground mining operations at the nearby Kansoko, Kakula West and Kamoa North mines, along with the construction of a direct-to-blister smelter. The Kamoa North Area comprises five separate mines that would be developed as resources are mined out elsewhere, to maintain the production rate at up to 19 Mtpa, with an overall life in excess of 40 years.
The Kamoa-Kakula IDP20, which includes the Kakula 2020 DFS, Kakula-Kansoko 2020 PFS and Kamoa-Kakula 2020 PEA, was independently prepared on a 100%-basis by OreWin Pty Ltd. of Adelaide, Australia; China Nerin Engineering Co., Ltd., of Jiangxi, China; DRA Global of Johannesburg, South Africa; Epoch Resources of Johannesburg, South Africa; Golder Associates Africa of Midrand, South Africa; KGHM Cuprum R&D Centre Ltd. of Wroclaw, Poland; Outotec Oyj of Helsinki, Finland; Paterson and Cooke of Cape Town, South Africa; Stantec Consulting International LLC of Phoenix, USA; SRK Consulting Inc. of Johannesburg, South Africa; and Wood plc of Reno, USA.
The Kamoa-Kakula 2020 PEA is preliminary in nature and includes an economic analysis that is based, in part, on Inferred Mineral Resources. Inferred Mineral Resources are considered too speculative geologically for the application of economic considerations that would allow them to be categorized as Mineral Reserves - and there is no certainty that the results will be realized. Mineral Resources do not have demonstrated economic viability and are not Mineral Reserves.
A National Instrument 43-101 technical report will be filed on SEDAR at www.sedar.com and on the Ivanhoe Mines website at www.ivanhoemines.com within 45 days of the issuance of this news release.
First copper production expected in less than a year
On September 1, 2020, Ivanhoe Mines issued a detailed update on the development and construction progress being made at the Kakula and Kansoko mines. Underground development at the Kakula Copper Mine totalled 1,842 metres in August, bringing the cumulative total underground development completed to date to more than 20.6 kilometres - 6.0 kilometres ahead of schedule. A second mining crew was recently added at Kamoa-Kakula's second underground mine - Kansoko - providing the project with another source of high-grade copper ore.
At the end of August, the project's pre-production surface ore stockpiles totalled an estimated 671,000 tonnes grading 3.36% copper, including 116,000 tonnes of high-grade ore grading 6.08% copper. The stockpiles grade will continue to increase as the project approaches initial production, as beginning this month the majority of mining at Kakula is expected to be in ore zones near the centre of the deposit that have copper grades of between 5% and 8%.
Installation of ball mills and other major equipment for Kakula's first, 3.8-Mtpa processing plant module is well underway. The final shipments of long-lead equipment for the processing plant are scheduled to arrive at site by the end of September, 2020.
Ivanhoe is fully funded to first copper production at Kamoa-Kakula, which is scheduled to begin in less than one year from now, in Q3 2021.
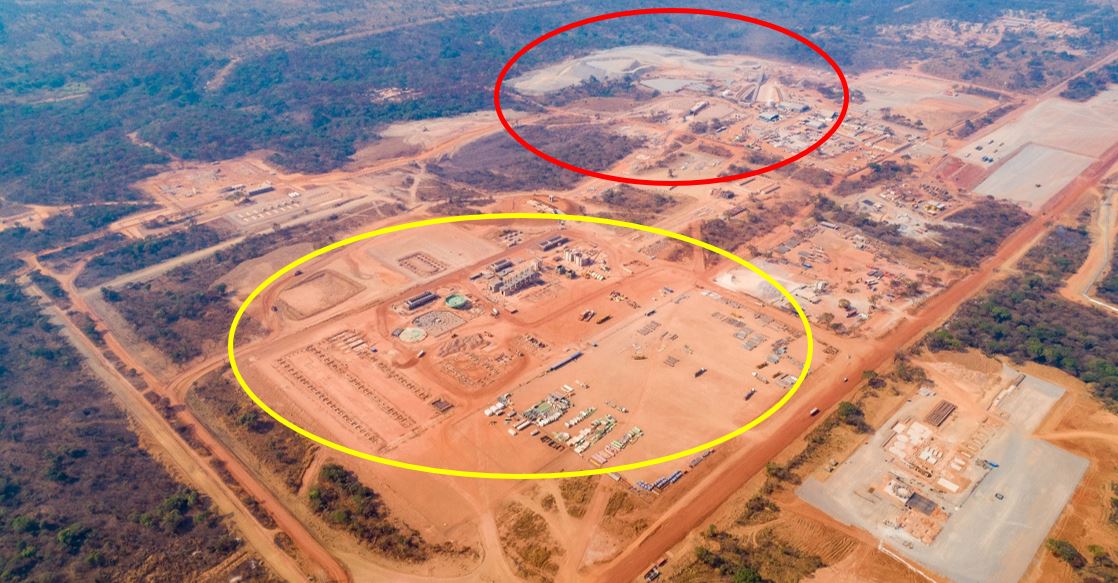
Aerial view of the Kakula Mine. The growing pre-production stockpile of high-grade copper ore and Kakula main northern decline is in the red circle; the initial 3.8-Mtpa processing plant under construction and the area that will be used to expand the processing plant to 7.6 Mtpa − currently being used as an equipment lay-down area - are both are in the yellow circle.
To view an enhanced version of the aerial view of the Kakula Mine please visit:
https://orders.newsfilecorp.com/files/3396/63350_image1_orig.jpg

One of Kakula's new, high-productivity, 63-tonne underground ore trucks from Sandvik, of Stockholm, Sweden. Designed with operator safety in mind, the truck also is equipped with an air-conditioned cabin.
To view an enhanced version of the ore truck, please visit:
https://orders.newsfilecorp.com/files/3396/63350_6e9d6712f44748ed_005full.jpg

In late August, the discharge end, trunnion and shells were installed for the 9.75-metre-long and 6.1-metre-wide primary ball mill - the first of two identical ball mills that will be used to grind the copper ore at Kakula's initial 3.8-Mtpa processing plant.
To view an enhanced version of the primary ball mill, please visit:
https://orders.newsfilecorp.com/files/3396/63350_6e9d6712f44748ed_006full.jpg

A 400-tonne crane lifting the structural steel flotation platforms onto concrete foundations at Kakula's initial 3.8-Mtpa processing plant.
To view an enhanced version of the 400-tonne crane, please visit:
https://orders.newsfilecorp.com/files/3396/63350_6e9d6712f44748ed_007full.jpg
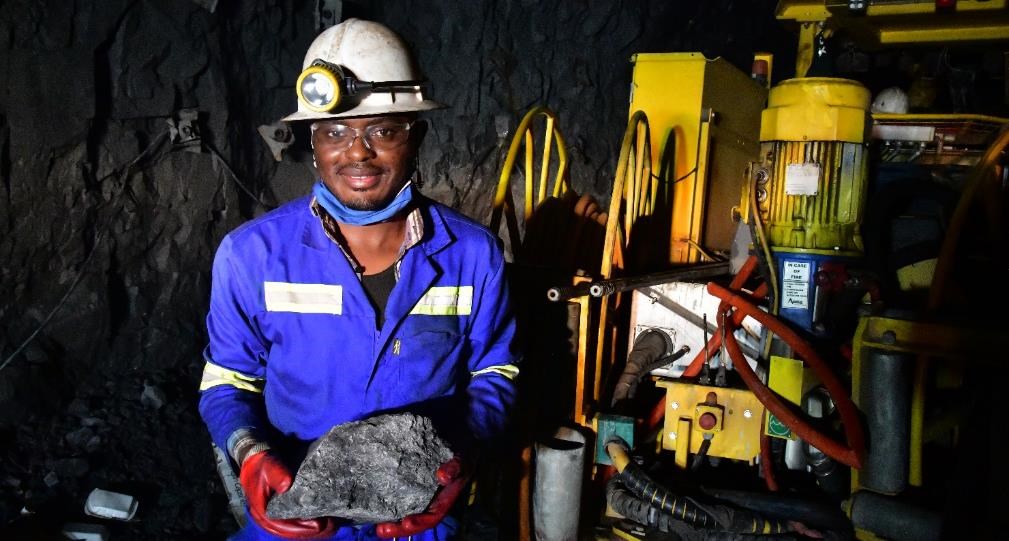
Miner Freddy Muba holds a piece of ultra-high-grade, chalcocite-rich ore at the Kakula Mine. Kakula's high concentration of chalcocite ore - which is almost 80% copper by weight − accounts for the mine's average feed grade of 6.6% copper over the first five years of operations, and 5.2% copper on average over a 21-year life.
To view an enhanced version of Freddy Muba, please visit:
https://orders.newsfilecorp.com/files/3396/63350_6e9d6712f44748ed_008full.jpg

Map of the Kamoa-Kakula mining licence showing the Kakula and Kansoko mining areas, as well as Kakula West, Kamoa North, Kamoa Far North, Kamoa North Bonanza Zone and a portion of Ivanhoe's adjacent, 100%-owned Western Foreland exploration-licences area.
To view an enhanced version of the Map of the Kamoa-Kakula please visit:
https://orders.newsfilecorp.com/files/3396/63350_6e9d6712f44748ed_009full.jpg
HIGHLIGHTS
Initial 6 Mtpa mine at Kakula
- The Kakula 2020 DFS evaluates the development of a stage one, 6-Mtpa underground mine with a surface processing complex at the Kakula Deposit with a capacity of 7.6 Mtpa, built in two modules of 3.8 Mtpa, with the first already under advanced construction. For this option, the DFS envisages an average annual production rate of 284,000 tonnes of copper at a mine-site cash cost of US$0.52 per pound (lb.) copper and total cash cost of US$1.16/lb. copper for the first 10 years of operations, and annual copper production of up to 366,000 tonnes by year four.
- Remaining initial capital cost of US$0.65 billion for this option would result in an after-tax net present value at an 8% discount rate (NPV8%) of US$5.5 billion. The internal rate of return of 77.0% and project payback period of 2.3 years confirm the compelling economics for the Kamoa-Kakula Project's stage one of production.
- Ivanhoe and Zijin will each fund its respective share of approximately 40% of the remaining initial capital costs, plus its share of capital on behalf of the 20% interest owned by the Government of the DRC, of which 5% is non-dilutable and 15% is carried and will be repaid through future cash flows from the project. Ivanhoe's proportional share of the remaining initial capital cost for the stage one, 6-Mtpa underground mine is approximately US$0.32 billion.
- Kakula benefits from an ultra-high, average feed grade of 6.6% copper over the first five years of operations, and 5.2% copper on average over a 21-year mine life.
- Underground development at Kakula continues to advance ahead of schedule. More than 20.6 kilometres of underground development has been completed to the end of August ─ approximately 6.0 kilometres ahead of plan. The pace of development is expected to continue to accelerate as additional mining crews are added. Initial copper concentrate production is scheduled for Q3 2021.
- Construction of Kakula's initial 3.8-Mtpa processing plant is well underway, with manufacturing of all long-lead mechanical items complete, with the crushers, low-entrainment flotation cells and the concentrate filter delivered to site.
Kakula-Kansoko 2020 PFS including Kansoko mine development
- The Kakula-Kansoko 2020 PFS evaluates the development of mining activities at the Kansoko Deposit in addition to Kakula, initially at a rate of 1.6 Mtpa to fill the 7.6-Mtpa concentrator at Kakula, eventually ramping up to 6 Mtpa as the reserves at Kakula are depleted. For this option, the PFS envisages an average annual production rate of 331,000 tonnes of copper at a mine-site cash cost of US$0.55/lb. copper and total cash cost of US$1.23/lb. copper for the first 10 years of operations, and annual copper production of up to 427,000 tonnes by year four.
- Remaining initial capital cost of US$0.69 billion for this option would result in an after-tax net present value at an 8% discount rate (NPV8%) of US$6.6 billion. The internal rate of return of 69.0% and project payback period of 2.5 years confirm the compelling economics of Kakula and Kansoko.
- Ivanhoe's proportional share of the remaining initial capital cost of this option is approximately US$0.35 billion for the Kakula-Kansoko 2020 PFS.
- Kakula-Kansoko benefits from an ultra-high, average feed grade of 6.2% copper over the first five years of operations, and 4.5% copper on average over a 37-year mine life.
- There are currently two mining crews at Kansoko, in addition to the 10 mining crews (three owner crews and seven contractor crews) currently at Kakula, with the ability to increase this number to fast-track the development of Kansoko.
Modular, integrated, expanded development option potential for the Kakula and Kamoa deposits, mining a total of 19 Mtpa, with construction of a direct-to-blister smelter
- The Kamoa-Kakula 2020 PEA presents an additional development option of a multi-stage, sequential operation on Kamoa-Kakula's high-grade copper deposits.
- Initial production from the Kakula Mine at a rate of 6 Mtpa, followed by subsequent, separate underground mining operations at the nearby Kansoko, Kakula West and Kamoa North mines, along with the construction of a direct-to-blister smelter. The Kamoa North Area comprises five separate mines that will be developed as resources are mined out elsewhere, to maintain the production rate at up to 19 Mtpa, with an overall life in excess of 40 years.
- For the integrated, 19-Mtpa, multi-stage development, the PEA envisages US$0.7 billion in remaining initial capital costs. Future expansion at the Kansoko Mine, Kakula West Mine and Kamoa North mines would be funded by cash flows from the Kakula Mine, resulting in an after-tax net present value at an 8% discount rate (NPV8%) of US$11.1 billion, an internal rate of return of 56.2%, and a payback period of 3.6 years.
- Ivanhoe's proportional share of the remaining initial capital cost of this option is approximately US$0.36 billion for the Kamoa-Kakula 2020 PEA.
- Under this approach, the PEA also contemplates the construction of a direct-to-blister copper smelter at the Kakula plant site with a capacity to process one million tonnes of copper concentrate per annum to be funded from internal cash flows. This would be completed in year five of operations, achieving significant savings in treatment charges and transportation costs.
- The 19-Mtpa scenario shows the potential for average annual production of 501,000 tonnes of copper at a total cash cost of US$1.07/lb. copper during the first 10 years of operations and production of 805,000 tonnes of copper by year 8. At this future production rate, Kamoa-Kakula would rank as the world's second largest copper mine.
Ivanhoe to host Investor Day on September 10, 2020, to discuss new Kamoa-Kakula studies
On September 10, 2020, Ivanhoe will host a virtual Investor Day to discuss the findings of the DFS, PFS and PEA for the Kamoa-Kakula Copper Project, including various options under consideration to accelerate the planned expansions. The Investor Day will include a virtual site tour of the Kamoa-Kakula Project, as well as remarks from Ivanhoe's Co-Chairs Robert Friedland and Yufeng "Miles" Sun; the company's President and CFO, Marna Cloete; and members of the company's corporate development and technical teams. It also will feature a question and answer session.
DATE: September 10, 2020
TIME: 10am Eastern / 7am Pacific / 3pm London / 10pm Beijing
REGISTRATION LINK: https://event.on24.com/wcc/r/2371357/F674EFB1FE64355340FB5668B20AC76A
Figure 1 illustrates the expanded development scenario for the Kamoa-Kakula 2020 PEA and Figure 2 shows an overview of deposits included within the Kakula 2020 DFS (6-Mtpa case), Kakula-Kansoko 2020 PFS (7.6 Mtpa) and Kamoa-Kakula 2020 PEA (19 Mtpa). Additional exploration success at Kakula West, Kamoa North or regional exploration targets may well have a significant, positive influence on the size, value and timing of the overall development plan.
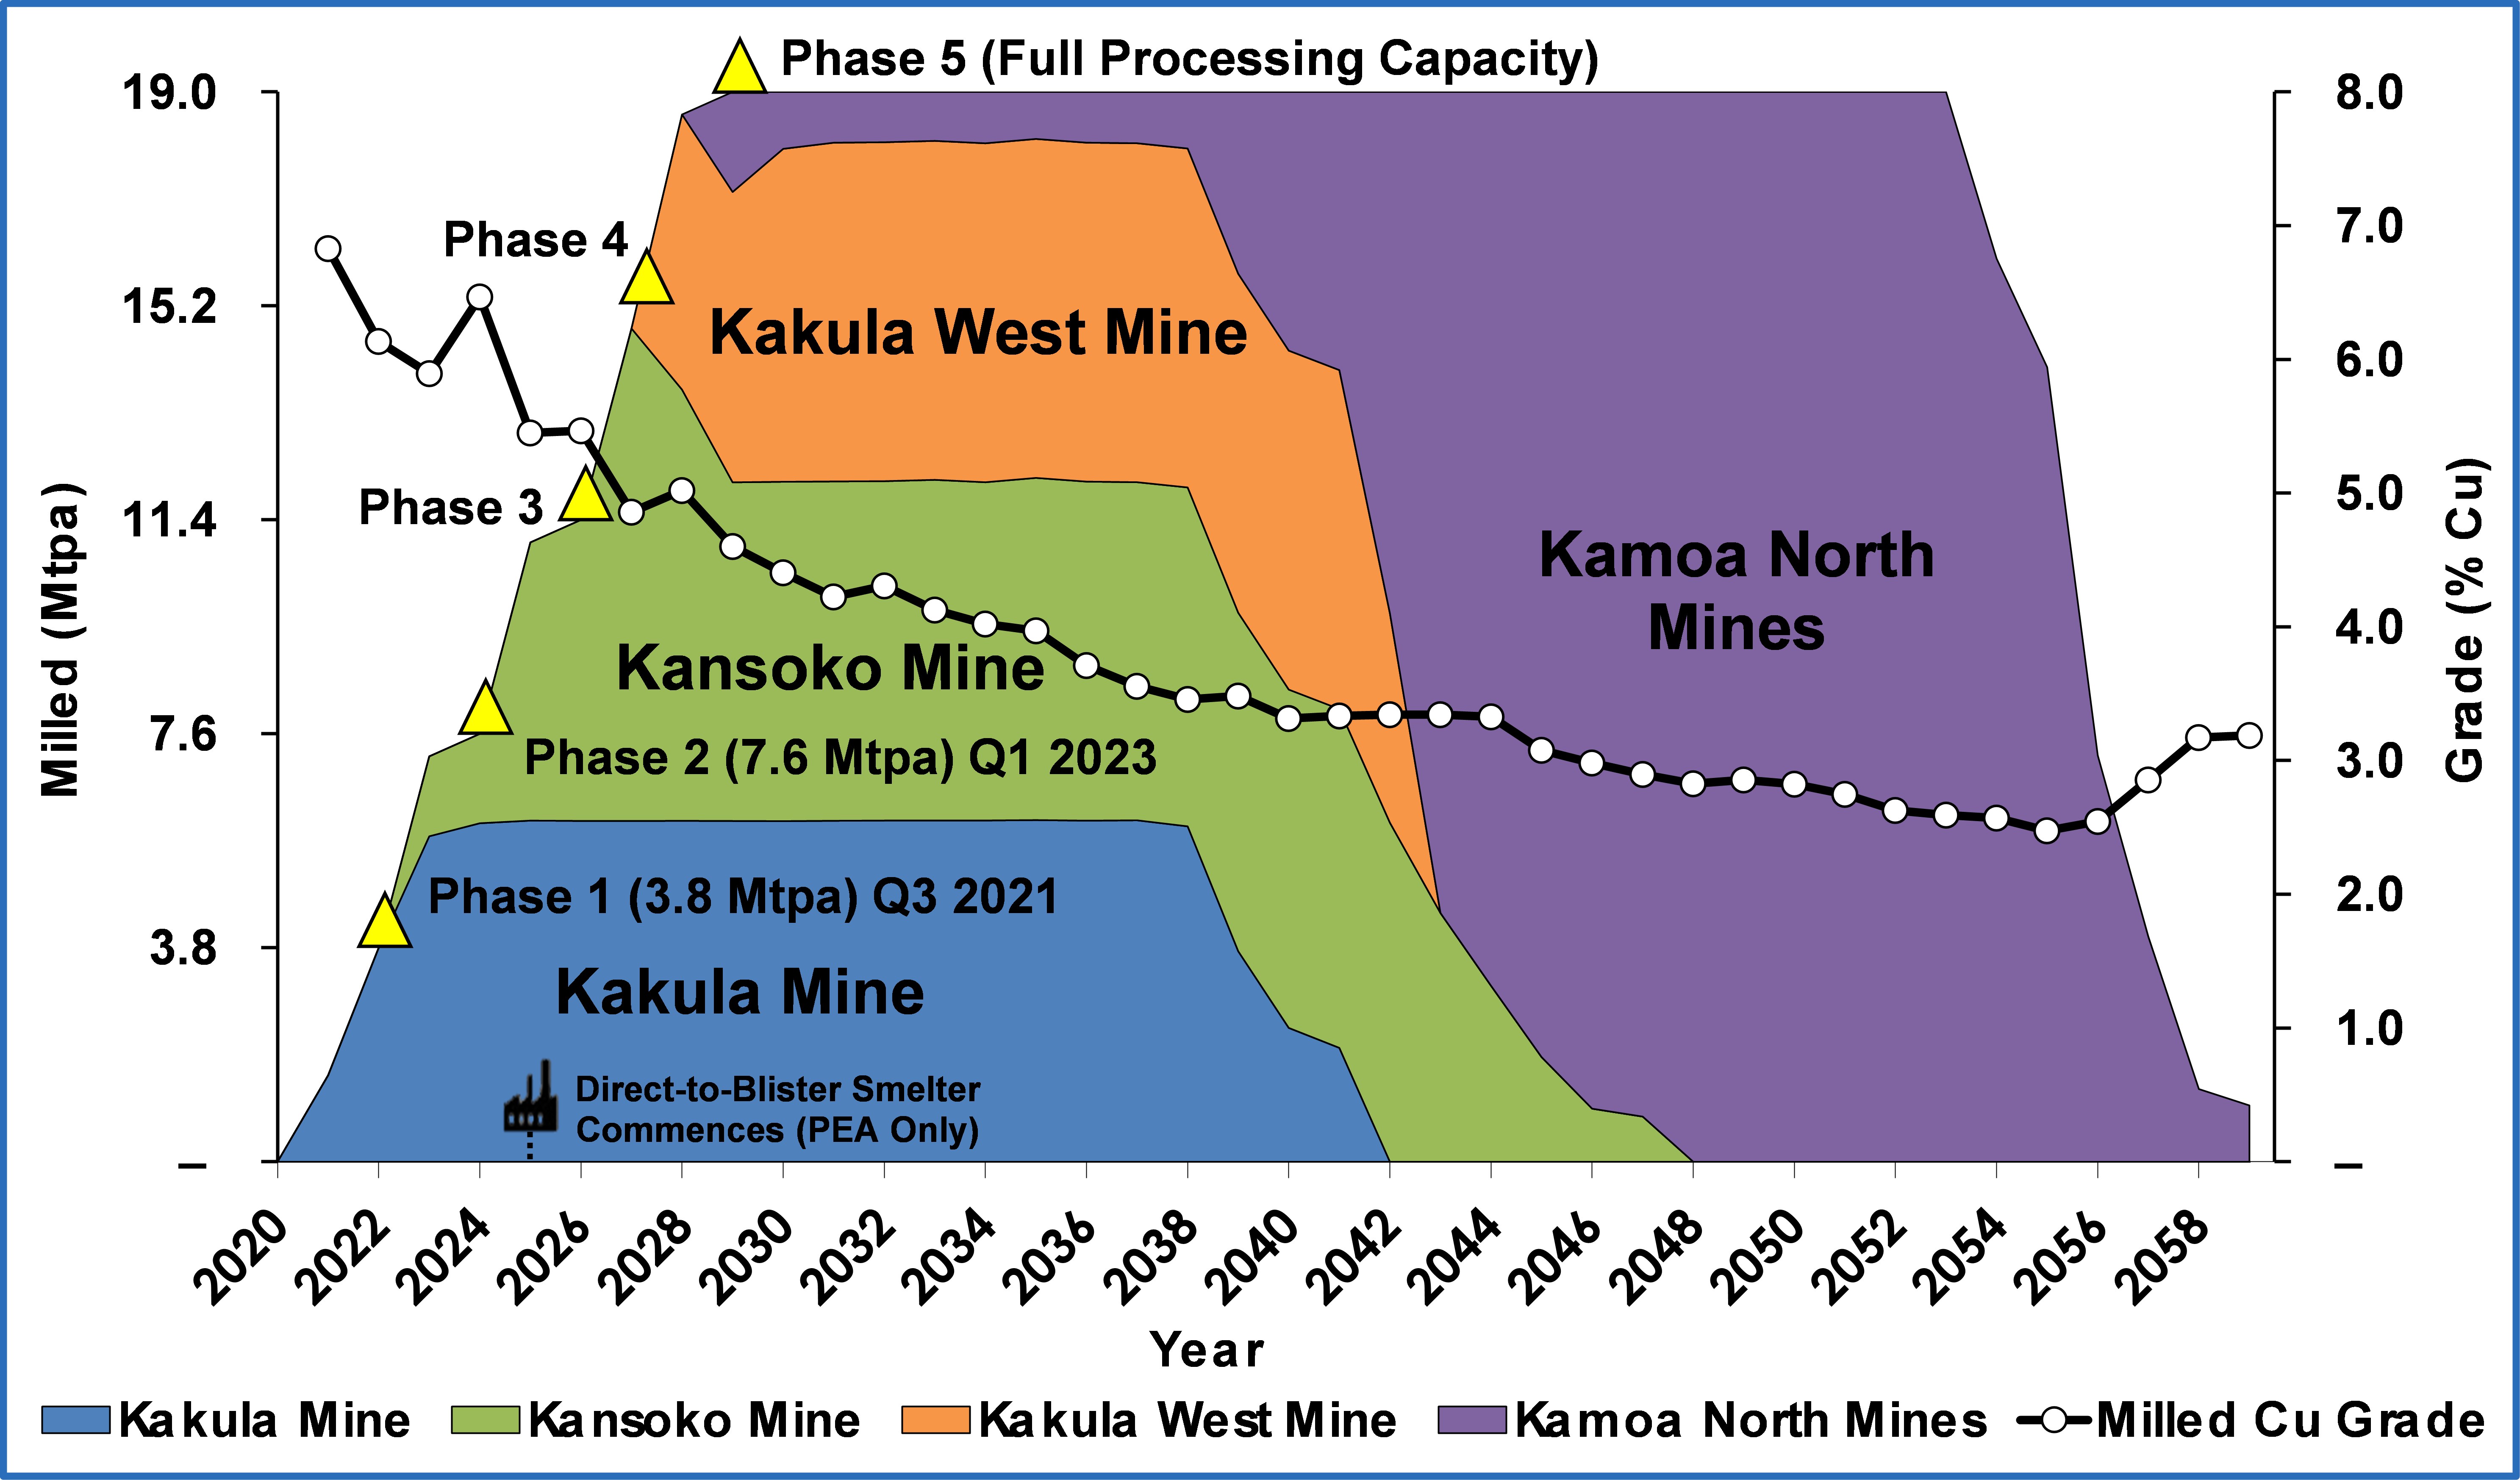
Figure 1. Kamoa-Kakula 19-Mtpa PEA long-term development plan. Figure by OreWin 2020.
To view an enhanced version of Figure 1, please visit:
https://orders.newsfilecorp.com/files/3396/63350_6e9d6712f44748ed_010full.jpg

Figure 2. Overview of deposits included within the Kakula 2020 DFS (6 Mtpa ─ outlined by blue dotted line), Kakula-Kansoko 2020 PFS (7.6 Mtpa ─ outlined by purple dotted line) and Kamoa-Kakula 2020 PEA (outlined by green dotted line). Figure by OreWin 2020.
To view an enhanced version of Figure 2, please visit:
https://orders.newsfilecorp.com/files/3396/63350_6e9d6712f44748ed_011full.jpg
Summary of the DFS's key results for the initial Kakula Mine
- Very-high-grade, stage-one production is projected to have a grade of 7.1% copper in the fourth year of production and an average grade of 6.2% copper over the initial 10 years of operations, resulting in estimated average annual copper production of 284,000 tonnes.
- Annual copper production is estimated at 366,000 tonnes in year four.
- Remaining initial capital cost, including contingency, is estimated at US$0.65 billion as of July 1, 2020. Ivanhoe's proportional share is approximately US$0.32 billion.
- Average total cash cost of US$1.16/lb. copper during the first 10 years, inclusive of royalties.
- After-tax NPV, at an 8% discount rate, of US$5.5 billion.
- After-tax internal rate of return (IRR) of 77.0%, and a payback period of 2.3 years.
- Kakula is expected to produce a very-high-grade copper concentrate of approximately 57% copper, with extremely low arsenic levels.
Key initial projections from the Kakula 2020 DFS
The study evaluates the development of a stage one, 6-Mtpa underground mine and surface processing complex at the Kakula Deposit of 7.6 Mtpa, built in two modules of 3.8 Mtpa, with the first already under advanced construction. The first module of 3.8 Mtpa commences production in Q3 2021, and the second in Q1 2023. The life-of-mine production scenario provides for 110 million tonnes to be mined at an average grade of 5.22% copper, producing 8.5 million tonnes of high-grade copper concentrate, containing approximately 10.8 billion pounds of copper.
The economic analysis uses a consensus, real long-term copper price of US$3.10/lb. (excluding inflation) and returns an after-tax NPV at an 8% discount rate of US$5.5 billion. It has an after-tax IRR of 77.0% and a payback period of 2.3 years.
The estimated remaining initial capital cost, including contingency, is US$0.65 billion from July 1, 2020. The capital expenditure for off-site power, which is included in the remaining initial capital cost, includes advances to the DRC state-owned electricity company, Société Nationale d'Electricité (SNEL), to upgrade two hydropower plants (Koni and Mwadingusha) to provide the Kamoa-Kakula Project with access to clean electricity for its planned operations. The hydro-power upgrading work is being led by Stucky Ltd., of Renens, Switzerland, and the advance payments will be recovered by Kamoa-Kakula through a reduction in the power tariffs paid.
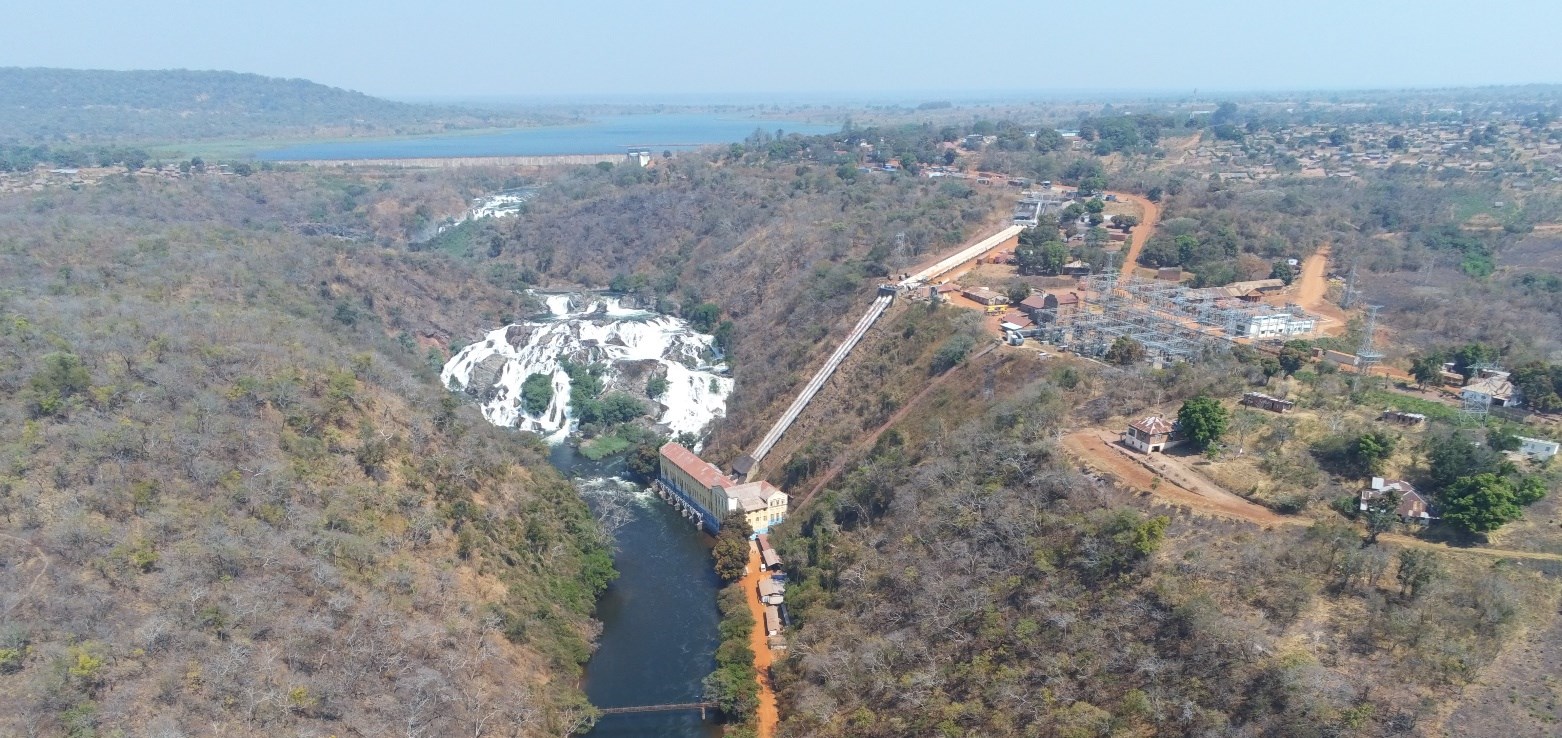
Aerial picture of the Mwadingusha hydro-electric dam and power plant, with the new installed penstocks. Mwadingusha will soon be delivering 72 megawatts (MW) of clean, sustainable hydro-electricity to the national grid. The Kakula Mine is scheduled to be energized with permanent, 220-kilovolt (kV), hydro-generated power from the national grid in early 2021.
To view an enhanced version of the Mwadingusha hydro-electric dam and power plant, please visit:
https://orders.newsfilecorp.com/files/3396/63350_6e9d6712f44748ed_012full.jpg
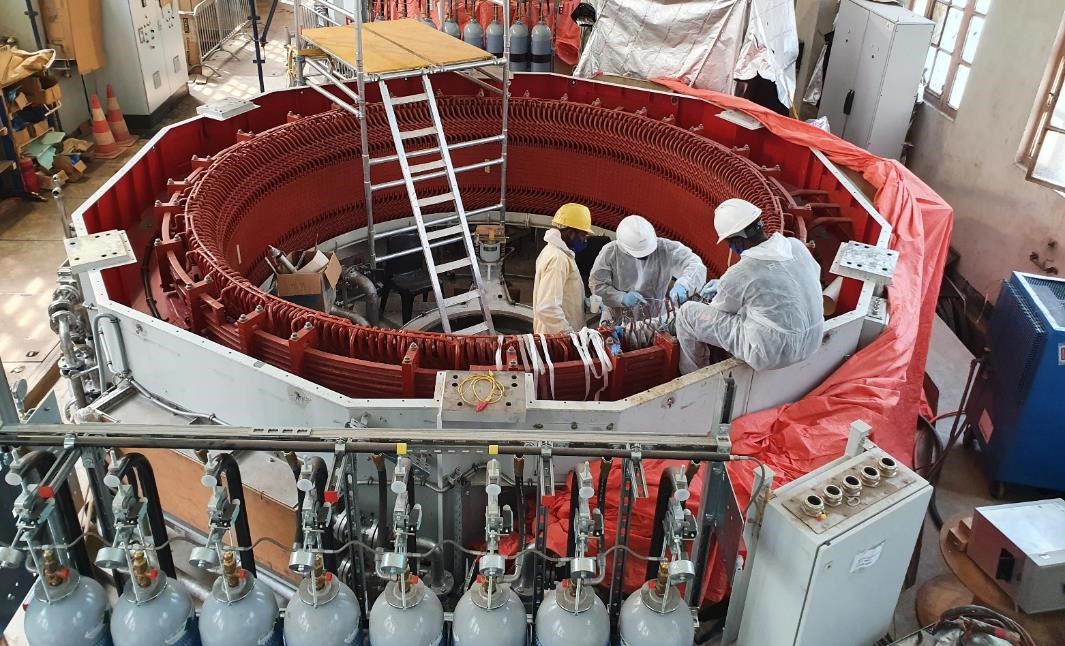
Engineers assembling a new alternator stator at the Mwadingusha power plant.
To view an enhanced version of the new alternator stator, please visit:
https://orders.newsfilecorp.com/files/3396/63350_6e9d6712f44748ed_013full.jpg
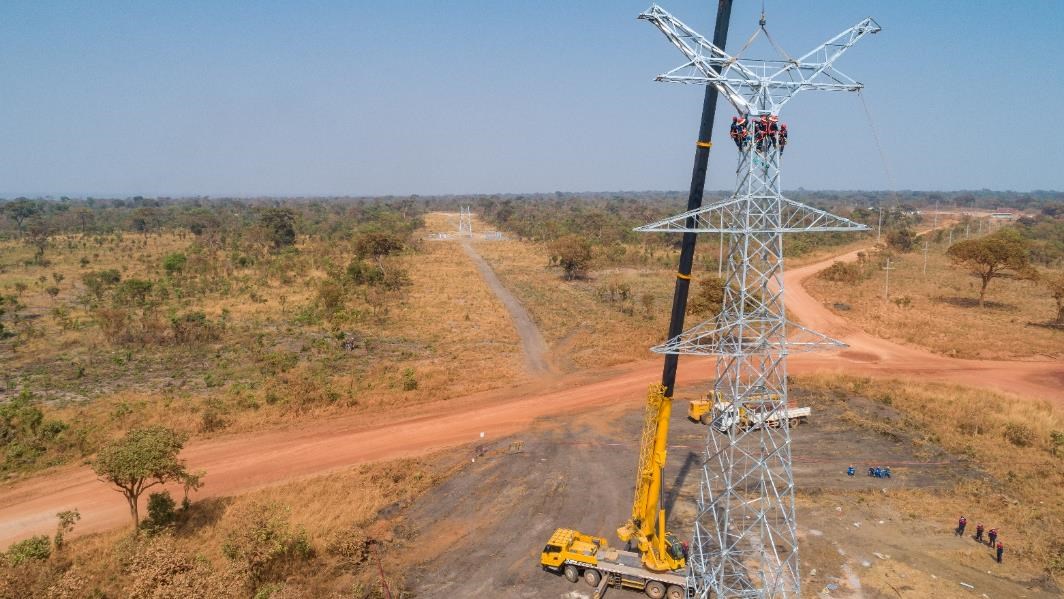
Hydro workers erecting a transmission tower for the new 35-kilometre powerline that will carry high-voltage hydro-electricity from the national grid to Kamoa-Kakula.
To view an enhanced version of hydro workers erecting a transmission tower, please visit:
https://orders.newsfilecorp.com/files/3396/63350_6e9d6712f44748ed_014full.jpg
Key results of the Kakula 2020 DFS for a single 6-Mtpa mine are summarized in Table 1.
Table 1. Kakula Mine results summary for 6-Mtpa production.
| Item | Unit | Total |
| Total Processed | ||
| Quantity Milled | kt | 109,975 |
| Copper Feed Grade | % | 5.22 |
| Total Concentrate Produced | ||
| Copper Concentrate Produced | kt (dry) | 8,542 |
| Copper Recovery | % | 85.23 |
| Copper Concentrate Grade | % | 57.32 |
| Contained Copper in Concentrate | Mlb | 10,795 |
| Contained Copper in Concentrate | kt | 4,897 |
| Peak Annual Recovered Copper Production | kt | 366 |
| 10-Year Average | ||
| Copper Concentrate Produced | kt (dry) | 496 |
| Contained Copper in Concentrate | kt | 284 |
| Mine-Site Cash Cost | US$/lb. payable | 0.52 |
| Total Cash Cost | US$/lb. payable | 1.16 |
| 5-Year Average | ||
| Copper Concentrate Produced | kt (dry) | 454 |
| Contained Copper in Concentrate | kt | 260 |
| Mine-Site Cash Cost | US$/lb. payable | 0.48 |
| Total Cash Cost | US$/lb. payable | 1.12 |
| Key Financial Results | ||
| Peak Funding | US$M | 775 |
| Remaining Initial Capital Costs | US$M | 646 |
| Expansion Capital Costs | US$M | 594 |
| LOM Average Mine Site Cash Costs | US$/lb. payable | 0.62 |
| LOM Average Total Cash Costs | US$/lb. payable | 1.26 |
| Site Operating Costs | US$/t Milled | 58.73 |
| After-Tax NPV8% | US$M | 5,520 |
| After-Tax IRR | % | 77.0 |
| Project Payback Period | Years | 2.3 |
| Project Life | Years | 21 |
Table 2 summarizes the financial results and Table 3 summarizes mine production and processing statistics.
Table 2. Kakula Mine financial results for 6-Mtpa production.
| Net Present Value (US$M) | Discount Rate | Before Taxation | After Taxation |
| Undiscounted | 16,761 | 11,595 | |
| 4.0% | 11,258 | 7,832 | |
| 6.0% | 9,381 | 6,544 | |
| 8.0% | 7,892 | 5,520 | |
| 10.0% | 6,698 | 4,696 | |
| 12.0% | 5,729 | 4,024 | |
| Internal Rate of Return | - | 86.3% | 77.0% |
| Project Payback Period (Years) | - | 2.3 | 2.3 |
Table 3. Kakula Mine average estimated production and processing statistics for 6-Mtpa production.
| Item | Unit | YEARS 1-5 | YEARS 1-10 | LOM AVERAGE |
| Total Processed | ||||
| Quantity Milled | kt | 4,638 | 5,345 | 5,237 |
| Copper Feed Grade | % | 6.56 | 6.21 | 5.22 |
| Annual Concentrate Produced | ||||
| Copper Concentrate Produced | kt (dry) | 454 | 496 | 407 |
| Copper Recovery | % | 85.5 | 85.6 | 85.2 |
| Copper Concentrate Grade | % | 57.3 | 57.3 | 57.3 |
| Contained Copper in Concentrate | ||||
| Copper | Mlb | 574 | 626 | 514 |
| Copper | kt | 260 | 285 | 233 |
| Payable Copper | ||||
| Copper | Mlb | 555 | 606 | 497 |
| Copper | kt | 252 | 275 | 226 |
The Kakula concentrator production is shown in Figure 3 and the concentrate and copper production is shown in Figure 4.

Figure 3. Kakula Mine estimated tonnes milled and head grade for the life-of-mine. Figure by OreWin 2020.
To view an enhanced version of Figure 3, please visit:
https://orders.newsfilecorp.com/files/3396/63350_6e9d6712f44748ed_015full.jpg

Figure 4. Kakula Mine estimated concentrate and copper production for the life-of-mine. Figure by OreWin 2020.
To view an enhanced version of this graphic, please visit:
https://orders.newsfilecorp.com/files/3396/63350_6e9d6712f44748ed_016full.jpg
Table 4 summarizes unit operating costs. Table 5 provides a breakdown of revenue and operating costs. Capital costs for the project are detailed in Table 6.
Table 4. Kakula Mine unit operating costs for 6-Mtpa production.
| US$/lb. Payable Copper | |||
| YEARS 1-5 | YEARS 1-10 | LOM AVERAGE | |
| Mine Site | 0.48 | 0.52 | 0.62 |
| Transport | 0.32 | 0.32 | 0.32 |
| Treatment & Refining Charges | 0.11 | 0.11 | 0.11 |
| Royalties & Export Tax | 0.20 | 0.20 | 0.20 |
| Total Cash Costs | 1.12 | 1.16 | 1.26 |

Figure 5. 2020 global mine-site cash cost curve (includes all operational costs at mine site).
To view an enhanced version of Figure 5, please visit:
https://orders.newsfilecorp.com/files/3396/63350_6e9d6712f44748ed_017full.jpg
Note: Represents mine-site cash costs that reflect the direct cash costs of producing paid concentrate or cathode incorporating mining, processing and mine-site G&A costs. Kakula is based on the average mine-site cash cost during the first 10 years as detailed in the Kakula 2020 DFS.
Source: Wood Mackenzie (based on public disclosure, the Kakula 2020 DFS has not been reviewed by Wood Mackenzie).

Figure 6. 2020 global C1 pro-rata copper cash cost curve (includes mining, processing, transportation and offsite realization costs).
To view an enhanced version of Figure 6, please visit:
https://orders.newsfilecorp.com/files/3396/63350_6e9d6712f44748ed_018full.jpg
Note: Represents C1 pro-rata cash costs that reflect the direct cash costs of producing paid copper incorporating mining, processing, mine-site G&A and offsite realization costs, having made appropriate allowance for the costs associated with the co-product revenue streams. Kakula is based on the average total cash cost during the first 10 years as detailed in the Kakula 2020 DFS.
Source: Wood Mackenzie (based on public disclosure, the Kakula 2020 DFS has not been reviewed by Wood Mackenzie).

Members of Kamoa-Kakula's on-site medical team in place to quickly identify and treat any potential COVID-19 cases and prevent the spread to other personnel. The team has done a stellar job in mitigating the impact of COVID-19 on the construction and development progress at Kamoa-Kakula.
To view an enhanced version of the members of Kamoa-Kakula's on-site medical team, please visit:
https://orders.newsfilecorp.com/files/3396/63350_6e9d6712f44748ed_019full.jpg
Table 5. Kakula Mine estimated revenue and operating costs for 6-Mtpa production.
| TOTAL LOM | YEARS 1-5 | YEARS 1-10 | LOM AVERAGE | |
| US$M | US$/t Milled | |||
| Revenue | ||||
| Copper in Concentrate | 32,348 | 369.71 | 350.90 | 294.14 |
| Gross Sales Revenue | 32,348 | 369.71 | 350.90 | 294.14 |
| Less: Realization Costs | ||||
| Transport | 3,383 | 38.76 | 36.73 | 30.77 |
| Treatment & Refining | 1,199 | 13.74 | 13.01 | 10.90 |
| Royalties & Export Tax | 2,106 | 24.10 | 22.85 | 19.15 |
| Total Realization Costs | 6,689 | 76.60 | 72.59 | 60.82 |
| Net Sales Revenue | 25,660 | 293.12 | 278.31 | 233.32 |
| Site Operating Costs | ||||
| Underground Mining | 4,280 | 35.38 | 38.58 | 38.92 |
| Processing | 1,470 | 14.12 | 13.37 | 13.37 |
| General & Administration | 758 | 7.60 | 7.04 | 6.89 |
| SNEL Discount | -294 | -2.39 | -2.55 | -2.67 |
| Customs | 245 | 2.13 | 2.21 | 2.23 |
| Total | 6,459 | 56.85 | 58.65 | 58.73 |
| Net Operating Margin | 19,201 | 236.27 | 219.66 | 174.59 |
| Net Operating Margin | 74.8% | 80.6% | 78.9% | 74.8% |

Geologist Kally Mbumba showing ultra-high-grade, chalcocite-rich ore at Kakula Mine that accounts for the mine's average feed grade of 6.6% copper over the first five years of operations, and 5.2% copper on average over a 21-year mine life. Chalcocite has the greatest percentage of copper of all the common sulphide-copper-bearing minerals − almost 80% copper by weight.
To view an enhanced version of Geologist Kally Mbumba, please visit:
https://orders.newsfilecorp.com/files/3396/63350_6e9d6712f44748ed_020full.jpg
Table 6. Kakula Mine estimated capital investment summary for 6-Mtpa production.
| Description | Initial Capital | Expansion Capital | Sustaining Capital | Total |
| US$M | US$M | US$M | US$M | |
| MINING | ||||
| Underground Mining | 131 | 202 | 538 | 871 |
| Infrastructure and Mobile Equipment | 38 | 16 | 362 | 416 |
| Capitalized Pre-Production | 76 | - | - | 76 |
| Subtotal | 246 | 218 | 899 | 1,363 |
| POWER | ||||
| Power Supply Off Site | 36 | - | - | 36 |
| Subtotal | 36 | - | - | 36 |
| CONCENTRATOR & TAILINGS | ||||
| Process Plant | 123 | 128 | 70 | 320 |
| Tailings | 13 | 26 | 88 | 127 |
| Subtotal | 136 | 154 | 157 | 448 |
| INFRASTRUCTURE | ||||
| Surface and Plant Infrastructure | 69 | 101 | 14 | 184 |
| Subtotal | 69 | 101 | 14 | 184 |
| INDIRECTS | ||||
| EPCM | 35 | 17 | 0 | 53 |
| Owners Cost | 66 | 47 | - | 114 |
| Customs Duties | 8 | 18 | 40 | 66 |
| Closure | - | - | 82 | 82 |
| Subtotal | 110 | 83 | 122 | 315 |
| CAPITAL EXPENDITURE BEFORE CONTINGENCY | 596 | 556 | 1,193 | 2,346 |
| Contingency | 50 | 38 | 72 | 159 |
| CAPITAL EXPENDITURE AFTER CONTINGENCY | 646 | 594 | 1,265 | 2,505 |
Note: Initial capital reflects the remaining capital costs, from July 1, 2020, to achieve initial production of 3.8 Mtpa, followed by expansion capital to reflect the capital costs to achieve full plant capacity of 7.6 Mtpa (with Kakula Mine capacity of 6.0 Mtpa).
The after-tax NPV sensitivity to copper price variation is shown in Table 7 for copper prices from US$2.00/lb. to US$4.50/lb. The annual and cumulative cash flows are shown in Figure 7.
Table 7. Kakula Mine copper price sensitivity.
| After Tax NPV (US$M) | Copper Price - US$/lb. | ||||||
| Discount Rate | 2.00 | 2.50 | 3.00 | 3.10 | 3.50 | 4.00 | 4.50 |
| Undiscounted | 4,225 | 7,519 | 10,911 | 11,595 | 14,353 | 17,532 | 19,928 |
| 4.0% | 2,828 | 5,072 | 7,370 | 7,832 | 9,704 | 11,852 | 13,457 |
| 6.0% | 2,334 | 4,227 | 6,156 | 6,544 | 8,117 | 9,918 | 11,256 |
| 8.0% | 1,935 | 3,551 | 5,190 | 5,520 | 6,857 | 8,384 | 9,513 |
| 10.0% | 1,609 | 3,005 | 4,413 | 4,696 | 5,845 | 7,153 | 8,116 |
| 12.0% | 1,340 | 2,558 | 3,779 | 4,024 | 5,022 | 6,154 | 6,982 |
| 15.0% | 1,018 | 2,028 | 3,031 | 3,232 | 4,052 | 4,977 | 5,649 |
| IRR | 38.5% | 57.9% | 74.0% | 77.0% | 88.9% | 100.4% | 106.9% |
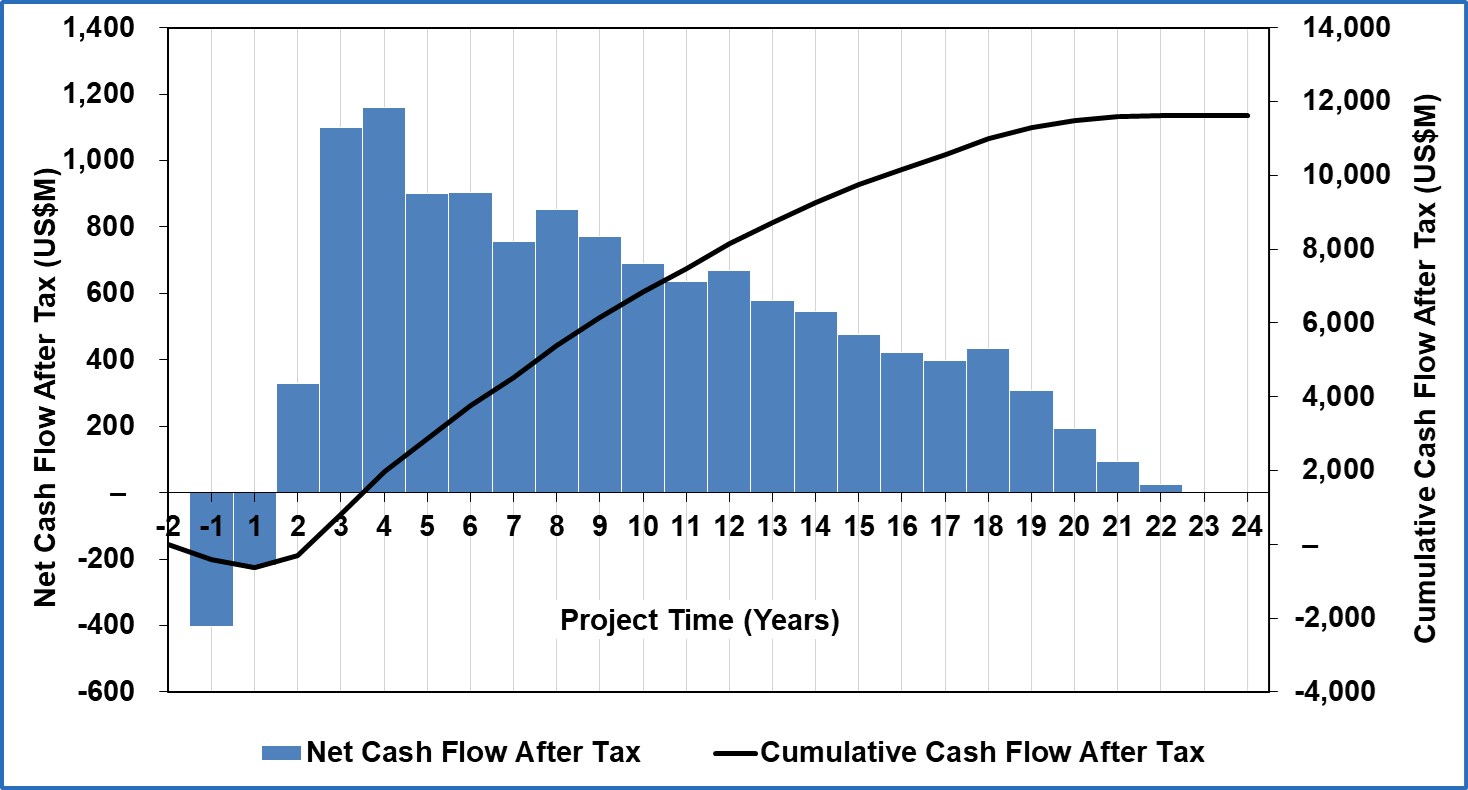
Figure 7. Kakula Mine projected real annual and cumulative cash flow. Figure by OreWin 2020.
To view an enhanced version of Figure 7, please visit:
https://orders.newsfilecorp.com/files/3396/63350_6e9d6712f44748ed_021full.jpg
Note: Figure 7 is shown on a nominal basis, including inflation, in Appendix B.
Kakula to be mined primarily using drift-and-fill method
The Kakula 2020 DFS mine access is via twin declines on the north side and a single decline on the south side of the deposit. One of the north declines will serve as the primary mine access, while the other decline is for the conveyor haulage system, which was recently commissioned.
From the bottom of the north and south declines, a pair of perimeter drifts will be driven to the east and west extremities of the deposit and will serve as the primary accesses to the production areas. These drifts also will be used as the primary intake and exhaust ventilation circuits and will connect with a series of intake and exhaust ventilation shafts. Work is already well advanced on the eastern and western perimeter drives on the north side of the orebody.
A series of twin connection drives will connect the orebody from north to south, providing access to the drift-and-fill panels and ventilation. The first of these mine connection drives 1 and 2 are expected to be connected by crews working from the north and south in November 2020.
The primary ore handling system will include a perimeter conveyor system connected to truck load-out points along the north side of the deposit. The perimeter conveyor system will terminate at the main conveyor decline.
The mining method for the Kakula Deposit is primarily drift-and-fill using paste backfill; with the exception of a room-and-pillar area close to the north declines, which will be mined in the early years of production. The paste backfill system will utilize a paste plant located on surface connected to a distribution system that includes a surface pipe network connected to bore holes located at each connection drive on the North side of the orebody.
Approximately 99% of the deposit will be mined using drift-and-fill, which was chosen to maximize the extraction of high-grade Kakula ore. Mine access and primary development are shown in Figure 8.

Figure 8. Kakula 2020 DFS mine development. Figure by Stantec 2020.
To view an enhanced version of Figure 8, please visit:
https://orders.newsfilecorp.com/files/3396/63350_6e9d6712f44748ed_022full.jpg
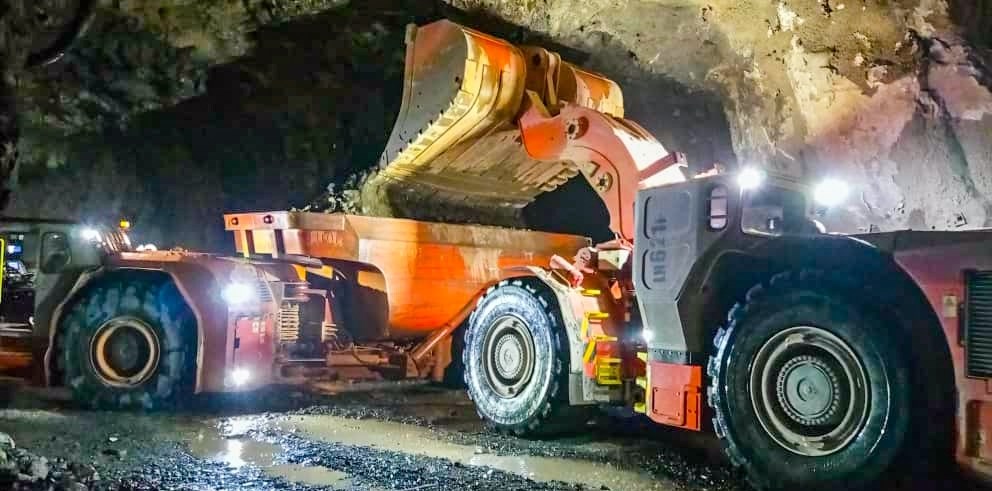
Development of the underground Kakula Mine utilizes large-scale, highly-productive, mechanized mining equipment, such as Sandvik loaders and 63-tonne haul trucks.
To view an enhanced version of the mechanized mining equipment, please visit:
https://orders.newsfilecorp.com/files/3396/63350_6e9d6712f44748ed_023full.jpg
Expanded Kakula 2020 DFS concentrator design in modules of 3.8 Mtpa
The Kakula concentrator will be constructed in a phased approach with two 3.8-Mtpa modules as the mining operations ramp-up to full production of 6 Mtpa.
The Kakula concentrator design incorporates a run-of-mine stockpile, followed by primary cone crushers operating in closed circuit with vibrating screens to produce 100% passing 50 millimetres (mm) material that is stockpiled.
The crushed ore is fed to the High Pressure Grinding Rolls (HPGR) operating in closed circuit with wet screening, at a product size of 80% (P80) passing 4.5 mm which is gravity fed to the milling circuit.
The milling circuit incorporates two stages of ball milling in series in closed circuit with cyclone clusters for further size reduction and classification to a target grind size of 80% passing 53 micrometres (µm).
The milled slurry is pumped to the rougher and scavenger flotation circuit where the high-grade, or fast-floating rougher concentrate, and medium-grade, or slow-floating scavenger concentrate, are separated for further upgrading. The rougher concentrate is upgraded in the low entrainment high-grade cleaner stage to produce a high-grade concentrate.
The medium-grade or scavenger concentrate together with the tailings from the high-grade cleaner stage and the recycled scavenger recleaner tailings are combined and further upgraded in the scavenger cleaner circuit. The concentrate produced from the scavenger cleaner circuit, representing roughly 12% of the mill feed, is re-ground to a P80 of 10µm prior to final cleaning in the low entrainment scavenger recleaner stage.
The scavenger recleaner concentrate is then combined with the high-grade cleaner concentrate to form final concentrate. The final concentrate is then thickened and pumped to the concentrate filter. Final filtered concentrate is then bagged for shipment to market.
The scavenger tailings and scavenger cleaner tailings are combined and thickened prior to being pumped to the backfill plant and/or to the tailings storage facility. Backfill will utilize approximately half of the tailings, with the remaining amount pumped to the tailings storage facility.
Based on extensive testwork, the concentrator is expected to achieve an overall recovery of 85%, producing a very high-grade concentrate grading 57% copper. Kakula also benefits from having very low deleterious elements, including arsenic levels of 0.02%.

Aerial view of Kakula's initial 3.8-Mtpa processing plant under construction, showing the first of two identical ball mills being installed, the flotation circuit in the middle, and the three green-coloured concentrator thickeners under construction.
To view an enhanced version of the Aerial view of Kakula's initial 3.8-Mtpa processing plant please visit:
https://orders.newsfilecorp.com/files/3396/63350_6e9d6712f44748ed_024full.jpg
Kamoa and Kakula Mineral Resources
The Kamoa Indicated and Inferred Mineral Resource estimate was prepared by George Gilchrist, Ivanhoe Mines' Vice President, Resources, under the direction of Gordon Seibel, RM SME, of the Wood Group (formerly Amec Foster Wheeler E&C Services Inc.) of Reno, USA, and is reported in accordance with the 2014 CIM Definition Standards for Mineral Resources and Mineral Reserves. Mr. Seibel is the Qualified Person for the estimate. The effective date of the estimate is February 10, 2020, and the cut-off date for drill data is November 1, 2018 for the Kakula estimate and January 20, 2020 for the Kamoa estimate.
The total, combined Indicated and Inferred Mineral Resources for the Kamoa-Kakula Project is shown in Table 8. Tables showing the Indicated and Inferred Mineral Resources separately for the Kamoa and Kakula deposits, as well as the sensitivity of Mineral Resources to cut-off grade, are shown in the appendices to this release.
Table 8. Total Kamoa and Kakula Indicated and Inferred Mineral Resource (at 1% total copper cut-off grade).
| Deposit | Category | Tonnes (millions) | Area (Sq. km) | Copper Grade (%) | Vertical Thickness (m) | Contained Copper (kt) | Contained Copper (billion lbs) |
| Kamoa | Indicated | 760 | 55.2 | 2.73 | 5.0 | 20,800 | 45.8 |
| Inferred | 235 | 21.8 | 1.70 | 4.0 | 4,010 | 8.8 | |
| Kakula | Indicated | 627 | 21.7 | 2.74 | 10.3 | 17,200 | 37.9 |
| Inferred | 104 | 5.6 | 1.61 | 6.7 | 1,680 | 3.7 | |
| Total Kamoa-Kakula Project | Indicated | 1,387 | 77.0 | 2.74 | 6.5 | 38,000 | 83.7 |
| Inferred | 339 | 27.4 | 1.68 | 4.5 | 5,690 | 12.5 |
Notes to accompany the total, combined Kamoa and Kakula 2020 Mineral Resource table:
- Ivanhoe's Vice President, Resources, George Gilchrist, Professional Natural Scientist (Pr. Sci. Nat) with the South African Council for Natural Scientific Professions (SACNASP), estimated the Mineral Resources under the supervision of Gordon Seibel, a Registered Member (RM) of the Society for Mining, Metallurgy and Exploration (SME), who is the Qualified Person for the Mineral Resource estimate. The effective date of the estimate for Kamoa is 30 January 2020, and the cut-off date for drill data is 20 January 2020. The Mineral Resources at Kakula were estimated as of 10 November 2018 and the cut-off date for the drill data is 1 November 2018. On 10 February 2020, the inputs used in assessing reasonable prospects of eventual extraction and the drill data inputs were reviewed to ensure the estimate remained current. There are no changes to the estimate as a result of the review, and the estimate has an effective date of 10 February 2020. Mineral Resources are reported using the CIM 2014 Definition Standards for Mineral Resources and Mineral Reserves. Mineral Resources are reported on a 100% basis. Ivanhoe holds an indirect 39.6% interest in the Project. Mineral Resources are reported inclusive of Mineral Reserves. Mineral Resources that are not Mineral Reserves do not have demonstrated economic viability.
- Mineral Resources at Kamoa are reported using a total copper (TCu) cut-off grade of 1% TCu and a minimum vertical thickness of 3 m. There are reasonable prospects for eventual economic extraction under assumptions of a copper price of US$3.00/lb.; employment of underground mechanized room-and-pillar and drift-and-fill mining methods; and that copper concentrates will be produced and sold to a smelter. Mining costs are assumed to be US$27/t, and concentrator, tailings treatment, and general and administrative costs (G&A) are assumed to be US$17/t. Metallurgical recovery for Kamoa is estimated to average 84% (86% for hypogene and 81% for supergene). At a 1% TCu cut-off grade, assumed net smelter returns for 100% of Mineral Resource blocks will cover concentrator, tailings treatment, and G&A costs.
- Mineral Resources at Kakula are reported using a TCu cut-off grade of 1% TCu and a minimum vertical thickness of 3 m. There are reasonable prospects for eventual economic extraction under assumptions of a copper price of US$3.10/lb., employment of underground, mechanized, room-and-pillar and drift-and-fill mining methods, and that copper concentrates will be produced and sold to a smelter. Mining costs are assumed to be US$34/t, and concentrator, tailings treatment, and G&A costs are assumed to be US$20/t. Metallurgical recovery is assumed to average 83% at the average grade of the Mineral Resource. Ivanhoe is studying reducing mining costs using a controlled convergence room-and-pillar method. At a 1% TCu cut-off grade, assumed net smelter returns for 100% of Mineral Resource blocks will cover concentrator, tailings treatment and G&A costs.
- Reported Mineral Resources contain no allowances for hangingwall or footwall contact boundary loss and dilution. No mining recovery has been applied.
- Tonnage and contained-copper tonnes are reported in metric units, contained-copper pounds are reported in imperial units, and grades are reported as percentages.
- Approximate drillhole spacings are 800 m for Inferred Mineral Resources and 400 m for Indicated Mineral Resources.
- Rounding as required by reporting guidelines may result in apparent summation differences between tonnes, grade and contained metal content.
Kakula 2020 DFS Mineral Reserve
The Kakula 2020 DFS Mineral Reserve has been estimated by Qualified Person Jon Treen, Senior Vice President, Stantec Consulting International LLC, using the 2014 CIM Definition Standards for Mineral Resources and Mineral Reserves to conform to the Canadian National Instrument 43-101 Standards of Disclosure for Mineral Projects. The total Mineral Reserve for the Kakula Project is shown in Table 9. The Mineral Reserve is based on the January 2020 Mineral Resource. The Mineral Reserve is entirely a Probable Mineral Reserve that was converted from Indicated Mineral Resources. The effective date of the Mineral Reserve statement is September 8, 2020.
Table 9. Kakula 2020 DFS Mineral Reserve Statement.
| Tonnage (Mt) | Copper (%) | Copper (Contained Mlb) | Copper (Contained kt) | |
| Proven Mineral Reserve | – | – | – | – |
| Probable Mineral Reserve | 110.0 | 5.22 | 12,665 | 5,745 |
| Mineral Reserve | 110.0 | 5.22 | 12,665 | 5,745 |
Notes to accompany Kakula 2020 DFS Mineral Reserve table
- The long term copper price used for calculating the financial analysis is US$3.10/lb. The analysis has been calculated with assumptions for smelter refining and treatment charges, deductions and payment terms, concentrate transport, metallurgical recoveries, and royalties.
- For mine planning, the copper price used to calculate block model Net Smelter Returns (NSRs) is US$3.10/lb.
- An elevated cut-off of US$100.00/t NSR was used to define the stoping blocks. A marginal cut-off of US$80.00/t NSR was used to define ore and waste.
- Indicated Mineral Resources were used to report Probable Mineral Reserves.
- Tonnage and grade estimates include dilution and recovery allowances.
- The Mineral Reserves reported above are not additive to the Mineral Resources.
The Kakula 2020 DFS Mineral Reserve targeted in the mine plan focused on maximizing the grade profile for a 6-Mtpa full production rate for 15 years, a four-year ramp-up, plus an 85% extraction and recovery allowance. As such, a range of net smelter returns (NSR) cut-offs were evaluated that identified a targeted resource of approximately 110 million tonnes at the highest NSR.
Tonnes and grades were calculated for the mining blocks, and allowances for unplanned dilution and mining recovery were applied to estimate the Mineral Reserve Statement.

Mine geologists Didier Masengo and Kally Mbumba with samples of high-grade, chalcocite-rich ore from the Kakula Mine. The majority of the working areas at Kakula now are transitioning to the higher-grade ore zones near the centre of the deposit that have copper grades of approximately +5% to +8%.
To view an enhanced version of mine geologists, Didier Masengo and Kally Mbumba, please visit:
https://orders.newsfilecorp.com/files/3396/63350_6e9d6712f44748ed_025full.jpg

Members of Kamoa Copper's Sustainability team that is working closely with local communities to carry out the project's long-term sustainability strategy, an integral part of Ivanhoe's commitment to responsible resource development.
To view an enhanced version of the members of Kamoa Copper's Sustainability team, please visit:
https://orders.newsfilecorp.com/files/3396/63350_6e9d6712f44748ed_026full.jpg
Key initial projections from the Kakula-Kansoko 2020 PFS
The study evaluates the development of mining activities at Kansoko in addition to Kakula, initially at a rate of 1.6 Mtpa to fill the 7.6-Mtpa concentrator at Kakula, eventually ramping up to 6 Mtpa as the reserves at Kakula are depleted. The life-of-mine production scenario provides for 235.2 million tonnes to be mined at an average grade of 4.47% copper, producing 20.0 million tonnes of high-grade copper concentrate, containing approximately 20.0 billion pounds of copper.
The economic analysis uses a consensus, real long-term copper price of US$3.10/lb. (excluding inflation) and returns an after-tax NPV at an 8% discount rate of US$6.6 billion. It has an after-tax IRR of 69.0% and a payback period of 2.5 years.
The estimated remaining initial capital cost, including contingency, is US$0.69 billion from July 1, 2020. Ivanhoe's proportional share of the remaining initial capital cost under Kakula-Kansoko 2020 PFS is approximately US$0.35 billion.
Key results of the Kakula-Kansoko 2020 PFS for the development of Kansoko in addition to Kakula to fill 7.6-Mtpa mill capacity are summarized in Table 10.
Table 10. Kakula-Kansoko 2020 PFS results summary for 7.6-Mtpa production.
| Item | Unit | Total |
| Total Processed | ||
| Quantity Milled | kt | 235,157 |
| Copper Feed Grade | % | 4.47 |
| Total Concentrate Produced | ||
| Copper Concentrate Produced | kt (dry) | 19,948 |
| Copper Recovery | % | 86.27 |
| Copper Concentrate Grade | % | 45.49 |
| Contained Copper in Concentrate | Mlb | 20,006 |
| Contained Copper in Concentrate | kt | 9,075 |
| Peak Annual Recovered Copper Production | kt | 427 |
| 10-Year Average | ||
| Copper Concentrate Produced | kt (dry) | 622 |
| Contained Copper in Concentrate | kt | 331 |
| Mine-Site Cash Cost | US$/lb. payable | 0.55 |
| Total Cash Cost | US$/lb. payable | 1.23 |
| 5-Year Average | ||
| Copper Concentrate Produced | kt (dry) | 542 |
| Contained Copper in Concentrate | kt | 294 |
| Mine-Site Cash Cost | US$/lb. payable | 0.50 |
| Total Cash Cost | US$/lb. payable | 1.18 |
| Key Financial Results | ||
| Peak Funding | US$M | 848 |
| Remaining Initial Capital Costs | US$M | 695 |
| Expansion Capital Costs | US$M | 750 |
| LOM Average Mine Site Cash Costs | US$/lb. payable | 0.64 |
| LOM Average Total Cash Costs | US$/lb. payable | 1.44 |
| Site Operating Costs | US$/t Milled | 52.95 |
| After-Tax NPV8% | US$M | 6,604 |
| After-Tax IRR | % | 69.0 |
| Project Payback Period | Years | 2.5 |
| Project Life | Years | 37 |
Table 11 summarizes the financial results and Table 12 summarizes potential mine production and processing statistics.
Table 11. Kakula-Kansoko 2020 PFS financial results for 7.6-Mtpa production.
| Net Present Value (US$M) | Discount Rate | Before Taxation | After Taxation |
| Undiscounted | 27,805 | 18,373 | |
| 4.0% | 15,562 | 10,422 | |
| 6.0% | 12,179 | 8,204 | |
| 8.0% | 9,757 | 6,604 | |
| 10.0% | 7,967 | 5,415 | |
| 12.0% | 6,608 | 4,505 | |
| Internal Rate of Return | - | 78.5% | 69.0% |
| Project Payback Period (Years) | - | 2.5 | 2.5 |
Table 12. Kakula-Kansoko 2020 PFS average estimated production and processing statistics for 7.6-Mtpa production.
| Item | Unit | YEARS 1-5 | YEARS 1-10 | LOM AVERAGE |
| Total Processed | ||||
| Quantity Milled | kt | 5,536 | 6,568 | 6,356 |
| Copper Feed Grade | % | 6.20 | 5.87 | 4.47 |
| Annual Concentrate Produced | ||||
| Copper Concentrate Produced | kt (dry) | 542 | 622 | 539 |
| Copper Recovery | % | 85.6 | 85.8 | 86.3 |
| Copper Concentrate Grade | % | 54.2 | 53.3 | 45.5 |
| Contained Copper in Concentrate | ||||
| Copper | Mlb | 648 | 730 | 541 |
| Copper | kt | 294 | 331 | 245 |
| Payable Copper | ||||
| Copper | Mlb | 627 | 706 | 523 |
| Copper | kt | 284 | 320 | 237 |
The Kakula concentrator production is shown in Figure 9, and the concentrate and copper production is shown in Figure 10.

Figure 9. Kakula-Kansoko 2020 PFS estimated tonnes milled and head grade for the life-of-mine. Figure by OreWin 2020.
To view an enhanced version of , please visit:
https://orders.newsfilecorp.com/files/3396/63350_6e9d6712f44748ed_027full.jpg

Figure 10. Kakula-Kansoko 2020 PFS estimated concentrate and copper production for the life-of-mine. Figure by OreWin 2020.
To view an enhanced version of Figure 10, please visit:
https://orders.newsfilecorp.com/files/3396/63350_6e9d6712f44748ed_028full.jpg
Table 13 summarizes unit operating costs. Table 14 provides a breakdown of revenue and operating costs. Capital costs for the project are detailed in Table 15.
Table 13. Kakula-Kansoko 2020 PFS unit operating costs for 7.6-Mtpa production.
| US$/lb. Payable Copper | |||
| YEARS 1-5 | YEARS 1-10 | LOM AVERAGE | |
| Mine Site | 0.50 | 0.55 | 0.64 |
| Transport | 0.35 | 0.35 | 0.42 |
| Treatment & Refining Charges | 0.12 | 0.12 | 0.13 |
| Royalties & Export Tax | 0.21 | 0.22 | 0.25 |
| Total Cash Costs | 1.18 | 1.23 | 1.44 |
Table 14. Kakula-Kansoko 2020 PFS estimated revenue and operating costs for 7.6-Mtpa production.
| TOTAL LOM | YEARS 1-5 | YEARS 1-10 | LOM AVERAGE | |
| US$M | US$/t Milled | |||
| Revenue | ||||
| Copper in Concentrate | 59,976 | 350.2 | 333.0 | 255.0 |
| Gross Sales Revenue | 59,976 | 350.2 | 333.0 | 255.0 |
| Less: Realization Costs | ||||
| Transport | 8,106 | 39.1 | 37.8 | 34.5 |
| Treatment & Refining | 2,477 | 13.3 | 12.8 | 10.5 |
| Royalties & Export Tax | 4,929 | 24.1 | 23.4 | 21.0 |
| Total Realization Costs | 15,513 | 76.6 | 73.9 | 66.0 |
| Net Sales Revenue | 44,463 | 273.6 | 259.0 | 189.1 |
| Site Operating Costs | ||||
| Underground Mining | 8,134 | 35.9 | 38.5 | 34.6 |
| Processing | 3,189 | 13.9 | 13.4 | 13.6 |
| General & Administration | 1,198 | 7.6 | 7.2 | 5.1 |
| SNEL Discount | -545 | -2.4 | -2.6 | -2.3 |
| Customs | 476 | 2.1 | 2.2 | 2.0 |
| Total | 12,451 | 57.1 | 58.6 | 52.9 |
| Net Operating Margin | 32,012 | 216.5 | 200.4 | 136.1 |
| Net Operating Margin | 72.0% | 79.1% | 77.4% | 72.0% |
Table 15. Kakula-Kansoko 2020 PFS estimated capital investment summary for 7.6-Mtpa production.
| Description | Initial Capital | Expansion Capital | Sustaining Capital | Total |
| US$M | US$M | US$M | US$M | |
| MINING | ||||
| Underground Mining | 158 | 299 | 1,068 | 1,525 |
| Infrastructure and Mobile Equipment | 55 | 60 | 922 | 1,036 |
| Capitalized Pre-Production | 76 | - | - | 76 |
| Subtotal | 289 | 359 | 1,990 | 2,638 |
| POWER | ||||
| Power Supply Off Site | 36 | - | - | 36 |
| Subtotal | 36 | - | - | 36 |
| CONCENTRATOR & TAILINGS | ||||
| Process Plant | 123 | 128 | 135 | 386 |
| Tailings | 13 | 12 | 240 | 265 |
| Subtotal | 136 | 139 | 375 | 651 |
| INFRASTRUCTURE | ||||
| Surface and Plant Infrastructure | 69 | 101 | 14 | 184 |
| Conveyor Kansoko to Kakula | - | - | 95 | 95 |
| Subtotal | 69 | 101 | 109 | 279 |
| INDIRECTS | ||||
| EPCM | 37 | 24 | 0 | 62 |
| Owners Cost | 67 | 50 | - | 117 |
| Customs Duties | 8 | 23 | 89 | 120 |
| Closure | - | - | 81 | 81 |
| Subtotal | 113 | 97 | 170 | 380 |
| CAPITAL EXPENDITURE BEFORE CONTINGENCY | 642 | 697 | 2,644 | 3,984 |
| Contingency | 52 | 53 | 183 | 288 |
| CAPITAL EXPENDITURE AFTER CONTINGENCY | 695 | 750 | 2,827 | 4,272 |
Note: Initial capital reflects the remaining capital costs to achieve initial production of 3.8 Mtpa, followed by expansion capital to reflect the capital costs to achieve full plant capacity of 7.6 Mtpa.

Figure 11. Capital intensity for large-scale global copper projects.
To view an enhanced version of Figure 11, please visit:
https://orders.newsfilecorp.com/files/3396/63350_6e9d6712f44748ed_029full.jpg
Note: Recently approved, probable and possible projects with nominal copper production capacity in excess of 200 kt/a (based on public disclosure and information gathered in the process of routine research). Kakula-Kansoko is based on the capital costs incurred in 2019, the capital costs incurred in the six months ended June 30, 2020 and the estimated initial and expansion capital costs from July 1, 2020 in the Kakula-Kansoko 2020 PFS. Kakula-Kansoko's first 10 years' average annual production of copper in concentrate are considered to be its nominal copper production.
Source: Wood Mackenzie (based on public disclosure, the Kakula-Kansoko 2020 PFS has not been reviewed by Wood Mackenzie).
The after-tax NPV sensitivity to copper price variation is shown in Table 16 for copper prices from US$2.00/lb. to US$4.50/lb. The annual and cumulative real cash flows are shown in Figure 11.
Table 16. Kakula-Kansoko 2020 PFS copper price sensitivity.
| After Tax NPV (US$M) | Copper Price - US$/lb. | ||||||
| Discount Rate | 2.00 | 2.50 | 3.00 | 3.10 | 3.50 | 4.00 | 4.50 |
| Undiscounted | 4,758 | 10,753 | 17,101 | 18,373 | 23,487 | 29,393 | 33,873 |
| 4.0% | 2,847 | 6,181 | 9,714 | 10,422 | 13,275 | 16,560 | 19,031 |
| 6.0% | 2,241 | 4,871 | 7,648 | 8,204 | 10,448 | 13,026 | 14,957 |
| 8.0% | 1,774 | 3,911 | 6,156 | 6,604 | 8,419 | 10,498 | 12,047 |
| 10.0% | 1,409 | 3,188 | 5,044 | 5,415 | 6,915 | 8,631 | 9,902 |
| 12.0% | 1,117 | 2,629 | 4,194 | 4,505 | 5,770 | 7,212 | 8,274 |
| 15.0% | 781 | 2,000 | 3,247 | 3,495 | 4,501 | 5,644 | 6,480 |
| IRR | 29.5% | 49.2% | 66.0% | 69.0% | 81.0% | 93.0% | 99.8% |

Figure 12. Kakula-Kansoko 2020 PFS projected real annual and cumulative cash flow. Figure by OreWin 2020.
To view an enhanced version of Figure 12, please visit:
https://orders.newsfilecorp.com/files/3396/63350_6e9d6712f44748ed_030full.jpg
Note: Figure 12 is shown on a nominal basis, including inflation, in Appendix B.
The Kamoa-Kakula Project 2020 Mineral Reserve includes the ore from both the Kakula Mine and Kansoko Mine. The tonnes and grades were calculated for the mining blocks, and allowances for unplanned dilution and mining recovery were applied to calculate the Mineral Reserve Statement. The effective date of the Mineral Reserve statement is September 8, 2020.
Table 17. Kamoa-Kakula Project 2020 Mineral Reserve
| Classification | Ore (Mt) | Copper (%) | Copper | Copper |
| (Contained Mlb) | (Contained kt) | |||
| Proven Kakula Mineral Reserve | - | - | - | - |
| Probable Kakula Mineral Reserve | 110 | 5.22 | 12,665 | 5,745 |
| Proven Kansoko Mineral Reserve | - | - | - | - |
| Probable Kansoko Mineral Reserve | 125 | 3.81 | 10,525 | 4,774 |
| Proven Kamoa-Kakula Mineral Reserve | - | - | - | - |
| Probable Kamoa-Kakula Mineral Reserve | 235 | 4.47 | 23,190 | 10,519 |
Notes to accompany Kamoa-Kakula Project 2020 Mineral Reserve table:
- The real long term copper price used for calculating the financial analysis is US$3.10/lb. The analysis has been calculated with assumptions for smelter refining and treatment charges, deductions and payment terms, concentrate transport, metallurgical recoveries, and royalties.
- For mine planning, the copper price used to calculate block model Net Smelter Returns (NSRs) was US$3.00/lb. for Kansoko and US$3.10/lb. for Kakula.
- An elevated cut-off of US$100.00/t NSR was used to define the stoping blocks. A marginal cut-off of US$80.00/t NSR was used to define ore and waste.
- Indicated Mineral Resources were used to report Probable Mineral Reserves.
- Tonnage and grade estimates include dilution and recovery allowances.
- The Mineral Reserves reported above are not additive to the Mineral Resources.
Expanded 19-Mtpa development scenario for the Kakula and Kamoa deposits
The Kamoa-Kakula 2020 PEA also assesses an additional development option of mining several deposits on the Kamoa-Kakula Project as an integrated, 19-Mtpa mining, processing and smelting complex, built in multiple stages. This scenario envisages the construction and operation of three separate mines: first, an initial 6-Mtpa mining operation would be established at the Kakula Mine on the Kakula Deposit; this is followed by a subsequent, separate 6-Mtpa mining operation at the Kansoko Mine, where two crews are working already; a third 6-Mtpa mine then will be established at the Kakula West Mine, in addition to a fourth initial mine in the Kamoa North area operating initially at 1 Mtpa. The processing plant is constructed in five modules of 3.8 Mtpa, with an ultimate capacity of 19 Mtpa.
As the resources at the Kakula, Kansoko and Kakula West mines are mined out, production would begin sequentially at five other mines in the Kamoa North area to maintain throughput of 19 Mtpa to the then existing concentrator and smelter complex, as illustrated in Figure 1.
Each mining operation is expected to be a separate underground mine with a shared processing facility and surface infrastructure located at Kakula. Material will be transported to the Kakula processing complex by a system of overland conveyors. Included in this scenario is the construction of a direct-to-blister copper smelter with a capacity of one million tonnes of copper concentrate per annum.
The Kamoa-Kakula 2020 PEA is preliminary in nature and includes an economic analysis that is based, in part, on Inferred Mineral Resources. Inferred Mineral Resources are considered too speculative geologically for the application of economic considerations that would allow them to be categorized as Mineral Reserves - and there is no certainty that the results will be realized. Mineral Resources do not have demonstrated economic viability and are not Mineral Reserves.

Ultra-high-grade drill core, comprised almost entirely of chalcocite, from a hole drilled at Kamoa North. Kamoa North is an important source of high-grade ore in Kamoa-Kakula's expanded 19 Mtpa development scenario. Chalcocite has the greatest percentage of copper of all the common sulphide-copper-bearing minerals ─ almost 80% copper by weight.
To view an enhanced version of the chalcocite, please visit:
https://orders.newsfilecorp.com/files/3396/63350_6e9d6712f44748ed_031full.jpg
Summary of the PEA's key results for the 19-Mtpa development scenario
- Very-high-grade initial phase projected to have a grade of 6.8% copper in the first year of production and an average grade of 5.1% copper during the first 10 years of operations, resulting in estimated average annual copper production of 501,000 tonnes.
- Recovered copper production is estimated at 805,000 tonnes in year 8, which would rank the Kamoa-Kakula Project as the second largest copper producer in the world.
- Remaining initial capital cost, including contingency, is US$0.71 billion, with subsequent expansions at Kansoko, Kakula West, and other mining areas, as well as the smelter, to be funded by cash flows from the Kakula Mine.
- Average total cash costs of US$1.07/lb. copper during the first 10 years, including sulphuric acid credits.
- After-tax NPV, at an 8% discount rate, of US$11.1 billion.
- After-tax IRR of 56.2% and a payback period of 3.6 years.

Kamoa-Kakula is proud of its talented team of Congolese women − including Micheline Kyenge, Mine Geologist − inspecting a sample of the ultra-high-grade fine-grained, gray-coloured chalcocite ─ Kakula's predominant type of ore.
To view an enhanced version of Micheline Kyenge, Mine Geologist, please visit:
https://orders.newsfilecorp.com/files/3396/63350_6e9d6712f44748ed_032full.jpg

Minty Cai, Kamoa Copper's Co-Chief Financial Officer, beside the run-of-mine (ROM) conveyor system under construction near Kakula's main (northern) decline, which will transport ore from the ROM stockpile to the crushing and screening plant.
To view an enhanced version of Minty Cai, Kamoa Copper's Co-Chief Financial Officer, please visit:
https://orders.newsfilecorp.com/files/3396/63350_6e9d6712f44748ed_033full.jpg
Key results of this potential development scenario are summarized in tables 18, 19, 20 and 21, and figures 13 & 14.
Table 18. 19-Mtpa Kamoa-Kakula 2020 PEA results summary.
| Item | Unit | Total |
| Total Processed | ||
| Quantity Milled | kt | 597,621 |
| Copper Feed Grade | % | 3.63 |
| Total Concentrate Produced | ||
| Copper Concentrate Produced | kt (dry) | 42,818 |
| Copper Concentrate - External Smelter | kt (dry) | 11,944 |
| Copper Concentrate - Internal Smelter | kt (dry) | 30,874 |
| Copper Recovery | % | 86.42 |
| Copper Concentrate Grade | % | 43.76 |
| Cont. Copper in Conc. - External Smelter | Mlb | 13,251 |
| Cont. Copper in Conc. - External Smelter | kt | 6,010 |
| Cont. Copper in Blister - Internal Smelter | Mlb | 27,641 |
| Cont. Copper in Blister - Internal Smelter | kt | 12,538 |
| Peak Annual Recovered Copper Production | kt | 805 |
| 10 Year Average | ||
| Copper Feed Grade | % | 5.13 |
| Copper Concentrate Produced | kt (dry) | 1,043 |
| Cont. Copper in Conc. - External Smelter | kt | 248 |
| Cont. Copper in Blister - Internal Smelter | kt | 253 |
| Mine Site Cash Cost (Including Smelter) | US$/lb. payable | 0.65 |
| Total Cash Cost (After Credits) | US$/lb. payable | 1.07 |
| Key Financial Results | ||
| Peak Funding | US$M | 784 |
| Remaining Initial Capital Costs | US$M | 715 |
| Expansion Capital Costs | US$M | 4,461 |
| Sustaining Capital Costs | US$M | 11,958 |
| LOM Avg. Mine Site Cash Cost (Including Smelter) | US$/lb. payable | 0.92 |
| LOM Avg. Total Cash Costs (After Credits) | US$/lb. payable | 1.28 |
| Site Operating Costs | US$/t Milled | 62.44 |
| After-Tax NPV8% | US$M | 11,117 |
| After-Tax IRR | % | 56.2 |
| Project Payback | Years | 3.6 |
| Project Life | Years | 43 |
Table 19. 19-Mtpa Kamoa-Kakula 2020 PEA unit operating costs.
| US$/lb. Payable Copper | |||
| YEARS 1-5 | YEARS 1-10 | LOM AVERAGE | |
| Mine Site (ex-Smelter) | 0.56 | 0.57 | 0.81 |
| Smelter | 0.04 | 0.08 | 0.11 |
| Transport | 0.29 | 0.24 | 0.23 |
| Treatment & Refining Charges | 0.10 | 0.08 | 0.07 |
| Royalties & Export Tax | 0.19 | 0.18 | 0.17 |
| Total Cash Costs Before Credits | 1.18 | 1.15 | 1.40 |
| Sulphuric Acid Credits1 | 0.04 | 0.09 | 0.12 |
| Total Cash Costs After Credits | 1.14 | 1.07 | 1.28 |
- Assumes a sulphuric acid price of US$200 per tonne.

Members of the Kakula kitchen staff preparing fresh fruits and vegetables; all of which were grown locally in community-run gardens, then sold to the Kamoa-Kakula Project. Another example of the Kamoa-Kakula Sustainable Livelihoods Program supporting economic diversification in surrounding communities.
To view an enhanced version of the members of the Kakula kitchen staff, please visit:
https://orders.newsfilecorp.com/files/3396/63350_6e9d6712f44748ed_034full.jpg
Table 20. Kamoa-Kakula 2020 PEA estimated capital investment summary for 19-Mtpa production
| Description | Initial Capital | Expansion Capital | Sustaining Capital | Total |
| US$M | US$M | US$M | US$M | |
| MINING | ||||
| Underground Mining | 156 | 995 | 5,620 | 6,772 |
| Infrastructure and Mobile Equipment | 68 | 299 | 2,251 | 2,618 |
| Capitalized Pre-Production | 78 | - | - | 78 |
| Subtotal | 302 | 1,295 | 7,872 | 9,468 |
| POWER & SMELTER | ||||
| Smelter | - | 635 | 368 | 1,003 |
| Power Supply Off Site | 36 | - | - | 36 |
| Subtotal | 36 | 635 | 368 | 1,039 |
| CONCENTRATOR & TAILINGS | ||||
| Process Plant | 124 | 646 | 345 | 1,115 |
| Tailings | 15 | 26 | 550 | 591 |
| Subtotal | 139 | 672 | 895 | 1,706 |
| INFRASTRUCTURE | ||||
| Surface and Plant Infrastructure | 69 | 889 | 823 | 1,781 |
| Overland Conveyors | - | 118 | 66 | 183 |
| Rail | - | 72 | 84 | 156 |
| Subtotal | 69 | 1,079 | 973 | 2,120 |
| INDIRECTS | ||||
| EPCM | 37 | 111 | 35 | 184 |
| Owners Cost | 70 | 63 | - | 132 |
| Customs Duties | 9 | 137 | 361 | 507 |
| Closure | - | - | 308 | 308 |
| Subtotal | 116 | 311 | 704 | 1,130 |
| CAPITAL EXPENDITURE BEFORE CONTINGENCY | 661 | 3,991 | 10,811 | 15,464 |
| Contingency | 53 | 470 | 1,147 | 1,670 |
| CAPITAL EXPENDITURE AFTER CONTINGENCY | 715 | 4,461 | 11,958 | 17,134 |
Note: Initial capital reflects the remaining capital costs, from July 1, 2020, to achieve initial production of 3.8 Mtpa, followed by expansion capital to reflect the capital costs to achieve full processing capacity of 19 Mtpa.
Table 21. 19-Mtpa Kamoa-Kakula 2020 PEA copper price sensitivity.
| After Tax NPV (US$M) | Copper Price - US$/lb. | ||||||
| Discount Rate | 2.00 | 2.50 | 3.00 | 3.10 | 3.50 | 4.00 | 4.50 |
| Undiscounted | 8,839 | 21,888 | 35,185 | 37,844 | 48,517 | 60,961 | 70,509 |
| 4.0% | 4,620 | 11,251 | 18,056 | 19,416 | 24,876 | 31,243 | 36,089 |
| 6.0% | 3,351 | 8,357 | 13,495 | 14,520 | 18,640 | 23,446 | 27,089 |
| 8.0% | 2,422 | 6,323 | 10,320 | 11,117 | 14,318 | 18,054 | 20,876 |
| 10.0% | 1,733 | 4,855 | 8,046 | 8,681 | 11,231 | 14,210 | 16,453 |
| 12.0% | 1,213 | 3,771 | 6,374 | 6,891 | 8,968 | 11,393 | 13,214 |
| 15.0% | 655 | 2,619 | 4,603 | 4,996 | 6,573 | 8,416 | 9,794 |
| IRR | 21.1% | 37.8% | 53.2% | 56.2% | 67.3% | 79.9% | 89.0% |
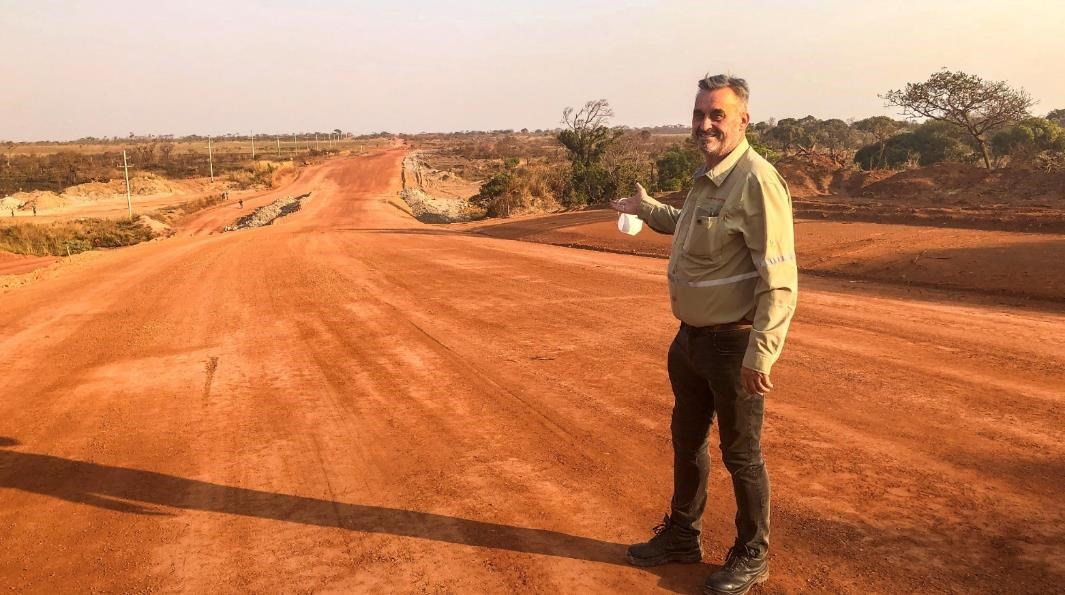
Petr Valicek, Kamoa's Senior Engineering Manager, shows off a section of the new highway that provides Kamoa-Kakula with a direct, high-quality connection to the national road system at Kolwezi. The 34-kilometre, east-west highway has significantly improved Kamoa-Kakula's transportation corridor used to bring mining equipment and construction materials to site, and also to transport out copper concentrates.
To view an enhanced version of Petr Valicek, Kamoa's Senior Engineering Manager, please visit:
https://orders.newsfilecorp.com/files/3396/63350_6e9d6712f44748ed_035full.jpg

Figure 13. 19-Mtpa Kamoa-Kakula 2020 PEA scenario mill feed and grade profile. Figure by OreWin 2020.
To view an enhanced version of Figure 13, please visit:
https://orders.newsfilecorp.com/files/3396/63350_6e9d6712f44748ed_036full.jpg
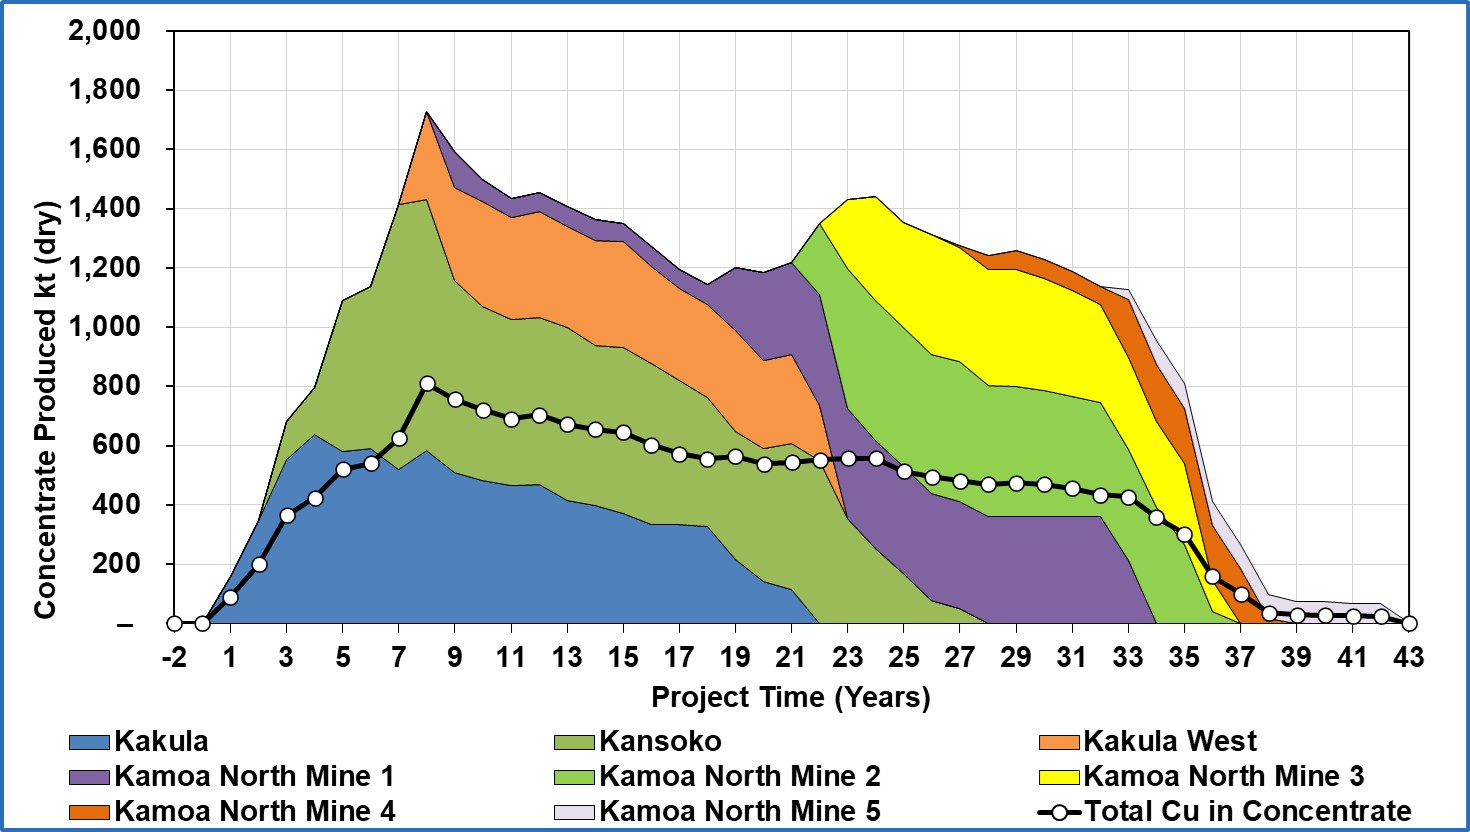
Figure 14. 19-Mtpa Kamoa-Kakula 2020 PEA scenario concentrate and copper production. Figure by OreWin 2020
To view an enhanced version of Figure 14, please visit:
https://orders.newsfilecorp.com/files/3396/63350_6e9d6712f44748ed_037full.jpg

Figure 15. Projected 19-Mtpa Kamoa-Kakula PEA production (year-8 peak copper production shown) compared to the world's projected top 20 producing mines in 2025 by paid copper production.
To view an enhanced version of Figure 15, please visit:
https://orders.newsfilecorp.com/files/3396/63350_6e9d6712f44748ed_038full.jpg
Note: Kamoa-Kakula 2020 PEA production based on projected peak copper production (which occurs in year 8) of the 19-Mtpa alternative development option.
Source: Wood Mackenzie (based on public disclosure, the Kamoa-Kakula 2020 PEA has not been reviewed by Wood Mackenzie).

Mbali Nkwali, Kamoa-Kakula Business Analyst, at the project's state-of-the-art training centre that is being used to train a new generation of skilled Congolese tradespeople.
To view an enhanced version of Mbali Nkwali, Kamoa-Kakula Business Analyst, please visit:
https://orders.newsfilecorp.com/files/3396/63350_6e9d6712f44748ed_039full.jpg

Figure 16. Nominal production and head grade of the world's top 10 largest new greenfield projects.
To view an enhanced version of Figure 16, please visit:
https://orders.newsfilecorp.com/files/3396/63350_6e9d6712f44748ed_040full.jpg
Note: Top 10 largest new greenfield copper projects defined as the 10 largest greenfield copper projects classified by Wood Mackenzie as "base case" or "probable" and ranked by nominal copper production (with the Kamoa-Kakula 2020 PEA and Kakula 2020 DFS's respective first 10 years' average annual production of copper in concentrate considered to be its nominal copper production).
Source: Wood Mackenzie, USGS (based on public disclosure, the Kamoa-Kakula 2020 PEA and Kakula 2020 DFS have not been reviewed by Wood Mackenzie).
Direct-to-Blister Flash (DBF) smelter included in expanded PEA case
The Kamoa-Kakula 2020 PEA also includes the construction of a smelter complex, based on Finland-based Outotec's direct-to-blister furnace technology which is suitable for treating Kakula-type concentrates with relatively high copper/sulphur ratio, and low iron. China Nerin Engineering acted as the main engineering consultant with Outotec providing design and costing for propriety equipment, including the DBF furnace, waste heat boiler, and the slag cleaning electric furnace. The smelter design capacity is 1,000 ktpa of concentrate feed, producing in excess of 500 ktpa copper in the form of blister and anode.
Concentrate is first dried in a steam dryer and sent to the DBF where it is smelted in the reaction shaft with oxygen-enriched air to produce molten slag containing oxide minerals, blister copper and sulphur-dioxide (SO2) rich off-gas. The oxidation reactions provide a portion of the heat required to melt the charge, with external fuel (in the form of pulverized coal and fuel oil) used to supplement the energy demand. Molten slag and blister copper collect in the DBF settler and are intermittently tapped (drained from the furnace) via dedicated tapholes. DBF slag, still containing appreciable amounts of copper, is further treated using metallurgical grade coke in an electric slag cleaning furnace (SCF) to recover oxidized copper in the form of blister. The SCF slag is slow cooled, crushed, milled and processed by flotation to recover residual copper in the form of slag concentrate, which is recycled back to the DBF. The SO2-rich off-gas is de-dusted, dried and sent to a double-contact-double-adsorption acid plant for production of high strength sulphuric acid that is sold to the local market.
An on-site smelter offers numerous cost savings, including treatment charges, certain taxes and transportation costs. In addition, the sale of the sulphuric acid by-product would generate additional revenue. Sulphuric acid is in short supply in the DRC, and is imported for use in processing ore from oxide copper deposits.
Qualified persons
The following companies have undertaken work in preparation of the Kamoa-Kakula IDP20 which includes the Kakula 2020 DFS, Kakula-Kansoko 2020 PFS and Kamoa-Kakula 2020 PEA:
- OreWin of Adelaide, Australia - Overall report preparation, mining, logistics, power and economic analysis.
- China Nerin Engineering Co. of Jiangxi, China - Smelter design.
- DRA Global of Johannesburg, South Africa - Mine surface infrastructure and metallurgical processing.
- Epoch Resources of Johannesburg, South Africa- Tailings Storage Facility design.
- Golder Associates Africa of Midrand, South Africa - Hydrology models and recommendations.
- KGHM Cuprum of Wrocław, Poland - Technical advisor on certain mining methods and geotechnical.
- Outotec Oyj of Helsinki, Finland - Smelter technology.
- Paterson and Cooke of Cape Town, South Africa - Paste Backfill Plant design and Surface / Underground paste distribution system.
- SRK Consulting of Cape Town, South Africa - Mine geotechnical recommendations.
- Stantec Consulting of Phoenix, USA - Mining and Mineral Reserves.
- Wood Group (formerly Amec Foster Wheeler) of Reno, USA - Mineral Resource estimation.
The independent Qualified Persons responsible for preparing the Kakula 2020 DFS, Kakula-Kansoko 2020 PFS and Kamoa-Kakula 2020 PEA, on which the technical report will be based, are Bernard Peters (OreWin); Gordon Seibel (Wood Group, formerly Amec Foster Wheeler); Marius Phillips (DRA Global); Alwyn Scholz (DRA Global); William Joughin (SRK); and Jon Treen (Stantec). Each Qualified Person has reviewed and approved the information in this news release relevant to the portion of the Kakula 2020 DFS, Kakula-Kansoko 2020 PFS and Kamoa-Kakula 2020 PEA for which they are responsible.
Other scientific and technical information in this news release has been reviewed and approved by Stephen Torr, P.Geo., Ivanhoe Mines' Vice President, Project Geology and Evaluation, a Qualified Person under the terms of National Instrument 43-101. Mr. Torr is not independent of Ivanhoe Mines. Mr. Torr has verified the technical data disclosed in this news release.
Wood Mackenzie of Edinburgh, Scotland, provided data based on public disclosure of comparable copper projects for the compilation of certain figures used in this release; however, Wood Mackenzie did not review the Kakula 2020 DFS, Kakula-Kansoko 2020 PFS or Kamoa-Kakula 2020 PEA.
Data verification and quality control and assurance
Amec Foster Wheeler, a Wood company (Wood), reviewed the sample chain of custody, quality assurance and control procedures, and qualifications of analytical laboratories. Wood is of the opinion that the procedures and QA/QC control are acceptable to support Mineral Resource estimation. Wood also audited the assay database, core logging, and geological interpretations on a number of occasions between 2009 and 2020, and has found no material issues with the data as a result of these audits.
In the opinion of the Wood Qualified Persons, the data verification programs undertaken on the data collected from the Kamoa-Kakula Project support the geological interpretations. The analytical and database quality and the data collected can support Mineral Resource estimation.
Ivanhoe Mines maintains a comprehensive chain of custody and QA/QC program on assays from its Kamoa Kakula Copper Project. Half-sawn core is processed at its on-site preparation laboratory in Kamoa, prepared samples then are shipped by secure courier to Bureau Veritas Minerals (BVM) Laboratories in Australia, an ISO17025 accredited facility. Copper assays are determined at BVM by mixed-acid digestion with ICP finish. Industry-standard certified reference materials and blanks are inserted into the sample stream prior to dispatch to BVM.
For detailed information about assay methods and data verification measures used to support the scientific and technical information, please refer to the Kamoa-Kakula 2020 Resource Update, March 2020 technical report available on the SEDAR profile of Ivanhoe Mines at www.sedar.com or under technical reports on the Ivanhoe Mines website at www.ivanhoemines.com.
Study Assumptions Regarding the 2018 DRC Mining Code
The Kakula 2020 DFS, Kakula-Kansoko 2020 PFS and Kamoa-Kakula 2020 PEA have all been prepared on the assumption that the 2018 DRC Mining Code applies to the project, including the super profits tax that was introduced by that code in 2018.
As Ivanhoe Mines originally disclosed in March 2018, it and other mining industry participants had expressed concerns to the DRC government regarding the implementation of the 2018 Mining Code. In particular, Ivanhoe Mines sought, and continues to seek, assurances from the DRC government that it will honour the clear guarantee of stability contained in Article 276 of the former 2002 Mining Code. The stability guarantee states as a matter of law that holders of DRC exploration and exploitation permits would continue to benefit from rights granted under the 2002 mining code "for a period of 10 years" after the implementation of any legislated amendment, which includes the 2018 Mining Code.
Ivanhoe Mines' investments in the DRC were made on the basis that it would have the benefit of the stability clause, and as a result the Kamoa-Kakula Project would not be exposed to changes, including the super profits tax, for 10 years following any legislative change. In particular, the stability clause permitted an investment decision to be justified at copper prices less than US$3.00/lb., whereas with the 2018 Mining Code changes, a higher copper price, indexed to inflation, would be needed to offset the 2018 changes and loss of the protection of the Article 276 stability clause. Ivanhoe considers a nominal, inflated copper price above US$3.10/lb. as the basis for determining the super profits tax, should it ultimately be unsuccessful in securing the continued benefit of the stability clause.
Submissions have been made by Ivanhoe Mines and other mining industry participants which seek to address and resolve the stability arrangements and other items of concern with the 2018 Mining Code. While meetings have been held among Ivanhoe Mines, mining industry representatives and members of the current and former DRC governments, including the President, the concerns surrounding the 2018 Mining Code have not been resolved. Further discussions have been delayed, in part, due to the ongoing COVID-19 pandemic, and accordingly, these studies assume the applicability of the 2018 Mining Code. However, once these issues are resolved, Ivanhoe Mines may revise the results of these studies to take that resolution into account, which Ivanhoe Mines expects would include the continued applicability of the stability clause of the 2002 Mining Code.
About Ivanhoe Mines
Ivanhoe Mines is a Canadian mining company focused on advancing its three principal joint-venture projects in Southern Africa: the development of major new, mechanized, underground mines at the Kamoa-Kakula discoveries in the Democratic Republic of Congo (DRC) and at the Platreef palladium-platinum-nickel-copper-rhodium-gold discovery in South Africa; and the extensive redevelopment and upgrading of the historic Kipushi zinc-copper-germanium-silver mine, also in the DRC. Kamoa-Kakula and Kipushi will be powered by clean, renewable hydroelectricity and will be among the world's lowest greenhouse gas emitters per unit of metal produced. Ivanhoe also is exploring for new copper discoveries on its wholly-owned Western Foreland exploration licences in the DRC, near the Kamoa-Kakula Project.
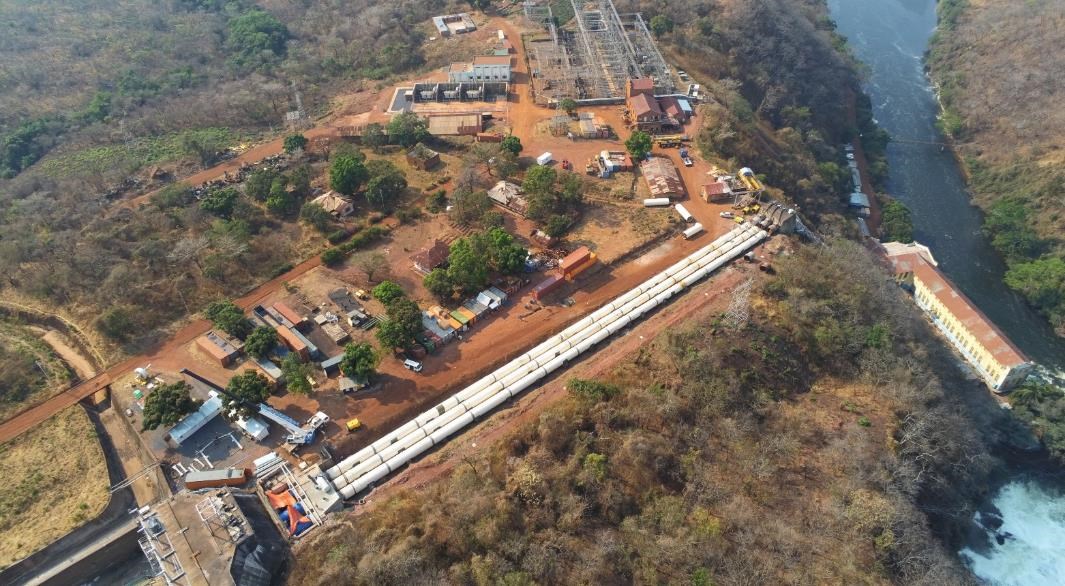
Aerial view of the Mwadingusha hydro-electric power plant showing the new penstocks. The upgrading of the Mwadingusha facility is a key part of Kamoa-Kakula's goal of producing the world's greenest copper.
To view an enhanced version of the aerial view of the Mwadingusha, please visit:
https://orders.newsfilecorp.com/files/3396/63350_6e9d6712f44748ed_041full.jpg
Information contacts
Investors: Bill Trenaman +1.604.331.9834
Media: Matthew Keevil +1.604. 558.1034
Cautionary statement on forward-looking information
Certain statements in this release constitute "forward-looking statements" or "forward-looking information" within the meaning of applicable securities laws, including without limitation: (i) the results of the Kakula 2020 DFS, the Kakula-Kansoko 2020 PFS and the Kamoa-Kakula 2020 PEA, including the development of a 6-Mtpa operation at Kakula, a 7.6-Mtpa operation at Kakula-Kansoko and an expanded 19-Mtpa operation at Kamoa-Kakula; (ii) statements regarding the construction of the mine at any of the deposits; (iii) the construction of a direct-to-blister flash copper smelter with a capacity of one million tonnes of copper concentrate; (iv) the development of mines at Kamoa North; and (v) mining at Kakula to be primarily using the drift-and-fill method; and (vi) the design and specifications of the Kakula concentrator.
Such statements involve known and unknown risks, uncertainties and other factors which may cause the actual results, performance or achievements of Ivanhoe Mines, or industry results, to be materially different from any future results, performance or achievements expressed or implied by such forward-looking statements or information. Such statements can be identified by the use of words such as "may", "would", "could", "will", "intend", "expect", "believe", "plan", "anticipate", "estimate", "scheduled", "forecast", "predict" and other similar terminology, or state that certain actions, events or results "may", "could", "would", "might" or "will" be taken, occur or be achieved. These statements reflect the Ivanhoe Mine's current expectations regarding future events, performance and results and speak only as of the date of this news release.
As well, all of the results of the Kakula 2020 DFS, the Kakula-Kansoko 2020 PFS and the Kamoa-Kakula 2020 PEA constitute forward-looking information or statements, including estimates of internal rates of return after-tax of 77.0% (Kakula), 69.0% (Kakula-Kansoko) and 56.2% (Kamoa-Kakula) with payback periods of 2.3 years, 2.5 years and 3.6 years respectively; net present values including a Kakula project NPV at an 8% discount rate of US$5.5 billion, a Kakula-Kansoko project NPV at an 8% discount rate of US$6.6 billion and a Kamoa-Kakula project NPV at an 8% discount rate of US$11.1 billion; future production forecasts and projects, including first 10 years average annual production of 284,000 tonnes of copper and up to 366,000 tonnes of copper by year four at Kakula, first 10 years average annual production of 331,000 tonnes of copper and up to 427,000 tonnes of copper by year four at Kakula-Kansoko and first 10 years average annual production of 501,000 tonnes of copper and 805,000 tonnes of copper by year 8 at Kamoa-Kakula; estimates of first 10 years cash cost including mine site cash cost of US$0.52 per pound at total cash cost of US $1.16 per pound at Kakula, estimates of first 10 years cash cost including mine site cash cost of US$0.55 per pound at total cash cost of US $1.23 per pound at Kakula-Kansoko and estimates of first 10 years cash cost including mine site cash cost of US$0.57 per pound at total cash cost of US $1.07 per pound at Kamoa-Kakula; mine life estimates, including a 21 year mine life at Kakula, a 37 year mine life at Kakula-Kansoko and a 43 year mine life at Kamoa-Kakula; remaining initial capital costs at Kakula of US$0.65 billion, Kakula-Kansoko of US$0.7 billion and Kamoa-Kakula of US$0.7 billion; average copper grades of 6.2% at Kakula, 5.9% at Kakula-Kansoko and 5.1% at Kamoa-Kakula during the first 10 years of operations; cash flow forecasts; estimates of copper recoveries of 85.2% at Kakula, 86.3% at Kakula-Kansoko and 86.4% at Kamoa-Kakula.
Furthermore, with respect to this specific forward-looking information concerning the development scenarios for the Kamoa-Kakula Copper Project, Ivanhoe Mines has based its assumptions and analysis on certain factors that are inherently uncertain. Uncertainties include among others: (i) the adequacy of infrastructure (including the rehabilitation of the Koni and Mwadingusha, and accessibility and viability of rail links); (ii) unforeseen changes in geological characteristics; (iii) changes in the metallurgical characteristics of the mineralization; (iv) the ability to develop adequate processing capacity; (v) the price of copper; (vi) the availability of equipment and facilities necessary to complete development; (vii) the size of future processing plants and future mining rates; (viii) the cost of consumables and mining and processing equipment; (ix) unforeseen technological and engineering problems; (x) accidents or acts of sabotage or terrorism; (xi) currency fluctuations; (xii) changes in laws or regulations; (xiii) the availability and productivity of skilled labour; (xiv) the regulation of the mining industry by various governmental agencies; (xv) political factors, including political stability; (xvi) the availability of financing; and (xvii) the completion of the railway upgrade between Kolwezi and Dilolo.
This release also contains references to estimates of Mineral Resources and Mineral Reserves. The estimation of Mineral Resources and Mineral Reserves is inherently uncertain and involves subjective judgments about many relevant factors. Mineral Resources that are not Mineral Reserves do not have demonstrated economic viability. The accuracy of any such estimates is a function of the quantity and quality of available data, and of the assumptions made and judgments used in engineering and geological interpretation (including estimated future production from the Kamoa-Kakula Copper Project, the anticipated tonnages and grades that will be mined and the estimated level of recovery that will be realized), which may prove to be unreliable and depend, to a certain extent, upon the analysis of drilling results and statistical inferences that may ultimately prove to be inaccurate. Mineral Resource or Mineral Reserve estimates may have to be re-estimated based on: (i) fluctuations in copper price; (ii) results of drilling, (iii) the results of metallurgical testing and other studies, including their subsequent refinement and updating; (iv) proposed mining operations, including dilution; (v) the evaluation of mine plans subsequent to the date of any estimates; (vi) changes in mining or other costs, and (vii) the possible failure to receive required permits, approvals and licenses or changes to existing mining licences.
Forward-looking statements involve significant risks and uncertainties, should not be read as guarantees of future performance or results, and will not necessarily be accurate indicators of whether or not such results will be achieved. A number of factors could cause actual results to differ materially from the results discussed in the forward-looking statements, including, but not limited to, the factors discussed here, as well as unexpected changes in laws, rules or regulations, or their enforcement by applicable authorities; the failure of parties to contracts with Ivanhoe Mines and its subsidiaries to perform as agreed; social, political or labour unrest; changes in commodity prices (and copper in particular); limitations and availability of capital; and the failure of exploration programs or studies to deliver anticipated results (including the actual results of drilling and exploration activities), or results that would justify and support continued exploration, studies, development or operations.
Although the forward-looking statements contained in this release are based upon what management of Ivanhoe Mines believes are reasonable assumptions, Ivanhoe Mines cannot assure investors that actual results will be consistent with these forward-looking statements. These forward-looking statements are made as of the date of this release and are expressly qualified in their entirety by this cautionary statement. Subject to applicable securities laws, Ivanhoe Mines does not assume any obligation to update or revise the forward-looking statements contained herein to reflect events or circumstances occurring after the date of this release.
The company's actual results could differ materially from those anticipated in these forward-looking statements as a result of the factors set forth in the "Risk Factors" section in the company's Q2 2020 MD&A and its current annual information form.
Appendix A - 2020 Kamoa and Kakula Mineral Resource tables, and sensitivity of Mineral Resources to cut-off grade tables.
Table 22. Kamoa Indicated and Inferred Mineral Resource (at 1% total copper (TCu) cut-off grade).
| Category | Tonnage (Mt) | Area (km2) | Copper (%) | Vertical Thickness (m) | Contained Copper (kt) | Contained Copper (billion lbs) |
| Indicated | 760 | 55.2 | 2.73 | 5.0 | 20,800 | 45.8 |
| Inferred | 235 | 21.8 | 1.70 | 4.0 | 4,010 | 8.8 |
- Ivanhoe's Vice President, Resources George Gilchrist, a Fellow of the Geology Society of South Africa and Professional Natural Scientist (Pr. Sci. Nat) with the South African Council for Natural Scientific Professions (SACNASP), estimated the Mineral Resources under the supervision of Gordon Seibel, a Registered Member (RM) of the Society for Mining, Metallurgy and Exploration (SME), employee of Wood, who is the Qualified Person for the Mineral Resource estimate. The effective date of the estimate is 30 January 2020 and the cut-off date for drill data is 20 January 2020. Mineral Resources are reported using the CIM 2014 Definition Standards for Mineral Resources and Mineral Reserves. Mineral Resources are reported on a 100% basis. Ivanhoe holds an indirect 39.6% interest in the Project. Mineral Resources are reported inclusive of Mineral Reserves. Mineral Resources that are not Mineral Reserves do not have demonstrated economic viability.
- Mineral Resources are reported using a total copper (TCu) cut-off grade of 1% TCu and a minimum vertical thickness of 3 m. There are reasonable prospects for eventual economic extraction under assumptions of a copper price of US$3.00/lb., employment of underground mechanized room-and-pillar and drift-and-fill mining methods, and that copper concentrates will be produced and sold to a smelter. Mining costs are assumed to be US$27/t. Concentrator, tailings treatment, and general and administrative costs (G&A) are assumed to be US$17/t. Metallurgical recoveries are expected to average 84% (86% for hypogene and 81% for supergene). At a 1% TCu cut-off grade, assumed net smelter returns for 100% of Mineral Resource blocks will cover processing, tailings treatment and G&A costs.
- Reported Mineral Resources contain no allowances for hangingwall or footwall contact boundary loss and dilution. No mining recovery has been applied.
- Depth of mineralization below the surface ranges from 10 m to 1,320 m for Indicated Mineral Resources and 20 m to 1,560 m for Inferred Mineral Resources.
- Approximate drillhole spacings are 800 m for Inferred Mineral Resources and 400 m for Indicated Mineral Resources.
- Rounding as required by reporting guidelines may result in apparent summation differences between tonnes, grade and contained metal content.
Table 23. Kakula Indicated and Inferred Mineral Resource (at 1% Total Copper (TCu) cut-off grade).
| Category | Tonnage (Mt) | Area (km2) | Copper (%) | Vertical Thickness (m) | Contained Copper (kt) | Contained Copper (billion lbs) |
| Indicated | 627 | 21.7 | 2.74 | 10.3 | 17,200 | 37.9 |
| Inferred | 104 | 5.6 | 1.61 | 6.7 | 1,680 | 3.7 |
- Ivanhoe's Vice President, Resources George Gilchrist, a Fellow of the Geology Society of South Africa and Professional Natural Scientist (Pr. Sci. Nat) with the South African Council for Natural Scientific Professions (SACNASP), estimated the Mineral Resources under the supervision of Gordon Seibel, a Registered Member (RM) of the Society for Mining, Metallurgy and Exploration (SME), employee of Wood, who is the Qualified Person for the Mineral Resources. The Mineral Resources were estimated as of 10 November 2018 and the cut-off date for the drill data is 1 November 2018. On 10 February 2020, the inputs used in assessing reasonable prospects of eventual extraction and the drill data inputs were reviewed to ensure the estimate remained current. There are no changes to the estimate as a result of the review, and the estimate has an effective date of 10 February 2020. Mineral Resources are reported using the CIM 2014 Definition Standards for Mineral Resources and Mineral Reserves. Mineral Resources are reported on a 100% basis. Ivanhoe holds an indirect 39.6% interest in the Project. Mineral Resources are reported inclusive of Mineral Reserves. Mineral Resources that are not Mineral Reserves do not have demonstrated economic viability.
- Mineral Resources are reported using a total copper (TCu) cut-off grade of 1% TCu and a minimum vertical thickness of 3 m. There are reasonable prospects for eventual economic extraction under assumptions of a copper price of US$3.10/lb., employment of underground, mechanized, room-and-pillar and drift-and-fill mining methods, and that copper concentrates will be produced and sold to a smelter. Mining costs are assumed to be US$34/t. Concentrator, tailings treatment and general and administrative (G&A) costs are assumed to be US$20/t. Metallurgical recovery is assumed to average 83%. Ivanhoe is studying reducing mining costs using a controlled convergence room-and-pillar method. At a 1% TCu cut-off grade, assumed net smelter returns for 100% of Mineral Resource blocks will cover concentrator, tailings treatment and G&A costs.
- Reported Mineral Resources contain no allowances for hangingwall or footwall contact boundary loss and dilution. No mining recovery has been applied.
- Approximate drillhole spacings are 800 m for Inferred Mineral Resources and 400 m for Indicated Mineral Resources.
- Rounding as required by reporting guidelines may result in apparent differences between tonnes, grade and contained metal content.
Table 24. Kamoa sensitivity of Mineral Resources to cut-off grade.
| Indicated Mineral Resource | ||||||
| Cut-off (% Cu) | Tonnage (Mt) | Area (km2) | Copper (%) | Vertical Thickness (m) | Contained Copper (kt) | Contained Copper (billion lbs) |
| 5.0 | 44 | 4.5 | 6.14 | 3.5 | 2,690 | 5.9 |
| 4.5 | 67 | 6.7 | 5.65 | 3.6 | 3,800 | 8.4 |
| 4.0 | 107 | 10.4 | 5.13 | 3.7 | 5,490 | 12.1 |
| 3.5 | 171 | 16.4 | 4.61 | 3.7 | 7,890 | 17.4 |
| 3.0 | 256 | 24.0 | 4.15 | 3.8 | 10,700 | 23.5 |
| 2.5 | 369 | 32.8 | 3.73 | 4.1 | 13,700 | 30.3 |
| 2.0 | 504 | 41.5 | 3.33 | 4.4 | 16,800 | 37.0 |
| 1.5 | 655 | 49.4 | 2.97 | 4.8 | 19,400 | 42.8 |
| 1.0 | 760 | 55.2 | 2.73 | 5.0 | 20,800 | 45.8 |
| 0.5 | 1,185 | 59.4 | 1.99 | 7.3 | 23,600 | 52.0 |
| Inferred Mineral Resource | ||||||
| 4.0 | 1 | 0.1 | 5.47 | 3.4 | 55 | 0.1 |
| 3.5 | 4 | 0.5 | 4.12 | 3.1 | 177 | 0.4 |
| 3.0 | 13 | 1.5 | 3.51 | 3.1 | 441 | 1.0 |
| 2.5 | 30 | 3.5 | 3.08 | 3.0 | 910 | 2.0 |
| 2.0 | 58 | 6.5 | 2.66 | 3.2 | 1,540 | 3.4 |
| 1.5 | 113 | 11.9 | 2.20 | 3.4 | 2,480 | 5.5 |
| 1.0 | 235 | 21.8 | 1.70 | 4.0 | 4,010 | 8.8 |
| 0.5 | 680 | 31.4 | 1.01 | 8.0 | 6,860 | 15.1 |
The footnotes to Table 22 also apply to this table. Mineral Resources reported in Table 22 and Table 23 are not additive to this table.
Table 25. Kakula sensitivity of Mineral Resources to cut-off grade.
| Indicated Mineral Resource | ||||||
| Cut-off (% Cu) | Tonnage (Mt) | Area (km2) | Copper (%) | Vertical Thickness (m) | Contained Copper (kt) | Contained Copper (billion lbs) |
| 5.0 | 77 | 5.9 | 7.48 | 4.5 | 5,730 | 12.6 |
| 4.5 | 91 | 7.0 | 7.04 | 4.5 | 6,440 | 14.2 |
| 4.0 | 109 | 8.3 | 6.58 | 4.6 | 7,200 | 15.9 |
| 3.5 | 132 | 9.9 | 6.09 | 4.7 | 8,060 | 17.8 |
| 3.0 | 167 | 11.8 | 5.50 | 5.0 | 9,180 | 20.2 |
| 2.5 | 218 | 14.3 | 4.85 | 5.4 | 10,600 | 23.3 |
| 2.0 | 318 | 17.5 | 4.02 | 6.5 | 12,800 | 28.2 |
| 1.5 | 435 | 19.6 | 3.41 | 7.9 | 14,900 | 32.7 |
| 1.0 | 627 | 21.7 | 2.74 | 10.3 | 17,200 | 37.9 |
| 0.5 | 939 | 22.6 | 2.08 | 14.9 | 19,500 | 43.0 |
| Inferred Mineral Resource | ||||||
| 4.0 | 1 | 0.1 | 4.41 | 3.3 | 33 | 0.1 |
| 3.5 | 2 | 0.2 | 4.04 | 3.6 | 67 | 0.1 |
| 3.0 | 5 | 0.4 | 3.52 | 3.9 | 168 | 0.4 |
| 2.5 | 10 | 1.0 | 3.10 | 3.7 | 324 | 0.7 |
| 2.0 | 22 | 2.0 | 2.64 | 3.9 | 583 | 1.3 |
| 1.5 | 45 | 3.7 | 2.18 | 4.3 | 974 | 2.1 |
| 1.0 | 104 | 5.6 | 1.61 | 6.7 | 1,680 | 3.7 |
| 0.5 | 257 | 7.9 | 1.08 | 11.7 | 2,770 | 6.1 |
The footnotes to Table 23 also apply to this table. Mineral Resources reported in Table 22 and Table 23 are not additive to this table.
Table 26. Kamoa and Kakula sensitivity of Mineral Resources to cut-off grade.
| Indicated Mineral Resource | ||||||
| Cut-off (% Cu) | Tonnage (Mt) | Area (km2) | Copper (%) | Vertical Thickness (m) | Contained Copper (kt) | Contained Copper (billion lbs) |
| 5.0 | 120 | 10.4 | 6.99 | 4.1 | 8,420 | 18.6 |
| 4.5 | 159 | 13.7 | 6.45 | 4.1 | 10,200 | 22.6 |
| 4.0 | 217 | 18.7 | 5.86 | 4.1 | 12,700 | 28.0 |
| 3.5 | 304 | 26.3 | 5.25 | 4.1 | 16,000 | 35.2 |
| 3.0 | 423 | 35.8 | 4.68 | 4.2 | 19,900 | 43.7 |
| 2.5 | 587 | 47.1 | 4.14 | 4.5 | 24,300 | 53.6 |
| 2.0 | 823 | 59.0 | 3.60 | 5.0 | 29,600 | 65.3 |
| 1.5 | 1,090 | 69.0 | 3.15 | 5.7 | 34,300 | 75.6 |
| 1.0 | 1,387 | 77.0 | 2.74 | 6.5 | 38,000 | 83.7 |
| 0.5 | 2,123 | 82.0 | 2.03 | 9.4 | 43,100 | 95.0 |
| Inferred Mineral Resource | ||||||
| 4.0 | 2 | 0.2 | 5.02 | 3.4 | 88 | 0.2 |
| 3.5 | 6 | 0.6 | 4.10 | 3.2 | 244 | 0.5 |
| 3.0 | 17 | 1.9 | 3.51 | 3.2 | 609 | 1.3 |
| 2.5 | 40 | 4.5 | 3.08 | 3.2 | 1,230 | 2.7 |
| 2.0 | 80 | 8.5 | 2.66 | 3.4 | 2,120 | 4.7 |
| 1.5 | 157 | 15.6 | 2.19 | 3.6 | 3,450 | 7.6 |
| 1.0 | 339 | 27.4 | 1.68 | 4.5 | 5,690 | 12.5 |
| 0.5 | 937 | 39.3 | 1.03 | 8.7 | 9,630 | 21.2 |
The footnotes to Table 23 also apply to this table. This table is not additive to Table 22, Table 23, Table 24 and Table 25 are not additive to this table.
Appendix B - Copper price assumptions in real and nominal terms and projected annual and cumulative cash flow for the Kakula 2020 DFS and the Kakula-Kansoko 2020 PFS shown on a nominal basis, using a fixed U.S. annual inflation rate of 2%.

Figure 17. Copper price assumptions for the Kakula 2020 DFS, Kakula-Kansoko 2020 PFS and Kamoa-Kakula 2020 PEA shown on a real and nominal basis.
To view an enhanced version of Figure 17, please visit:
https://orders.newsfilecorp.com/files/3396/63350_6e9d6712f44748ed_042full.jpg
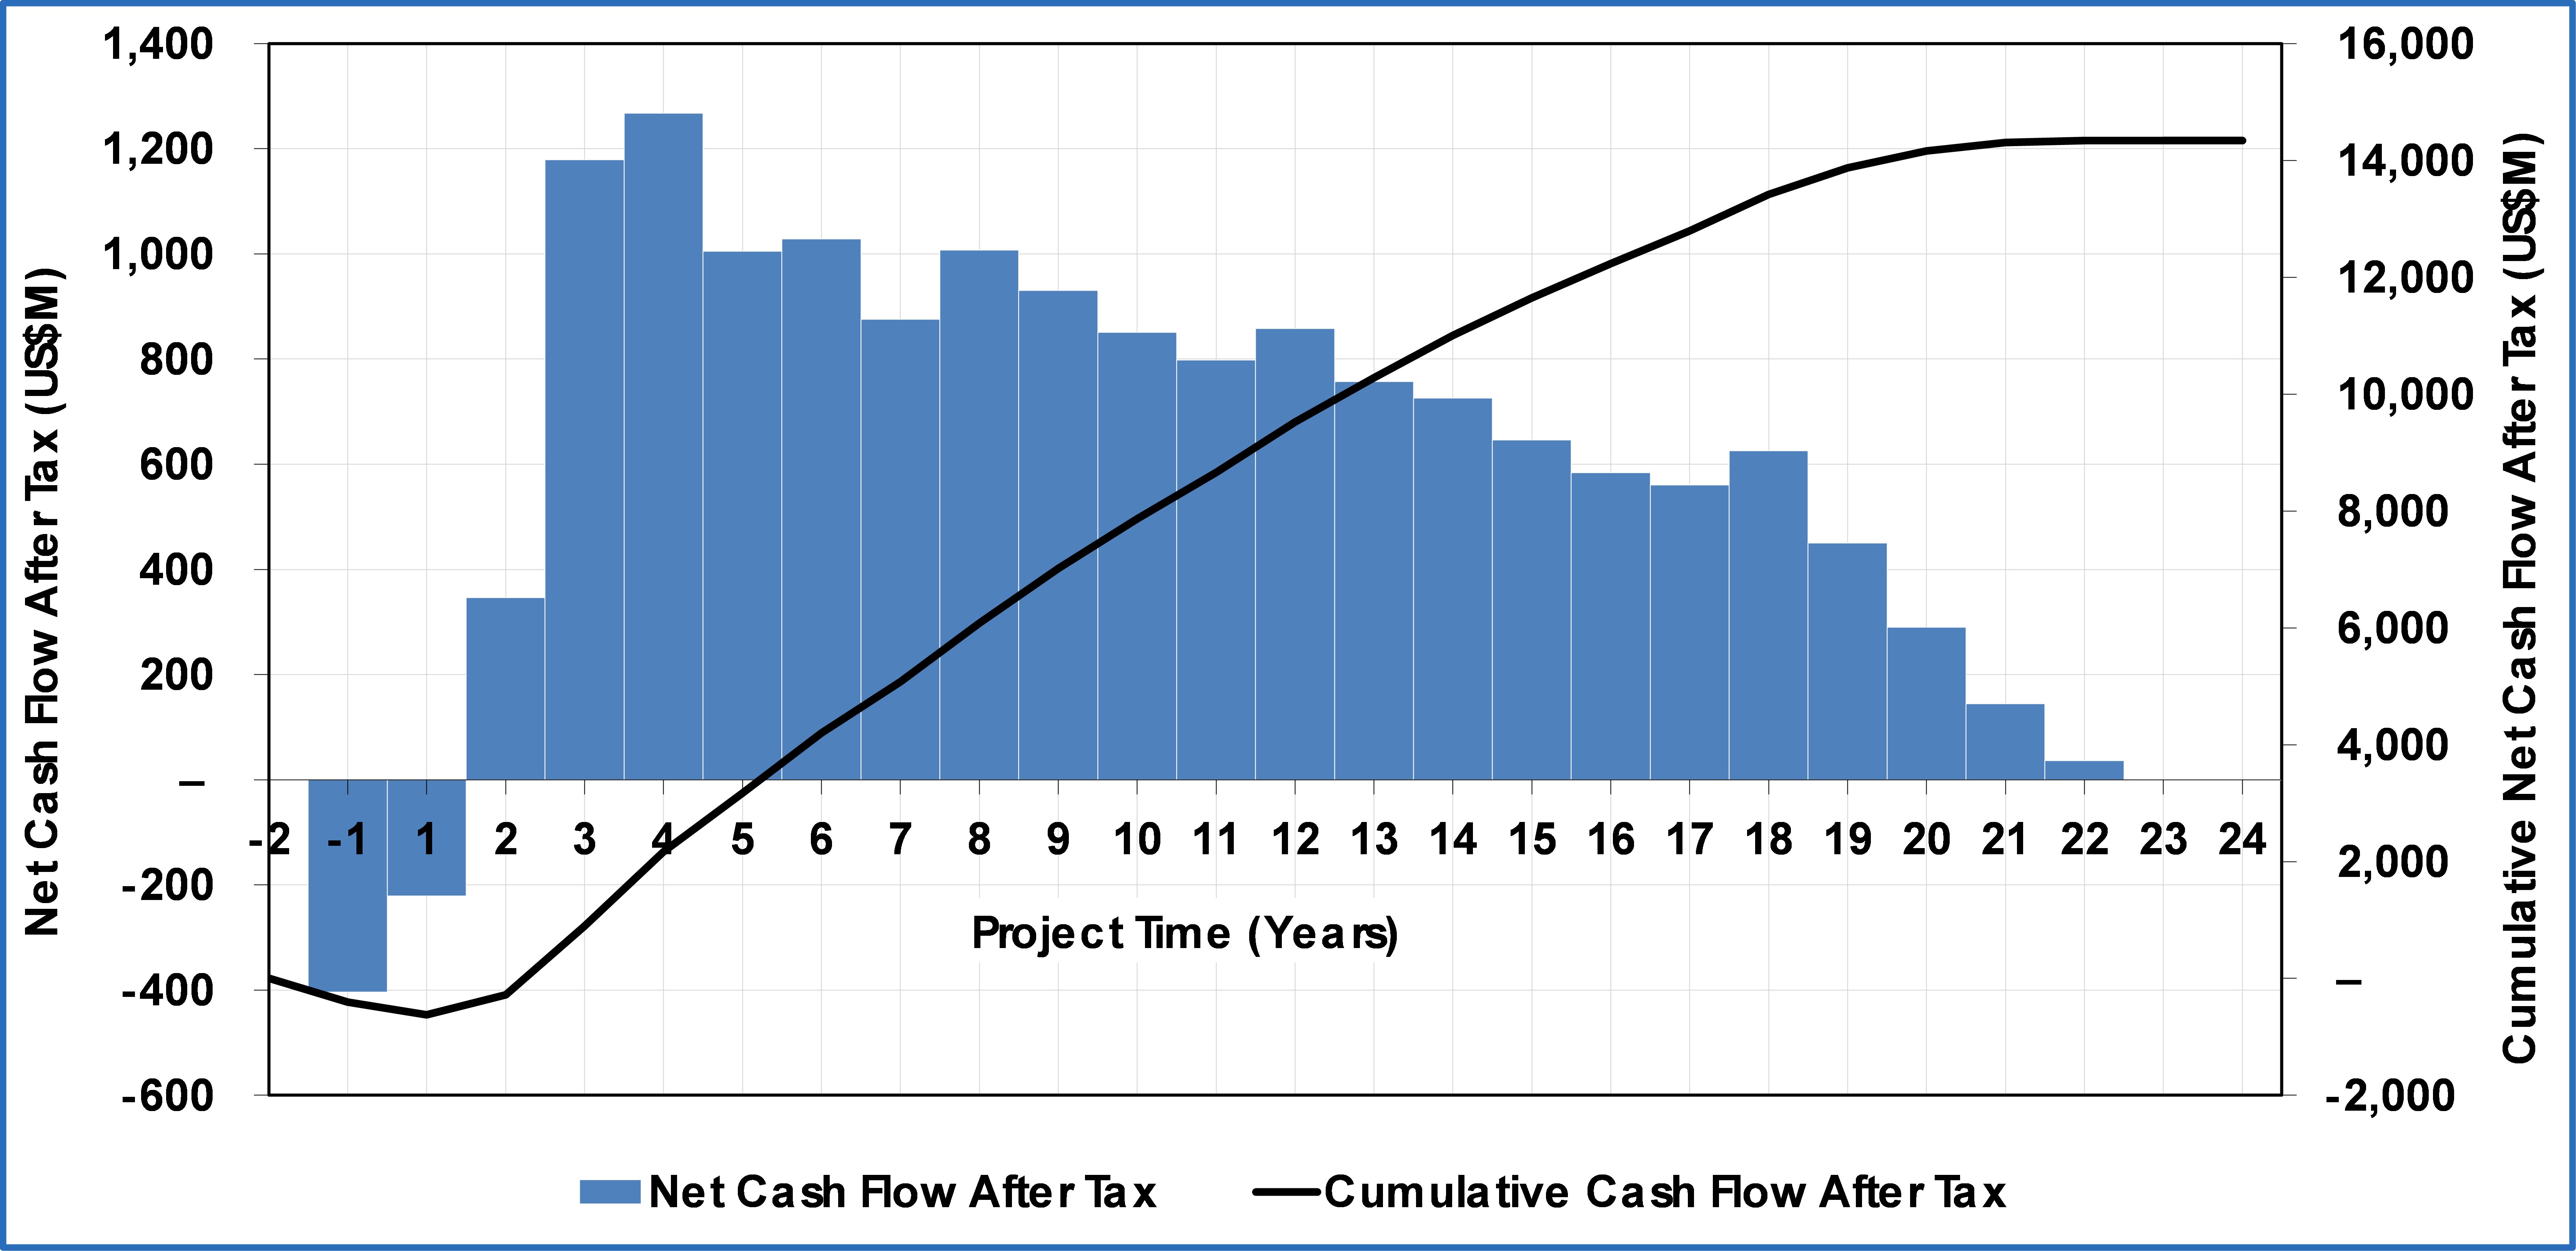
Figure 18. Kakula 2020 DFS projected annual and cumulative cash flow shown on a nominal basis. Figure by OreWin 2020.
To view an enhanced version of Figure 18, please visit:
https://orders.newsfilecorp.com/files/3396/63350_6e9d6712f44748ed_043full.jpg
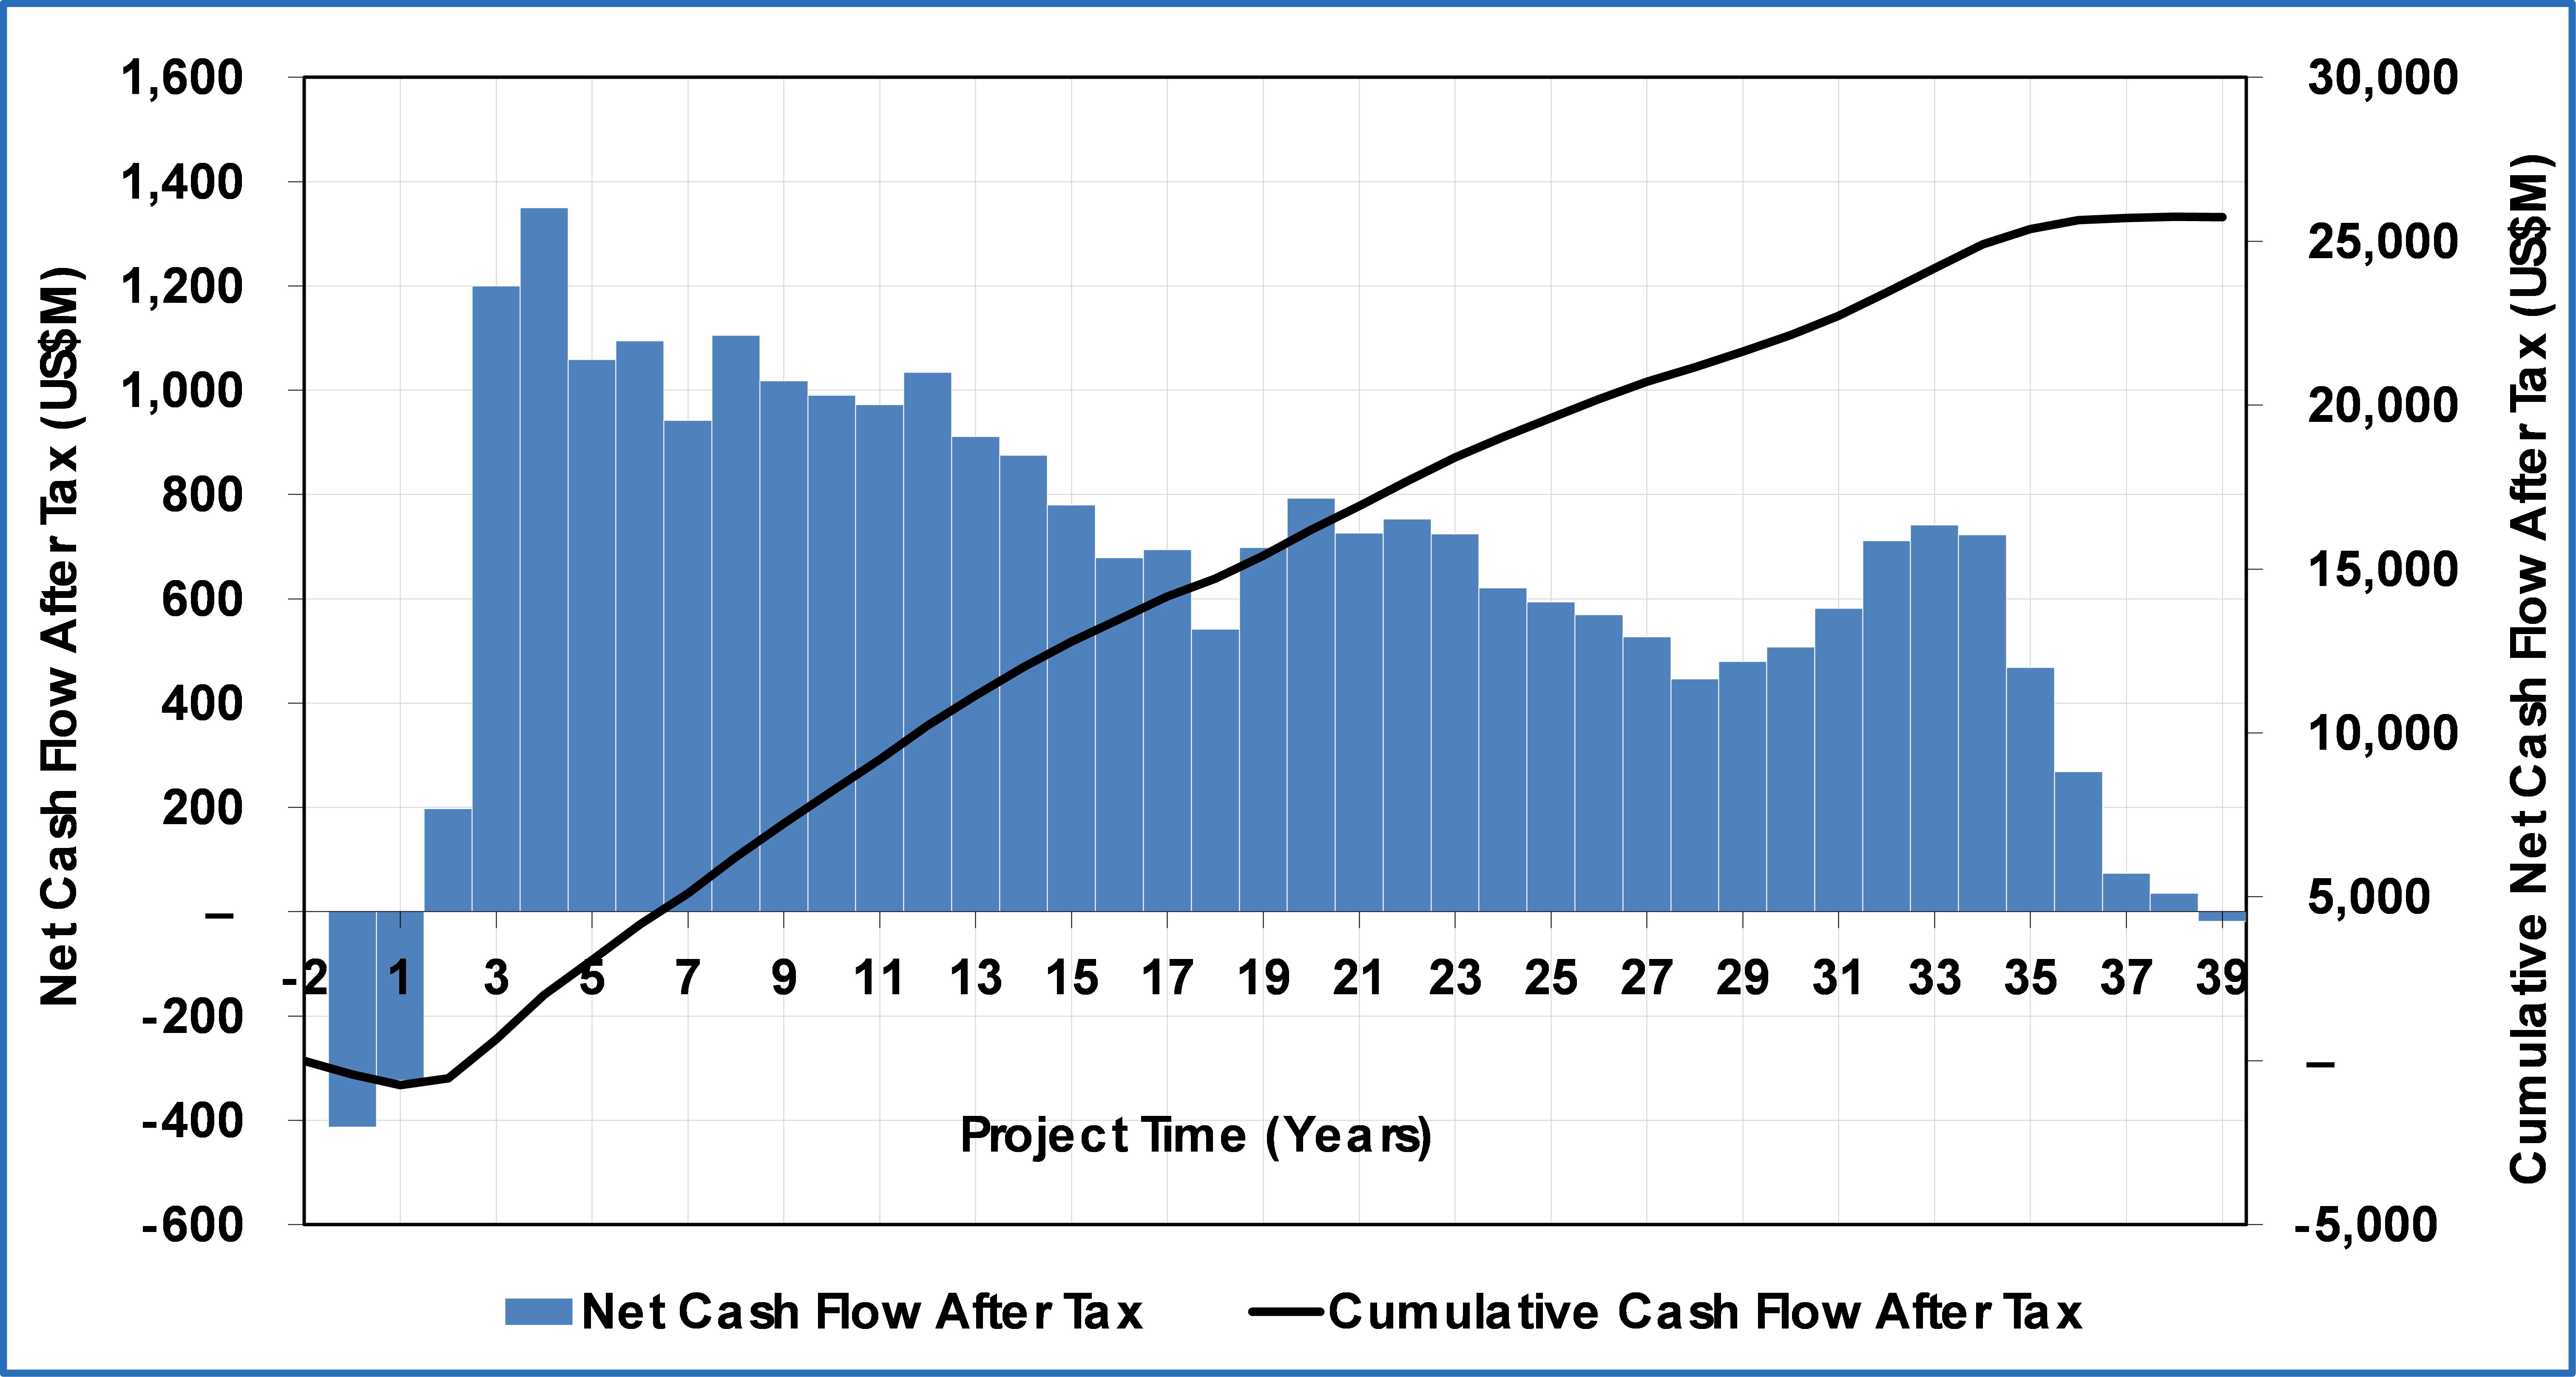
Figure 19. Kakula-Kansoko 2020 PFS projected annual and cumulative cash flow shown on a nominal basis. Figure by OreWin 2020.
To view an enhanced version of this graphic, please visit:
https://orders.newsfilecorp.com/files/3396/63350_6e9d6712f44748ed_044full.jpg
![]()
To view the source version of this press release, please visit https://www.newsfilecorp.com/release/63350
Source: Ivanhoe Mines Ltd.