Vancouver, British Columbia--(Newsfile Corp. - January 28, 2019) - Vendetta Mining Corp. (TSXV: VTT) (Vendetta or the Company) is pleased to announce the results of an independent Preliminary Economic Assessment (PEA) for its Pegmont Lead-Zinc Project (the Project) in Queensland, Australia. The PEA was prepared in accordance with National Instrument 43-101 Standards of Disclosure for Mineral Projects (NI 43-101).
The PEA was developed by a team of independent consultants, including AMC Mining Consultants (Canada) Ltd., (AMC), GR Engineering Services (GRES), and AARC Environmental Solutions (AARC). Unless otherwise noted, all dollar figures reported are Australian dollars.
Project Economic Highlights:
- Mine Life 10 years at 3,000 tonne per day open pit followed by underground
- Long Term Consensus Metal Prices: $0.94 /lb Lead, $1.09 /lb Zinc and $16.50 /oz Silver
- US Dollar to Australian Dollar exchange rate of 0.75
- Preproduction Capital of $170M and Life of Mine Sustaining Capital of $59M
- Pre-Tax NPV (8%) $201M and IRR 32%
- After Tax NPV (8%) $124 M and IRR 24%
- After tax payback period 3.5 years
- Spot price case after tax NPV (8%) $158 M and IRR 27%
- Spot price case after tax payback period 3.0 years
- Average annual production of 124M lbs of lead, 50M lbs of zinc and 298K ounces of silver
- Life of mine all-in sustaining Cash Cost (AISC) of $ 0.71 / lb payable lead in concentrate (after credits)
- Average net smelter return (NSR) 135 /t of ore
- Opportunities for continued refinement through further mine plan optimization and metallurgical test work
- There remain significant Mineral Resources not included in the PEA mine plan, which, with further drilling will potentially increase the mine life or increase production rate
Michael Williams, Vendetta's President and CEO commented "The results outlined in the PEA demonstrate a robust, stand-alone project. The Project has been able to take advantage of Pegmont's location in the centre of well-developed infrastructure to deliver a pre-start capital that makes this an achievable project to develop for an aspiring junior miner. We are pleased with the strong results of the PEA and intend to now move to add incremental tonnes that can be brought into the mine plan, continue with early permitting work and expand exploration efforts. In addition to extracting more value out of the Project Vendetta will move forward with evaluating value adding opportunities in the region. The PEA demonstrates low risk economics and well-established mining and milling techniques in a stable and supportive jurisdiction."
Project Technical and Financial Details
Economic Results and Sensitivities
Table 1 summarises the key economic inputs. Base case metal prices and exchange rates are based on institutional consensus pricing. Income and other taxes presented in the PEA are preliminary, based on general Australian corporate tax rates and do not reflect any tax planning opportunities.
Table 1: Summary of Key Economic Inputs and Results
| Unit | Base Case | Spot Case1 | ||
| Inputs | Zinc Price | US$/lb | $1.09 | $1.18 |
| Lead Price | US$/lb | $0.94 | $0.91 | |
| Silver Price | US$/oz | $16.50 | $15.31 | |
| Discount Rate | % | 8 | 8 | |
| Exchange Rate | AUD/USD | 0.75 | 0.71 | |
| Payable Metal - Lead | % | 95 | 95 | |
| Payable Metal - Zinc | % | 85 | 85 | |
| Minimum Deduction - Lead | % | 3 | 3 | |
| Minimum Deduction - Zinc | % | 8 | 8 | |
| Australian Corporate Tax | % | 30 | 30 | |
| Economics Pre-Tax | NPV at 8% | $M | 201 | 249 |
| IRR | % | 31 | 37 | |
| Payback Period | Years | 2.7 | 2.4 | |
| Economics After-Tax | LOM Cash Flows (Undiscounted) | $M | 288 | 343 |
| NPV at 8% | $M | 124 | 158 | |
| IRR | % | 24 | 27 | |
| Payback Period | Years | 3.5 | 3.0 | |
| LOM Payable Metal | Lead | M lbs | 1,069 | 1,069 |
| Zinc | M lbs | 317 | 317 | |
| Silver | M oz | 1.1 | 1.1 | |
| Costs | Cash cost2 | $/lb payable lead | 0.65 | 0.60 |
| AISC cost3 | $/t lb payable lead | 0.71 | 0.66 |
- As of January 22, 2019, spot lead, zinc and silver prices are London Metal Exchange cash buyer, and exchange rate is Reserve Bank of Australia official rate.
- Cash costs include all operating costs, smelter, refining and transportation charges, net of by‐product (zinc and silver) revenues.
- All in Sustaining Costs (AISC) include total cash costs and all sustaining capital expenditures.
As indicated in Table 2, project cashflow and NPV are particularly sensitive to changes in exchange rate and lead price, while relatively less sensitive to changes in zinc price, operating and capital expenditures. The table below shows the effect on the after-tax economics of the Project of increasing or decreasing metal prices, capital and operating costs and exchange rates against the disclosed base case assumption.
Table 2: After-Tax NPV (8%) Sensitivities
| Input | Input Factor | ||||||
| 85% | 90% | 95% | 100% | 105% | 110% | 115% | |
| Lead Price ($US / lb) | 42.7 | 70.0 | 97.3 | 124.4 | 151.1 | 177.8 | 204.5 |
| Zinc Price ($US / lb) | 95.3 | 105.1 | 114.8 | 124.4 | 134.0 | 143.6 | 153.2 |
| Capex (life of mine) | 145.9 | 138.7 | 131.6 | 124.4 | 117.1 | 109.7 | 102.2 |
| Opex (per tonne milled) | 174.9 | 158.1 | 141.2 | 124.4 | 107.4 | 90.2 | 73.1 |
| Exchange Rate (US$:A$) | 234.7 | 197.9 | 161.2 | 124.4 | 87.1 | 49.5 | 12.0 |
Capital and Operating Cost Estimates
Initial and Sustaining Capital
GRES provided capital estimates for all project infrastructure, mineral processing, bore field, gas pipeline, camp, fuel storage, offices and workshops. Equipment pricing was based on quotations and actual equipment costs from recent similar GRES projects considered representative of the Project. The capital estimate is deemed to be of a level of accuracy consistent with industry standards for a PEA. Underground sustaining capital, including decline access, ventilation and electrical was estimated by AMC based on benchmarked data.
Contingencies were applied to the capital cost estimate as an allowance by assessing the level of confidence in the engineering estimate basis and vendor or contractor information.
Table 3: Initial and Sustaining Capital
| Area | Initial ($M) | Sustaining ($M) | Total ($M) |
| Site Infrastructure (on and off site) | 39.6 | 1.2 | 40.8 |
| Mineral Processing | 69.9 | 2.1 | 72.0 |
| Mining (establishment and underground) | 18.3 | 37.0 | 55.3 |
| Project Indirects (EPCM & Owner Costs) | 32.3 | - | 32.3 |
| Closure | - | 14.5 | 14.5 |
| Contingencies (mine, process & infrastructure) | 10.3 | 3.9 | 14.2 |
| TOTAL PROJECT | 170.3 | 58.7 | 229.0 |
Operating Costs
Operating costs were estimated by GRES and AMC are summarised in Table 4
Table 4: Operating Cost Summary
| Area | Units | Cost |
| Open Pit Mining | $/tonne mined | $3.08 |
| Underground Mining | $/tonne mined | $50 |
| Processing | $/tonne milled | $26.30 |
| Common Site G&A | $/tonne milled | $6.24 |
| All-In OPEX | $/tonne milled | $74.30 |
Off-site Charges
Projected Treatment Charges (TCs) and transport charges for the lead and zinc concentrates were provided to AMC by Ocean Partners, specialist consultants and traders in base metal concentrates.
Off-site charges include concentrate transport to smelters, located in Mt Isa (Lead) and Townsville (Zinc), treatment and refining charges and potential penalties as shown in the Table 5 below.
Table 5: Off-Site Cost Summary
| Off-site Charges | Units | Lead Concentrate | Zinc Concentrate |
| Transport to Smelter | $/wmt conc. | $50 | $100.58 |
| Smelter Treatment Charge | US$/dmt conc. | $165 | $181 |
| Silver Refining | US$/oz | $0.80 | $0.80 |
| Minimum Deduction | units | 3 | 8 |
| Lead in Zinc Concentrate | US$/dmt conc. | - | $2/1% lead > 3.5% |
| Chloride (Cl) + Fluorine (F) Penalty | US$/dmt conc. | $2/100 ppm Cl+F > 500 ppm | - |
| Iron (F) Penalty | US$/dmt conc. | - | $1.50/1% iron >9% |
Note wmt: wet metric tonne, dmt: dry metric tonne
Mineral Resource Update
The basis for the PEA is the Mineral Resource estimate completed by AMC. The Company reported details of the Mineral Resource update in a news release dated August 9, 2018. Table 6 summarises the current Mineral Resource, including those Mineral Resources that were not included in the PEA mining inventory. Full details of the Mineral Resource estimate are detailed in the Technical Report.
The Company continued to drill subsequent to the effective date. Results from these additional holes and future planned programs will be used in future updates to the Mineral Resource. Assay results have been released and will be described in the Technical Report.
Table 6: 2018 Mineral Resource Estimate, as of July 31, 2018 (see notes for details)
| Classification | Material type | Tonnes (kt) | Pb (%) | Zn (%) | Ag (g/t) |
| Indicated | Transition | 1,111 | 4.9 | 2.3 | 8 |
| Sulphide | 4,647 | 6.9 | 2.6 | 12 | |
| Total | 5,758 | 6.5 | 2.6 | 11 | |
| Inferred | Transition | 1,829 | 5.2 | 2.0 | 7 |
| Sulphide | 6,447 | 5.1 | 3.1 | 9 | |
| Total | 8,277 | 5.1 | 2.8 | 8 |
1. CIM Definition Standards (2014) were used to report the Mineral Resources.
2. Cut-off grade applied to the open pit Mineral Resources is 3% Pb+Zn and that applied to the underground is 5% Pb+Zn.
3. Based on the following metal prices: US$0.95/lb for Pb, US$1.05/lb for Zn, and US$16.5/oz for silver.
4. Exchange rate of US$0.75 : A$1.0
5. Metallurgical recoveries vary by zone and material type as follows:
• Lead to lead concentrate: from 80.6% to 91.3% for transition and 88.0% to 92.7% for sulphide.
• Zinc to zinc concentrate: from 19.3% to 75.2% for transition and 61.8% to 78.5% for sulphide.
6. Using drilling results up to April 15, 2018.
7. Mineral Resource tonnages have been rounded to reflect the accuracy of the estimate, and numbers may not add due to rounding.
Mine Planning
AMC utilized the Geovia Whittle™ pit optimization process to define ultimate pit limits. The mine scheduling package Minemax was then used to target the most economic ore early in the mine life with constraints applied for the timing of in-pit tailings storage.
The open pit has been designed to be a conventional contractor truck-and-shovel operation. Average open pit mining recovery and dilution applied were 95% and 5% respectively. Material is delivered by haul truck to a run of mine (ROM) pad to be loaded into the primary crusher, with discharge from the crusher conveyed to a coarse stockpile adjacent to the mill.
Mining commences in the Burke Hinge Zone pit (BHZ), a satellite pit to the main zones which allows for 410 kt of sulphide and 80 kt of transition plant feed to be stockpiled on the ROM pad for start of processing. Mining then moves to another separate pit, Main 1, followed by Main 2 and a pushback into Main 3 to complete the locations for life of mine in-pit tailing storage. The largest pit has four stages (Main 4 to 7).
The open pit contractor mining fleet includes 90 t class trucks, loaded by 200 t diesel-hydraulic shovels. Drill and blast will be undertaken with track mounted drill rigs drilling 150 mm holes. Explosives are planned as down hole service by an explosives supplier. Haul roads are designed to be 23 m wide to allow for two-way traffic at a maximum gradient of 10%. Where possible waste is also placed onto in-pit dumps to reduce overall costs.
Over the mine life, a total of 8.9 Mt of material is sent to the mill from the open pits and a total waste movement of 110.8 Mt, for a life of mine strip ratio of 12.5:1. Figure 1 illustrates a plan view of the open pit areas.
The underground areas were assessed by comparing open pit value to the value generated using the DatamineTM Mine Shape Optimizer (MSO) software. The combined value at each depth then determines the maximum value. The underground Mineral Resources are primarily flat dipping (23° to 30°) and vary in thickness across each zone (3 m to 12 m), lending themselves to room and pillar mining. The more steeply dipping portions of Zone 3 are suitable for long hole open stoping. Three separate areas could be optimally mined from underground; one directly beneath the main pit (Zone 3A) and one to the side of the main pit (Zone 3B), and the Bridge Zone.
A minimum 20 m crown pillar is left between the pit and stopes. For room and pillar extraction AMC has applied a dilution factor of 10% at zero grade to the Mineral Resource and a mining recovery factor of 86% has been applied to the stopes. For long hole mining AMC has applied a dilution factor of 12% at zero grade to the Mineral Resource and a mining recovery factor of 95% to the stopes. Long hole stopes are backfilled with waste rock.
Contractor mining using trackless diesel loaders and trucks and diesel-electric drilling equipment is planned. Declines provide fresh air intake, with each panel having a ventilation shaft fitted with a primary exhaust fan on surface.
Figure 2 shows the underground panels in relation to the open pit stages.
Open pit mining accounts for 84% or 8.9 Mt and underground for 16% or 1.7 Mt of the total 10.6 Mt of material processed.
The Mineral Resource used for the PEA mine design does not include any of the Zone 5 resource which is included in the Mineral Resources above (Table 6). Screening work indicated that this zone needs to be expanded to arrive at a potential extraction strategy, with the possibility that these resources may ultimately be brought into a future mining plan.

Figure 1: Open Pit Areas
To view an enhanced version of Figure 1, please visit:
https://orders.newsfilecorp.com/files/2983/42470_b4d6e00fc44feabe_001full.jpg

Figure 2: Underground Mining Areas, view looking west
To view an enhanced version of Figure 2, please visit:
https://orders.newsfilecorp.com/files/2983/42470_new_pa2.jpg
Processing
Two metallurgical test work programs have been conducted on samples from Pegmont, as reported by the Company on March 6, 2017 and March 5, 2018, and summarised in Table 7. The later test work being more detailed locked cycle test work on the zones forming the basis of the mining inventory of the PEA, and were used as the basis for developing the process design criteria for the PEA.
Table 7: Recoveries and concentrate grades by Zone mined in the PEA
| Zone | Test Type | Bond Ball Mill Work Index kWh/t | Lead Concentrate | Zinc Concentrate | |||
| Pb Recovery % | Pb Grade % | Zn Recovery % | Zn Grade % | ||||
| Sulphide | |||||||
| Zone 1 | Locked Cycle | 18.4 | 91.8 | 66.3 | 75.5 | 54.5 | |
| Zone 2 | Locked Cycle | 20.9 | 90.8 | 67.8 | 71.3 | 54.9 | |
| Zone 3 | Locked Cycle | 20.1 | 89.7 | 68.2 | 73.7 | 54.8 | |
| Bridge Zone | Locked Cycle | 19.1 | 92.7 | 68.0 | 70.4 | 52.3 | |
| BHZ | Locked Cycle | 16.6 | 91.5 | 70.6 | 61.8 | 50.7 | |
| Transition | |||||||
| Zone 1 | Locked Cycle | - | 91.3 | 72.5 | 75.2 | 53.3 | |
| BHZ | Open Cycle | - | 80.6 | 57.0 | 19.3 | 48.9 | |
The process plant operating costs were developed by GRES based on a design processing rate of 3,000 tonnes per day of material for the flotation plant. The plant will normally operate 24 hours/day, 365 days/year.
A conventional sequential flotation circuit has been selected for the recovery of the lead and zinc minerals from the Pegmont deposit.
The process plant shall consist of a conventional three stage crushing and a single stage ball mill grinding circuit, followed by differential flotation of the lead and zinc minerals to produce separate saleable lead and zinc concentrates. The concentrates from the lead and zinc flotation circuits will be thickened and subsequently filtered on site for road transport to off-site smelters.
The lead concentrate will be transported by road to the Mt Isa, while the zinc concentrate will be transported by road to a rail siding located at the nearby town of Malbon, and then transported by rail to Townsville, Queensland. The containerised transport of concentrate and rail loading infrastructure will allow the transport lead and / or zinc concentrate to alternative smelters out of the port of Townsville if commercially more advantageous to do so.
Tailings from the flotation plant will be thickened to approximately 53% solids by weight. Water recovered in the tailings thickener will be recycled to the process plant. Tails will be disposed of in mined out open pits.
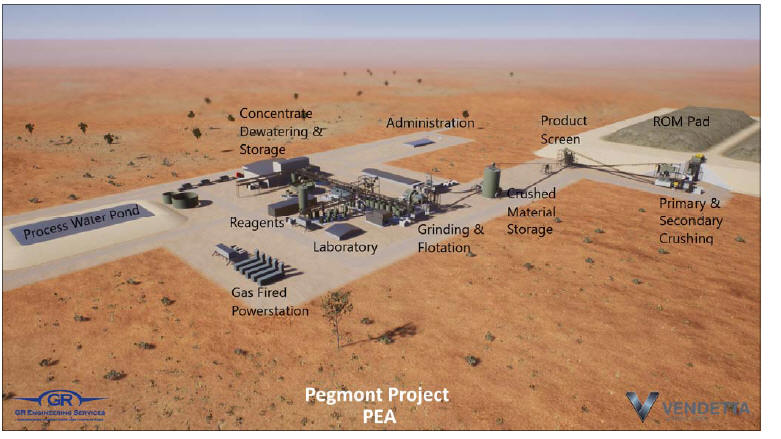
Figure 3: View of the processing plant layout, looking east
To view an enhanced version of Figure 3, please visit:
https://orders.newsfilecorp.com/files/2983/42470_new_pa4.jpg
Broken Hill type deposits typically have iron in the zinc concentrate, attracting a penalty when present at over 9%. Iron in zinc concentrate ranges from 5.5% to 11.0% in the zones at Pegmont. Fluorine + chlorine attract a penalty in the lead concentrate over 500 ppm, this is below detection limits for standard geochemical analysis for fluorine, precise fluorine analysis is pending for most of the PEA mine plan, precise fluorine assayed 50 ppm and 147 ppm in BHZ transition and sulphide respectively. In the absence of precise fluorine analysis in the other zones flouring levels of 500 ppm were assumed. Cadmium is present in the zinc concentrates at levels of between 2740 ppm and 3830 ppm in the PEA mine plan, it attracts a penalty over 4000 ppm, hence no penalty is applied.

Figure 4: Production Summary
To view an enhanced version of Figure 4, please visit:
https://orders.newsfilecorp.com/files/2983/42470_new_pa6.jpg
Infrastructure
Access
Road access to the Project is via public roads from the Selwyn Toolebuc Road, approximately 130 km south-southeast of Cloncurry.
The PEA includes developing a 10.5 km all-weather unsealed road, 3.2 km of which is new and includes a crossing of Sandy Creek from the Selwyn Toolebuc Road to the plant which then continues onto the accommodation village.
The Project will be a fly in - fly out operation, with flights from Townsville to the existing Osborne Airport, a fully sealed all weather airport, capable of servicing jet powered aircraft, currently servicing Chinova's Osborne operations. These locations are shown on a map in Figure 5.
Power
Located approximately 16 km to the south of the Project is a high-pressure natural gas pipeline, the "Cannington Lateral", which provides gas to the Osborne and Cannington Mine sites. The line runs from the main north south line supplying Mt Isa. A 16 km long spur line is planned to supply Pegmont with natural gas for power generation.
Electrical power for the operation will be gas fired generator sets, estimated to be an average load of 6.1 MW for the processing plant and associated services, and excludes the future underground mining requirement. Electrical power will be generated by gas fired generator sets, each rated at 2,500 kW at full load and expected to run at 80% load and 2000 kW each. Including mining and camp demand power, nominally four sets will be required to be running with five sets installed for demand and standby application.
Process Water
Process water shall comprise recovered water from the tailings thickener, return water from the tailings storage facility and topped up by raw water from a borefield. Both Osborne and Cannington Mines obtain process water from borefields located in the Great Artesian Basin. The PEA contemplates constructing a borefield comprising five bores sunk in the Great Australian Artesian Basin, reporting to a transfer tank, and then be pumped via a 27 km long pipe line and stored in a 1,000 m3 raw water tank located adjacent to the process water pond. No specific groundwater investigation for process water was performed for the PEA.
Airstrip, Camp and Services
During construction rooms at the existing 300-person Osborne camp will be rented from Chinova. A new 204-person accommodation village will be built to the north of the Project and shielded from both noise and light by a series of local hills. The village is located approximately 2 km from the processing plant, providing ease of access for personnel.
Communications to the Project is planned to be provided by a installing a spur (approximately 16.6 km long) of the existing Telstra Fibre optic cable which runs in parallel to the high-pressure gas line, offset by 150 m.
Potable water will be generated onsite from the raw water supply via a reverse osmosis plant before being pumped to the plant and mining amenities as well as the accommodation village.
Separate packaged sewerage treatment system will be installed to treat both the accommodation village and the processing plant/mining demands.
Diesel fuel for light vehicles and the mining fleet is stored in self bunded modular tanks.
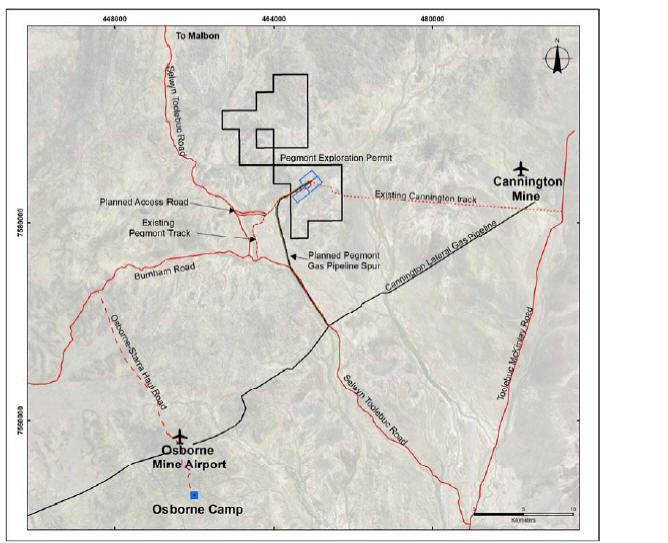
Figure 5: Map of Local Area Infrastructure
To view an enhanced version of Figure 5, please visit:
https://orders.newsfilecorp.com/files/2983/42470_new_pa8.jpg
Closure Planning
The Project will remove and stockpile topsoil from mining and infrastructure areas for use in reclamation work. Waste dumps, including in-pit dumps above pit lake water level, will be re-sloped and topsoil spread prior to revegetation. In-pit tails areas, once stable will be capped with waste rock, sloped to shed water off the tails area, and topsoil spread prior to revegetation. A closure bund will be placed around the pits.
Opportunities for Project Enhancement
Additional optimization studies are anticipated to improve the overall economics. Specific areas of advancement include;
• Geostatistical review of the Mineral Resource estimate, investigating grade envelope definition
• Further infill drilling with diamond core
• Additional metallurgical test work to advance optimisation of recovery, including variability test work
• Investigate post primary crusher material sorting
• Investigate flash flotation of lead and optimal grinding size to improve zinc floatation
• Reduce reagent and collector dosages to reduce mill OPEX
• Mining; waste dump placement, scheduling of open pit and underground interaction, more detailed underground mine planning
Permitting
The Pegmont Project will be subject to federal, state and local regulatory requirements. A new mining license covering parts of the existing exploration permit will be required, at the same time application for an infrastructure mining licences over the bore field pipeline, gas pipeline corridor will be made. The applications trigger a Right to Negotiate process with the Native Title party and landholder compensation negotiations. ARC Environmental Solutions have undertaken flora and fauna base line surveys over parts of the Project located on the exploration permit and the mining licences, indicating no threatened flora or fauna species are present. Baseline flora and fauna surveys will need to be expanded to include the infrastructure corridor containing the bore field water and gas pipelines, and the fibre optic telecommunication cable. Other baseline surveys and cultural heritage surveys over the Project area will be required.
Project development requires the existing Environmental Authority will be amended by way of an Environmental Impact Assessment (EIA), describing the Project design, baseline results and potential impacts.
About Preliminary Economic Assessments
While the results of the PEA are highly encouraging, by definition a PEA is considered preliminary in nature and includes Mineral Resources, including inferred Mineral Resources that are considered too speculative geologically to have the economic considerations applied to them that would enable them to be categorized as Mineral Reserves. Mineral Resources that are not Mineral Reserves have not yet demonstrated economic viability. Due to the uncertainty that may be attached to Mineral Resources, it cannot be assumed that all or any part of a Mineral Resource will be upgraded to Mineral Reserves. Therefore, there is no certainty that the results concluded in the PEA will be realized.
About Vendetta Mining Corp.
Vendetta Mining Corp. is a Canadian junior exploration company focused on advanced stage exploration and development at the Pegmont Lead Zinc Project in Australia. Vendetta has an option to acquire a 100% interest by completing certain work requirements and making option and advance royalty payments. Additional information on the Company can be found at www.vendettaminingcorp.com
Qualified Persons and Technical Report
Peter Voulgaris, MAIG, MAusIMM, a Director of Vendetta, is a non-independent Qualified Person as defined by NI 43-101, who participated in the preparation of the Mineral Resource update and PEA. Mr. Voulgaris has reviewed the technical content of this press release, and consents to the information provided in the form and context in which it appears.
The following Qualified Persons, under the terms of National Instrument 43-101, participated in the preparation of the Technical Report and have reviewed the technical content of this press release for the Pegmont Project and consent to the information provided in the form and context in which it appears.
Geology and Mineral Resource
John Morton Shannon, P.Geo., Principal Geologist at AMC Mining Consultants (Canada) Ltd., is an independent qualified person, as defined in NI 43-101.
Dinara Nussipakynova, P.Geo., Principal Geologist at AMC Mining Consultants (Canada) Ltd., is an independent qualified person, as defined in NI 43-101.
Mining
Philippe Lebleu P.Eng., Principal Mining Engineer at AMC Mining Consultants (Canada) Ltd., is an independent qualified person, as defined in NI 43-101.
Gary Methven P.Eng., Principal Mining Engineer at AMC Mining Consultants (Canada) Ltd., is an independent qualified person, as defined in NI 43-101.
Infrastructure, Metallurgy and Mineral Processing
Brendan Mulvihill, MAusIMM CP (Met), Senior Process Engineer at GR Engineering Services, is an independent qualified person, as defined in NI 43-101.
A Technical Report titled "Pegmont Project Mineral Resource Update and Preliminary Economic Assessment" prepared in accordance with National Instrument 43-101 Standards for Disclosure for Mineral Projects ("NI 43-101") will be filed on SEDAR within 45 days of this news release. For the final full details and further information with respect to the key assumptions, parameters, and risks associated with the results of the PEA, the Mineral Resource estimates included therein, and other technical information, please refer to the complete Technical Report to be made available on SEDAR.
ON BEHALF OF THE BOARD OF DIRECTORS
"Michael Williams"
Michael Williams
President & CEO
604-484-7855
Forward Looking Information
The TSX Venture Exchange does not accept responsibility for the adequacy or accuracy of this release.
This release includes certain statements that may be deemed to be "forward‐looking statements" within the meaning of the applicable Canadian Securities laws. All statements in this release, other than statements of historical facts are forward looking statements, including the anticipated time and capital schedule to production; estimated project economics, including but not limited to, mill recoveries, payable metals produced, production rates, payback time, capital and operating and other costs, IRR and mine plan; expected upside from additional exploration; expected capital requirements; and other future events or developments. Forward-looking statements include statements that are predictive in nature, are reliant on future events or conditions, Forward‐looking statements are often, but not always, identified by the use of words such as "seek", "anticipate", "plan", "continue", "estimate", "expect", "may", "will", "project", "predict", "potential", "targeting", "intend", "could", "might", "should", "believe" and similar expressions.
These statements involve known and unknown risks, uncertainties and other factors that may cause actual results or events to differ materially from those anticipated in such forward‐looking statements. Although the Company believes the expectations expressed in such forward‐looking statements are based on reasonable assumptions, such statements are not guarantees of future performance and actual results or developments may differ materially from those in the forward‐looking statements. Factors that could cause actual results to differ materially from those in forward‐looking statements include, but are not limited to, changes in commodities prices; changes in expected mineral production performance; unexpected increases in capital costs; exploitation and exploration results; continued availability of capital and financing; differing results and recommendations in the Feasibility Study; and general economic, market or business conditions. In addition, forward‐looking statements are subject to various risks, including but not limited to operational risk; political risk; currency risk; capital cost inflation risk; that data is incomplete or inaccurate; the limitations and assumptions within drilling, engineering and socio‐economic studies relied upon in preparing the PEA; and market risks. The reader is referred to the Company's filings with the Canadian securities regulators for disclosure regarding these and other risk factors, accessible through Vendetta Mining's profile at www.sedar.com
There is no certainty that any forward‐looking statement will come to pass and investors should not place undue reliance upon forward‐looking statements. The Company does not undertake to provide updates to any of the forward‐looking statements in this release, except as required by law.
This news release presents certain financial performance measures, including all in sustaining costs (AISC), cash cost and total cash cost that are not recognized measures under IFRS. This data may not be comparable to data presented by other silver producers. The Company believes that these generally accepted industry measures are realistic indicators of operating performance and are useful in allowing comparisons between periods. Non‐GAAP financial performance measures should be considered together with other data prepared in accordance with IFRS. This news release contains non‐GAAP financial performance measure information for a project under development incorporating information that will vary over time as the project is developed and mined. It is therefore not practicable to reconcile these forward‐looking non‐GAAP financial performance measures.
![]()
To view the source version of this press release, please visit https://www.newsfilecorp.com/release/42470
Source: Vendetta Mining Corp.