Road Town, Tortola, British Virgin Islands--(Newsfile Corp. - November 12, 2018) - Talon Metals Corp. (TSX: TLO) ("Talon" or the "Company") is pleased to announce that it has completed an initial Preliminary Economic Assessment (the "Initial PEA") over a subset of the mineral resource estimate within the Tamarack Zone (located at the Tamarack North Project, Minnesota, USA). The Company is also pleased to announce its plan to follow-up on nearby high-grade Ni-Cu-Co intercepts to determine the extent of mineralization that appears open in all directions. Talon currently has the right to acquire up to a 60% interest in the Tamarack Project on the satisfaction of certain terms and conditions.
"We completed the Initial PEA as a basis for negotiating a right to acquire up to a 60% interest in the Tamarack Project", said Henri van Rooyen, CEO of Talon. "High nickel grades, excellent metallurgical recoveries, exploration potential and good infrastructure are synonymous with the Tamarack North Project. In a world of ever decreasing nickel grades and deeper nickel mines, the Tamarack North Project Initial PEA demonstrates robust economics with pessimistic ($6.75/lb Ni), base case ($8/lb Ni) and incentive pricing ($9.50/lb Ni) after-tax Internal Rates of Return ("IRR") of 28%, 39% and 48%, respectively.[1] We have also used this opportunity to conceptualize and model the adoption of "Best Available Technologies" to protect the environment and minimize any potential future mine footprint and impact. Furthermore, we have started a metallurgical test program to simplify the Initial PEA flowsheet with the additional objective of including the remaining mineral resource estimate in the next iteration of the mine plan. Most of all, we are excited about the potential for expanding the Massive Sulphide Unit ("MSU") as outlined by Dr. Etienne Dinel below."
"Given these positive results, combined with the immediate exploration potential, we see tremendous value in our recently announced deal with Kennecott, a subsidiary of the Rio Tinto Group, whereby we negotiated the right to take over operatorship and increase our ownership position in the project to a majority stake," said Sean Werger, President of Talon.
Dr. Etienne Dinel, VP Geology for Talon said the following: "In working closely with Kennecott over the last four years, we have refined an effective combination of geological and geophysical methods, both surface and downhole, that have successfully been used to substantially increase the MSU resource at the Tamarack Project. These methods will be repeated outside of the Tamarack Zone to effectively design drill hole targets for intercepting MSU, which, if successful, will have a profound impact on any future mine plan. As is shown on the map in Figure 1 below:
- A high conductance Downhole Electromagnetic ("DHEM") Maxwell plate at 587 m from surface, below the 138 Zone will be followed up to determine if a 300 m western flank of MSU exists to the west of the mineral resource estimate. This plate is supported by an MSU vein directly below, intercepted by drill hole 12TK0160 from 587.2 m to 597.4 m, grading 2.05% Ni, 3.10% Cu, 350 ppm Co, 0.66 g/t Pt, 0.43 g/t Pd and 0.29 g/t Au (Refer to Annex A and B);
- An approximately 340 m (1,115 ft) gap in MSU between two MSU intercepts from drill hole 08TK0062 and drill hole 08TK0068 (Refer to Annex A and B) remains to be drilled following the modelling of a DHEM conductor;
- At the Tamarack Zone and the 138 Zone, massive sulphide settling occurred along the Fine Grained Orthocumulate Olivine ("FGO") keel that resembles the hull of a boat where massive sulphide settling may have occurred. We have approximately 1 km (0.6 miles) of the keel with two areas that display a similar widening of the keel (modelled from gravity and magnetic surveys as well as contouring using drill holes) where massive sulphide settling may have occurred. Drill hole 12TK0164 located approximately 900 m (2,950 ft) to the south of the 138 Zone intercepted MSU grading 3.67% Ni, 1.97% Cu, 814 ppm Co, 0.12 g/t Pt, 0.11 g/t Pd and 0.10 g/t Au from 473.43 m to 476.32 m in the flank of the FGO keel (Refer to Annex A and B);
- We have surface EM supported by drill intercepts of high grade Ni-Cu-Co mineralization over an 78,000 m2 (19 acre) area to the north-east of the Tamarack Zone between 90 m (295 feet) and 195 m (640 feet) from surface."
Figure 1 below illustrates the areas initially targeted for further exploration:

To view an enhanced version of Figure 1, please visit:
https://orders.newsfilecorp.com/files/2443/41001_db6a9a5c34e9d976_002full.jpg
Figure 1: Plan view of the Tamarack and 138 Zones as well as the 164 Zone
and the CGO Bend targeted for further exploration
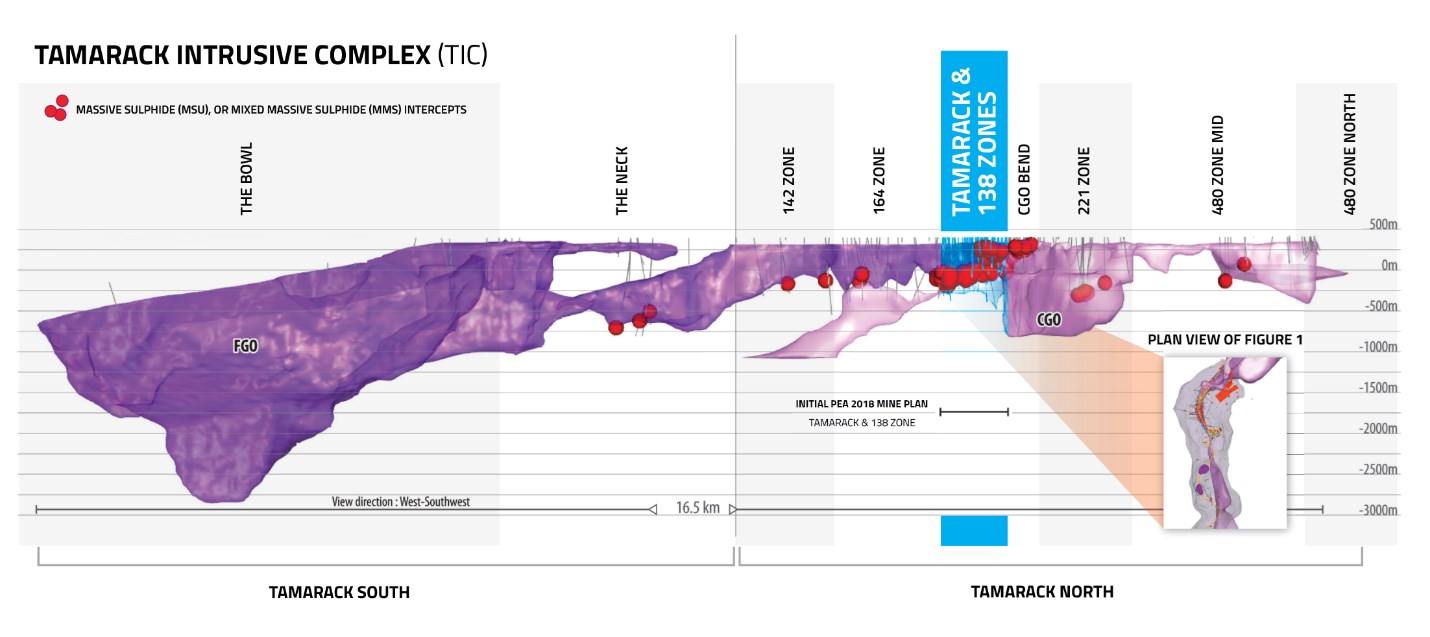
"Massive sulphides and mixed massive sulphides ("MMS") have been intercepted in 95 drill holes over a distance of 8 km (5 miles), with the most northern drill hole in the 480 Zone (Tamarack North Project) and the most southern drill hole in the Neck (Tamarack South Project) - refer to Figure 2 below. We plan to test surface geophysical techniques with deep penetration potential to evaluate the exploration potential outside of the Tamarack, 138 and 164 Zones as well as the CGO Bend."
To view an enhanced version of Figure 2, please visit:
https://orders.newsfilecorp.com/files/2443/41001_db6a9a5c34e9d976_003full.jpg
Figure 2: Long Section (Looking West) of the Tamarack Intrusive Complex showing MSU and MMS intercepts as well as the approximate location of the Tamarack North resource estimate: Effective February 15, 2018, which is the first of nine initial exploration targets
"As the Initial PEA mine plan was developed using conservative long-term commodity prices[2] and metallurgical projections to calculate the Net Smelter Return ("NSR") cut-off, most of the inferred mineral resource estimate tonnage in the Semi-Massive Sulphide Unit ("SMSU") and all of the tonnage in the 138 Zone have been excluded from this Initial PEA mine plan (refer to Figure 3 below). These conservative metallurgical projections were due to insufficient metallurgical data in the low-to-medium head grade range encountered in the inferred mineral resource. We have since commissioned a metallurgical test program to simplify the flowsheet and reagent regime and to evaluate samples from the inferred mineral resource. The simplified flowsheet will help to reduce the capital and operating costs for a given plant throughput and maximize the recovery of all sulphide minerals to minimize environmental liabilities. The objective of this metallurgical test program is to include most of the mineral resource estimate in the next iteration of the mine plan," said Oliver Peters, Talon Metallurgist and President of MetPro Management Inc. who started work on the Tamarack Project in 2016.

To view an enhanced version of Figure 3, please visit:
https://orders.newsfilecorp.com/files/2443/41001_db6a9a5c34e9d976_004full.jpg
Figure 3: Long section (looking west) of the Initial PEA conceptual mine plan development
and stopes in relation to the wireframes for resource domains
"By potentially adding the portion of the mineral resource estimate that is currently excluded from the Initial PEA mine plan, we hope to increase the production rate, mine life and consequently the Net Present Value ("NPV") of the Tamarack Project," said Vince Conte, CFO of Talon. "This work, if successful, will result in the publishing of an updated PEA."
Mineral Resource
On March 26, 2018, Talon published a technical report (the "March 2018 Technical Report") that provided an updated independent mineral resource estimate (effective date of February 15, 2018), which was used as the basis of the Initial PEA.
Table 1: Tamarack North Resource Estimate: Effective February 15, 2018
| Domain | Resource Classification | Tonnes (000) | Ni (%) | Cu (%) | Co (%) | Pt (g/t) | Pd (g/t) | Au (g/t) | *Calc NiEq (%) |
| SMSU | Indicated Resource | 3,639 | 1.83 | 0.99 | 0.05 | 0.42 | 0.26 | 0.2 | 2.45 |
| Total | Indicated Resource | 3,639 | 1.83 | 0.99 | 0.05 | 0.42 | 0.26 | 0.2 | 2.45 |
| SMSU | Inferred Resource | 1,107 | 0.90 | 0.55 | 0.03 | 0.22 | 0.14 | 0.12 | 1.25 |
| MSU | Inferred Resource | 570 | 5.86 | 2.46 | 0.12 | 0.68 | 0.51 | 0.25 | 7.24 |
| 138 Zone | Inferred Resource | 2,705 | 0.95 | 0.74 | 0.03 | 0.23 | 0.13 | 0.16 | 1.38 |
| Total | Inferred Resource | 4,382 | 1.58 | 0.92 | 0.04 | 0.29 | 0.18 | 0.16 | 2.11 |
All resources reported at a 0.83% NiEq cut-off.
No modifying factors have been applied to the estimates.
Tonnage estimates are rounded to the nearest 1,000 tonnes.
Metallurgical recovery factored in to the reporting cut-off.
* NiEq% = Ni%+ Cu% x $3.00/$8.00 + Co% x $12.00/$8.00 + Pt [g/t]/31.103 x $1,300/$8.00/22.04 + Pd [g/t]/31.103 x $700/$8.00/22.04 + Au [g/t]/31.103 x $1,200/$8.00/22.04.
Initial PEA Results
The basis of design of the Initial PEA, which was completed on a portion of the upper SMSU, the lower SMSU and the MSU are summarized in Table 2 below. The Initial PEA is preliminary in nature. The Initial PEA includes inferred mineral resources. Inferred mineral resources are considered too speculative geologically to have economic considerations applied to them that would enable them to be categorized as mineral reserves. There is no certainty that the Initial PEA will be realized.
Table 2: Basis of Design: Initial PEA*
| No | Parameter | Description |
| 1 | Approach and Mandate | Implement Best Available Technologies to protect the environment while creating a catalyst for establishing long-term, sustainable industry |
| 2 | Mine Access Method | 5 meter Diameter Shaft |
| 3 | Mine Methods | Transverse Drift-and-Fill (MSU) and Transverse Open Stoping (SMSU) |
| 4 | Type of Metallurgical Process | Bulk rougher and scavenger flotation followed by separate cleaning of the rougher and scavenger concentrates |
| 5 | Separation of Tailings | Bulk scavenger tailings are treated in a desulphurization stage to produce a low-mass high sulphur stream and high-mass low sulphur tailings |
| 6 | Backfill | Cemented paste backfill in a primary-secondary sequence utilizing all high sulphur and 37% of low sulphur tailings |
| 7 | Co-disposed Filtered Tailings Facility ("CFTF") | Filtered low sulphur tailings (at 80%-85% solids content) will be co-disposed with waste rock in a lined surface facility. The liner system of the facility will consist of a composite liner overlain by a drainage layer. Contact water from the facility will be collected using a perimeter ditch and conveyed to a water treatment plant. Upon closure, the CFTF will be encapsulated by a composite cover. |
| 8 | Life of Mine ("LOM") Feed** | SMSU Indicated: 1.706 mt at 2.48% Ni, 1.22% Cu, 0.06% Co, 0.37 g/t Pt, 0.25 g/t Pd, 0.18 g/t Au, 3.34% NiEq∆SMSU Inferred: 0.175 mt at 2.50% Ni, 1.14% Cu, 0.06% Co, 0.30 g/t Pt, 0.22 g/t Pd, 0.14 g/t Au, 3.27% NiEq∆ MSU Inferred: 0.506 mt at 5.35% Ni, 2.23% Cu, 0.11% Co, 0.63 g/t Pt, 0.47 g/t Pd, 0.23 g/t Au, 6.88% NiEq∆ Total Inferred: 0.681mt at 4.62% Ni, 1.95% Cu, 0.10% Co, 0.54 g/t Pt, 0.40 g/t Pd, 0.21 g/t Au, 5.957 NiEq∆ |
| 9 | Mine life (excluding construction period) | 7 years (6.4 years excluding partial years) |
| 10 | Mill Treatment Capacity | 1,390 tpd |
| 11 | Ni Recovery to Ni Concentrate | 85.0 % Ni |
| 12 | Cu Recovery to Cu Concentrate | 84.4 % Cu |
| 13 | Overall Cu Recovery | 94.5 % Cu |
| 14 | Ni Concentrate Grades | 14.5 % Ni, 0.8 % Cu, 0.38 % Co |
| 15 | Cu Concentrate Grades | 28.9 % Cu, 2.23 g/t Au |
| 16 | Ni Concentrate Production | 79.5 ktpa (dry) |
| 17 | Cu Concentrate Production | 18.3 ktpa (dry) |
| 18 | Payable Ni Production | 23.3 million lbs per year; 127.5 million lbs over LOM |
| 19 | Payable Cu Production | 11.1 million lbs per year; 66.8 million lbs over LOM |
| 20 | Revenue split | 80% Ni, 16% Cu, 4% Co |
| 21 | Existing Project Infrastructure | Paved highway, grid power, railway line across site, port |
| 22 | Sustainable Development | There may be the potential for a solar garden on top of CFTF to generate clean energy post-mining |
* See Initial PEA for further details in respect of the above table
** Resources included in the Life of Mine Mill Feed were evaluated by calculating the NSR, using the following metal prices: $6.75/lb Ni, $2.75/lb Cu, $20/lb Co, $1,100/oz Pt, $800/oz Pd and $1,200/oz Au. Relevant functions were applied such as metal recovery curves, smelting and refining terms, transportation costs and State royalties. The calculated NSR was then compared to the operating cost per tonne to determine inclusion or exclusion of resource into the mine plan based on value addition or destruction. These costs are US$117/tonne for the SMSU and US$157/tonne for the MSU.
∆ NiEq% = Ni%+ Cu% x $2.75/$6.75 + Co% x $20.00/$6.75 + Pt [g/t]/31.103 x $1,100/$6.75/22.04 + Pd [g/t]/31.103 x $800/$6.75/22.04 + Au [g/t]/31.103 x $1,200/$6.75/22.04.
Capital and Operating Costs
Capital costs for the Tamarack North Project were estimated by DRA Americas for the mine, process and surface facilities, and by Golder Associates Ltd. for the CFTF. All cost estimates have been forecast in US dollars using constant, second quarter 2018 dollars, (i.e. in "real" dollars), without provision for inflation or escalation, and are subject to change if new information is received or circumstances change.
The total estimated capital cost is US$182.51M (which includes an estimated US$10.0M mill salvage credit), of which US$174.31M is the initial cost required during the first 2 years and 7 months prior to the start of production. The amounts include indirect costs and amounts for contingency. Contingency varies by line item, averages 20% for the initial cost of the mine and 23.5% for the initial cost of the process and surface facilities, and totals US$29.38M.
Capital costs are detailed in the following table.
Table 3: Capital costs
| U.S. dollars millions | Initial capital cost | Sustaining capital cost | Total |
| Mine | 72.44 | 21.38 | 93.83 |
| Process and Surface Facilities | 90.85 | 1.57 | 92.43 |
| Sale of moveable equipment and mill at end of mine life | - | (10.00) | (10.00) |
| Closure costs | - | 6.25 | 6.25 |
| Working capital | 11.01 | (11.01) | - |
| Total* | 174.31 | 8.20 | 182.51 |
* Totals may not add due to rounding
The average operating costs per tonne milled for the seven year mine life is US$118.23 per tonne milled and is detailed in the table that follows.
Table 4: Operating cost per tonne
| Mining | US$/tonne | $63.94 |
| Processing | US$/tonne | $18.87 |
| Product handling | US$/tonne | $22.92 |
| CFTF | US$/tonne | $2.50 |
| General and administrative | US$/tonne | $10.00 |
| Total | US$/tonne | $118.23 |
C1 cash costs are US$2.20 per lb of payable nickel. Capital intensity is $17,200 per annual tonne of payable nickel or approximately $13,700 per annual tonne of payable nickel equivalent (excluding the impact of ramp-up/partial years in the first and last year of the mine plan).
Economic Analysis
At base case metal prices, the Tamarack North Project has an after-tax NPV of US$210M using a discount rate of 7% and an after-tax IRR of 39%. Payback from start of construction is 1.9 years on a pre-tax basis and 2.1 years after-tax. All amounts are in U.S. dollars.
The Initial PEA illustrates a high after-tax IRR, low C1 cash costs, low capital intensity and a quick payback.
Metal prices used for the base case as well as for sensitivity cases are summarized in the tables that follow. Base case prices were based on analyst consensus long-term prices. "Low" was used to estimate a pessimistic scenario. Incentive pricing is based on the price required to incentivize new mines to meet the projected increased demand for battery metals such as nickel and cobalt during the next decade.
Table 5: Assumed Metal Prices
| Unit | Low | Base case | Incentive pricing | |
| Ni | US$/lb | $6.75 | $8.00 | $9.50 |
| Cu | US$/lb | $2.75 | $3.00 | $3.25 |
| Co | US$/lb | $20.00 | $30.00 | $40.00 |
| Pt | US$/oz | $1,100 | $1,100 | $1,100 |
| Pd | US$/oz | $800 | $800 | $800 |
| Au | US$/oz | $1,200 | $1,200 | $1,200 |
After-tax and pre-tax NPV and IRR, C1 cash cost per pound of payable nickel and payback period from start of production in years for each pricing scenario is summarized in the table that follows.
Table 6: After-tax and Pre-tax NPV in US$ Millions, After-tax and Pre-tax IRR, C1 Cash Costs and Payback Period Using Low, Base Case and Incentive Metal Price Assumptions
| After-tax | Pre-tax | ||||||
| Metal price scenario | Metal price scenario | ||||||
| Low | Base | Incentive | Low | Base | Incentive | ||
| Discount rate | NPV 7% | 130 | 210 | 287 | 163 | 261 | 354 |
| NPV 8% | 119 | 195 | 268 | 150 | 244 | 332 | |
| NPV 10% | 98 | 168 | 234 | 127 | 212 | 292 | |
| IRR | 27.9% | 38.8% | 48.3% | 32.2% | 44.6% | 55.3% | |
| C1 Cash Cost per lb of payable Ni | $2.47 | $2.20 | $1.93 | $2.47 | $2.20 | $1.93 | |
| Payback from start of production in years | 2.6 | 2.1 | 1.8 | 2.5 | 1.9 | 1.6 | |
The sensitivity of the base case after-tax NPV and after-tax IRR was tested assuming changes in metal prices, operating costs, grade and capital costs in a range of +/-30% around the base case as shown in the following two figures.

To view an enhanced version of Figure 4, please visit:
https://orders.newsfilecorp.com/files/2443/41001_db6a9a5c34e9d976_005full.jpg
Figure 4: Sensitivity of Base Case after-tax NPV to changes in metal prices,
grade, operating costs and capital costs

To view an enhanced version of Figure 5, please visit:
https://orders.newsfilecorp.com/files/2443/41001_db6a9a5c34e9d976_006full.jpg
Figure 5: Sensitivity of Base Case After-tax IRR to changes in metal prices,
grade, operating costs and capital costs
Conclusions and Recommendations
The present mine plan is based on a subset of the mineral resource estimate within the Tamarack Zone as outlined in Table 2, which comprises a majority of the MSU, the lower SMSU and only a portion of the upper SMSU as further illustrated in Figure 3 above. The Initial PEA results are strong, yielding a 28% after-tax IRR using a nickel price of $6.75/lb and a copper price of $2.75/lb. The base case after-tax IRR of 39% ranks amongst the best globally. The incentive pricing after-tax IRR is 48%.
There are several short-term opportunities to increase the Tamarack North Project NPV and therefore the following are recommended:
- Define a flowsheet and conditions capable of treating all of the MSU, SMSU, and 138 Zone mineralization while at the same time simplifying the present flowsheet;
- Increase the MSU mineral resource by exploring the open MSU extensions in the Tamarack Zone, the CGO Bend and potential MSU mineralization in the 164 Zone through geophysical and drilling methods;
- Use ore sorting to preconcentrate the MSU by separating sediment/MSU and CGO/MSU midlings;
- Determine the optimal stope sizes in the SMSU;
- Update the production schedule to maximize early cash flows while maintaining a consistent plant feed;
- Consider the production of nickel and cobalt sulphates from sulphide concentrates in order to sell directly to battery manufacturers.
The Company intends to complete a pre-feasibility study once, among other things, the extent of the mineralization that will be accessed through, and processed by, the same surface infrastructure has been delineated.
The technical report referenced herein (the Initial PEA) will be filed on SEDAR (www.sedar.com) and on the Company's website (www.talonmetals.com) within 45 days.
Quality Assurance, Quality Control and Qualified Persons
For the purposes of the Initial PEA and this press release, the Qualified Persons ("QP"), as such term is defined in NI 43-101 are as follows:
The mineral resource estimate contained in this news release was prepared by or under the supervision of Mr. Brian Thomas (P.Geo.), who is a geologist independent of Talon and an employee of Golder Associates Ltd. In addition, Mr. Thomas has reviewed the sampling, analytical and test data underlying such information and has visited the site and reviewed and verified the QA/QC procedures used by Kennecott Exploration Company at the Tamarack North Project and found them to be consistent with industry standards. In Golder's opinion, the mineral resource estimate disclosed herein has been prepared in accordance with CIM best practice guidelines. For further detail please see the Technical Report entitled "Second Independent Technical Report on the Tamarack North Project - Tamarack, Minnesota", dated March 26, 2018, authored by DRA, which is available under the Company's issuer profile on SEDAR (www.sedar.com).
The mining method, including mine development, mine plan, mine capex and opex were developed by Mr. Daniel M. Gagnon, P. Eng., Sr. Mining Engineer and VP Mining and Geology for DRA Americas and is independent of the Company.
The overall Initial PEA was compiled (with inputs from other QPs as indicated) by Mr. Tim Fletcher, P. Eng., a Senior Project Manager with DRA Americas who is independent of the Company.
The economic analysis, including pre-tax and after-tax financial results and sensitivity analysis was completed Ms. Silvia Del Carpio, P.Eng, MBA, Financial Analyst for DRA Americas a who is independent of the Company.
The conceptual design of the CFTF was completed by Mr. Kebreab Habte, P.Eng., a Senior Geotechnical Engineer with Golder Associates Ltd. who is independent of the Company.
The requirements for the backfill paste recipe and underground distribution methodology were reviewed by Mr. Leslie Correia, Pr. Eng., Engineering Manager for Paterson & Cooke Canada Inc.
The QP who contributed to the identification of, and preliminary estimate of cost for, environmental permitting as affects the economic analysis presented in the Initial PEA referenced in this news release is Mr. Thomas Radue (P.E.), who is an engineer independent of Talon and an employee of Barr Engineering Co. Mr. Radue has visited the site and reviewed and verified the definition of additional baseline and detailed environmental study requirements used by Talon for the Tamarack North Project and found it to be consistent with industry standards.
About Talon
Talon is a TSX-listed company focused on the exploration and development of the Tamarack Nickel-Copper-Cobalt Project in Minnesota, USA (which comprises the Tamarack North Project and the Tamarack South Project). The Company has a well-qualified exploration and mine management team with extensive experience in project management.
For additional information on Talon, please visit the Company's website at www.talonmetals.com or contact:
Sean Werger
President
Talon Metals Corp.
Tel: (416) 500-9891
Email: werger@talonmetals.com
Forward-Looking Statements
This news release contains certain "forward-looking statements". All statements, other than statements of historical fact that address activities, events or developments that the Company believes, expects or anticipates will or may occur in the future are forward-looking statements. These forward-looking statements reflect the current expectations or beliefs of the Company based on information currently available to the Company. Such forward-looking statements include, among other things, statements relating to the results of the Initial PEA with respect to estimates of mineral resource quantities, the mining method, the basis of design of the Initial PEA, capital and operating costs, NPV, IRR, payback, cash costs, prospective drill targets, objectives in respect of metallurgical testing, targets, goals, objectives and plans, including plans for follow-up exploration and metallurgical test work and the timing thereof, the impact of adding other remaining mineral resources to the mine plan, the intent to prepare a new PEA, as well as assumptions in respect of metal pricing.
Forward-looking statements are subject to significant risks and uncertainties and other factors that could cause the actual results to differ materially from those discussed in the forward-looking statements, and even if such actual results are realized or substantially realized, there can be no assurance that they will have the expected consequences to, or effects on the Company. Factors that could cause actual results or events to differ materially from current expectations include, but are not limited to: failure to establish estimated mineral resources, the grade, quality and recovery of mineral resources varying from estimates, the uncertainties involved in interpreting drilling results and other geological data, inaccurate geological and metallurgical assumptions, including with respect to the size, grade and recoverability of mineral reserves and resources, uncertainties relating to the financing needed to further explore and develop the properties or to put a mine into production and other factors including exploration, development and operating risks, uncertainties with economic estimates, capital and operating costs, mine plan and development issues.
Any forward-looking statement speaks only as of the date on which it is made and, except as may be required by applicable securities laws, the Company disclaims any intent or obligation to update any forward-looking statement, whether as a result of new information, future events or results or otherwise. Although the Company believes that the assumptions inherent in the forward-looking statements are reasonable, forward-looking statements are not guarantees of future performance and accordingly undue reliance should not be put on such statements due to the inherent uncertainty therein.
The mineral resource figures disclosed in this news release are estimates and no assurances can be given that the indicated levels of nickel, copper, cobalt, platinum, palladium and gold will be produced. Such estimates are expressions of judgment based on knowledge, mining experience, analysis of drilling results and industry practices. Valid estimates made at a given time may significantly change when new information becomes available. While the Company believes that the resource estimates disclosed in this news release are accurate, by their nature resource estimates are imprecise and depend, to a certain extent, upon statistical inferences which may ultimately prove unreliable. If such estimates are inaccurate or are reduced in the future, this could have a material adverse impact on the Company. Mineral resources are not mineral reserves and do not have demonstrated economic viability. Inferred mineral resources are estimated on limited information not sufficient to verify geological and grade continuity or to allow technical and economic parameters to be applied. Inferred mineral resources are too speculative geologically to have economic considerations applied to them to enable them to be categorized as mineral reserves. There is no certainty that mineral resources can be upgraded to mineral reserves through continued exploration.
Annex A
Table A-1: Assay Results of Historical Drill Hole Intercepts Pertinent to the Explanation
of the Exploration Potential in the 138 Zone and the 164 Zone

To view an enhanced version of Table A-1, please visit:
https://orders.newsfilecorp.com/files/2443/41001_db6a9a5c34e9d976_007full.jpg
Annex B
Table A-2: Collar Locations of Drill Hole Intercepts Listed in Table A-1

To view an enhanced version of Table A-2, please visit:
https://orders.newsfilecorp.com/files/2443/41001_db6a9a5c34e9d976_008full.jpg
[1] Refer to Tables 5 and 6 for commodity prices used and sensitivity analysis
[2] See Table 2 (specifically, the reference to **) for commodity prices used to calculate the NSR cut-off in the Initial PEA mine plan
Source: Talon Metals Corp.