
Thunder Bay, Ontario--(Newsfile Corp. - October 5, 2026) - Thunder Gold Corp. (TSXV: TGOL) (FSE: Z25) (OTCQB: TGOLF) ("Thunder Gold" or the "Company") is pleased to announce the following exploration and infill diamond drill results from the Bench Target, at the Company's flagship Tower Mountain Property, 40 kilometres west of Thunder Bay, Ontario.
Highlights:
- TM26-218 intersected continuous mineralization over 298.5 metres averaging 0.409 g/t Au;
- TM26-218 terminated in 36.0 metres averaging 0.715 g/t Au;
- TM26-215 intersected 7.5 metres averaging 0.737 g/t Au near the end-of-hole;
- Results suggest that conversion of Inferred to Indicated is progressing; and
- Results to date continue to suggest actual drilled grades exceed predicted model grades.
TM26-215 was an exploration hole drilled from west to east from the same pad and directly under TM26-212.
TM26-218 was drilled from east to west across the main Bench-3738-Ellen ("B-E") trend (Reference Table 1.0 and Figure 1.0).
Wes Hanson, President and CEO states, "TM26-218 is the seventh consecutive infill hole to intersect, homogenous, continuous mineralization from the contact of the B-E trend to the end-of-hole. As with all our drilling to date, grades are very consistent, varying from 0.10 to 3.00 g/t Au within the B-E target and rarely exceeding 5.0 g/t Au. From the contact, TM26-218 intersected 298.5 metres averaging 0.409 g/t Au with the highest grade and continuity observed in the last 100 metres of the hole, approximately 300 metres from the current topographic surface (Reference Table 4.0 and Figure 2.0)."
"All seven infill holes completed to date have targeted Inferred resource blocks within the 2026 Mineral Resource Estimate ("MRE") with the objective of converting Inferred resources to the Indicated resource classification. Actual grades are trending higher than modeled grades, suggesting the opportunity to increase the average grade of the resource through continued drilling. We also believe the additional drilling will define continuity of both higher-grade shoots and barren, late, intrusive dikes within the B-E trend that are currently poorly understood due to a lack of drill density."
Table 1.0 provides the location and orientation of the reported holes. Figure 1.0 is a plan view showing the location of the drill holes reported in this news release.
Table 1.0 - B-E Target - Drill Hole Location Bearing and Dip
| Hole ID | Easting | Northing | Elevation | Bearing | Dip | TD |
| TM26-215 | 300669.0 | 5377168.0 | 502.0 | 40.0 | -70 | 402.0 |
| TM26-218 | 300945.0 | 5377658.0 | 493.0 | 220.0 | -54.4 | 399.0 |
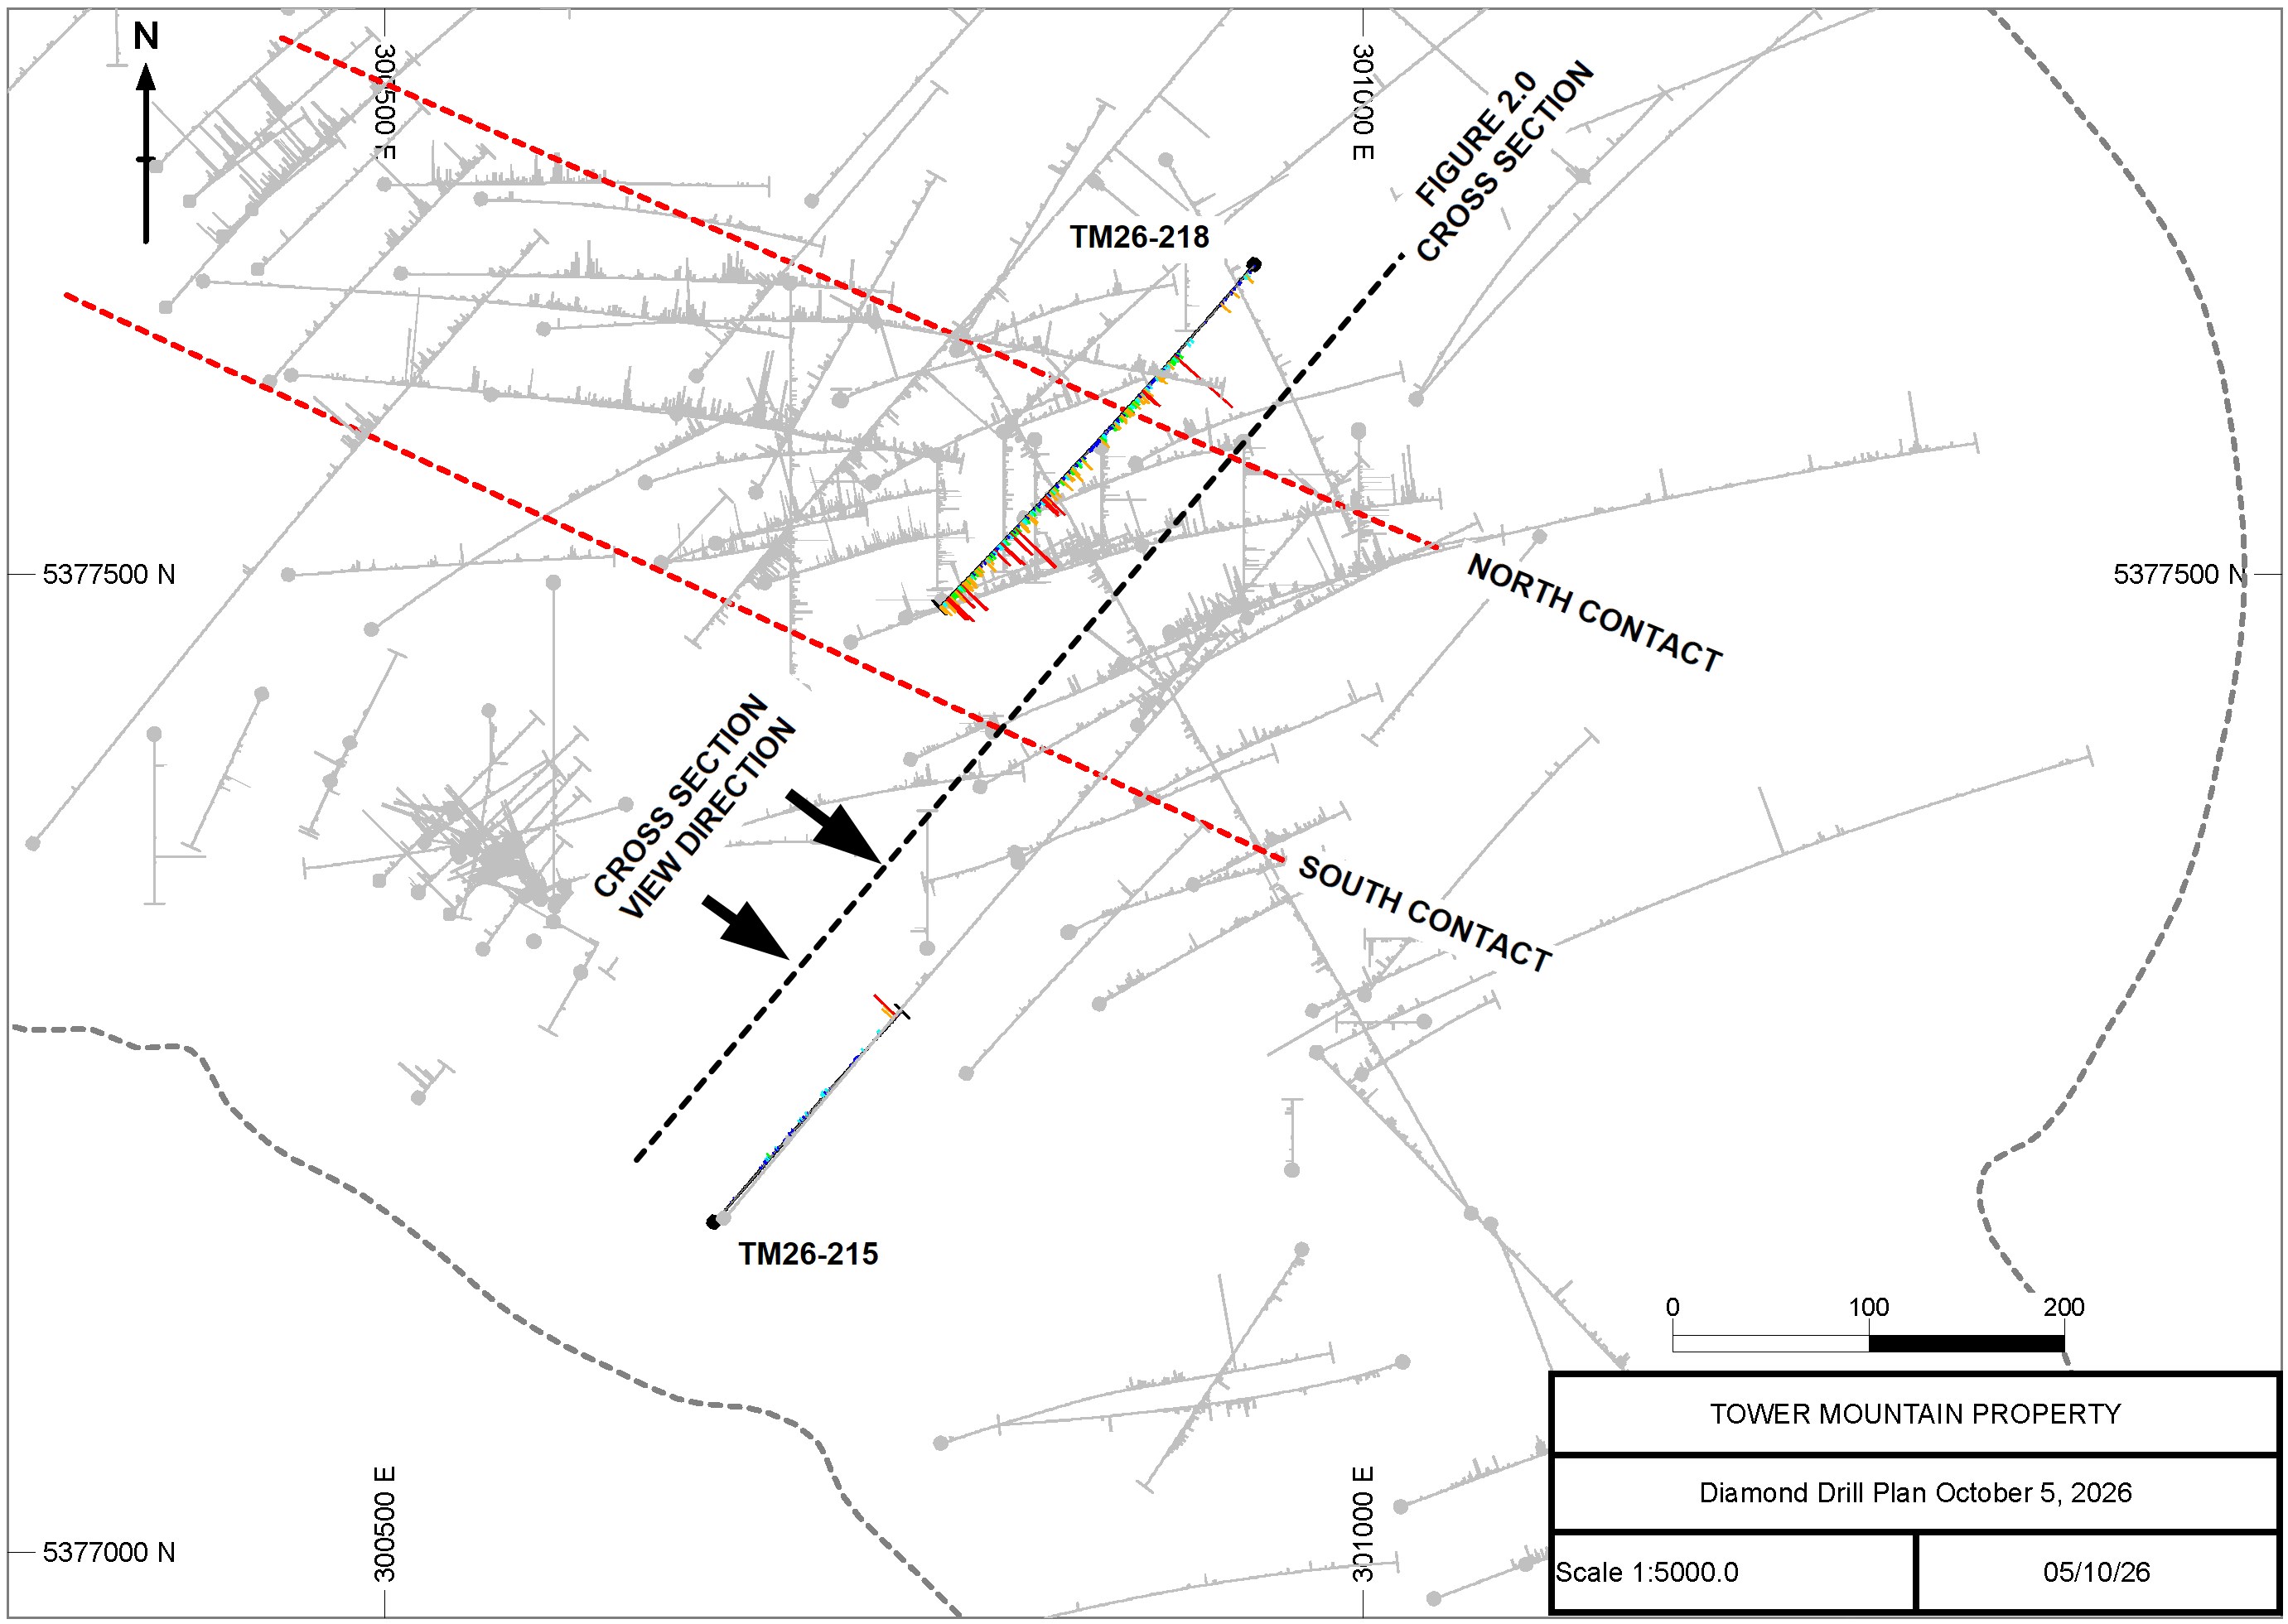
Figure 1.0 Bench Target Diamond Drill Plan - October 5, 2026
To view an enhanced version of this graphic, please visit:
https://images.newsfilecorp.com/files/5364/317104_0b40acf714f3fa6f_001full.jpg
TM26-215
TM26-215 was an exploration hole targeting waste rock southwest of the B-E contact. It was collared from the same pad and directly under TM26-212 (Reference Figure 2.0) where moderate to strong albite alteration was observed in the upper 200 metres of TM26-212. TM26-215 was designed to intersect the same albite alteration 100 metres under that observed in TM26-212.
TM26-215 intersected the targeted alteration returning scattered gold grade throughout the hole, often proximal to albite altered intervals. This is identical to the results in TM26-212 and supports the view that sub-vertical continuity persists outside the established B-E contacts.
TM26-215 terminated as planned, prior to the interpreted south contact of the B-E target (Reference Figure 2.0).
As with all the recent drill holes at Tower Mountain, both TM26-212 and TM26-215 can be extended later.
TM26-218
TM26-218 targeted the main B-E target midway between TM26-210 (661.5 metres averaging 0.554 g/t Au) and TM26-214 (409.5 metres averaging 0.307 g/t Au). Collectively, these three holes represent 100 metre step out holes across the middle portion of the B-E target.
TM26-218 intersected the north contact where expected and remained in continuous gold mineralization to the end of the hole, intersecting 298.5 metres averaging 0.409 g/t Au from 100.5 metres downhole (Reference Table 2.0). Approximately ten percent (10%) of this interval assayed less than 0.100 g/t Au (Reference Table 3.0). The observed consistency and lack of extreme outlier values is typical within the B-E target.
Table 2.0 - TM26-215 and TM26-218 Significant Results
| Hole ID | From | To | Length | Grade | True Width |
| (m) | (m) | (m) | (Au g/t) | (m) | |
| TM26-215 | 7.1 | 123.0 | 115.9 | 0.041 | Unknown |
| and | 123.0 | 130.5 | 7.5 | 0.226 | Unknown |
| and | 130.5 | 193.5 | 63.0 | 0.071 | Unknown |
| and | 193.5 | 211.5 | 18.0 | 0.128 | Unknown |
| and | 211.5 | 241.5 | 30.0 | 0.030 | Unknown |
| and | 241.5 | 253.5 | 12.0 | 0.185 | Unknown |
| and | 253.5 | 385.5 | 132.0 | 0.051 | Unknown |
| and | 385.5 | 393.0 | 7.5 | 0.737 | Unknown |
| and | 393.0 | 402.0 | 9.0 | 0.070 | Unknown |
| TM26-218 | 0.7 | 399.0 | 398.3 | 0.331 | Unknown |
| includes | 0.7 | 100.5 | 99.8 | 0.097 | Unknown |
| and | 100.5 | 399.0 | 298.5 | 0.409 | Unknown |
| includes | 100.5 | 132.0 | 31.5 | 0.464 | Unknown |
| and | 132.0 | 139.5 | 7.5 | 0.118 | Unknown |
| and | 139.5 | 187.5 | 48.0 | 0.387 | Unknown |
| and | 187.5 | 223.5 | 36.0 | 0.168 | Unknown |
| and | 223.5 | 258.0 | 34.5 | 0.323 | Unknown |
| and | 258.0 | 399.0 | 141.0 | 0.503 | Unknown |
| includes | 351.0 | 399.0 | 48.0 | 0.622 | Unknown |
| includes | 363.0 | 399.0 | 36.0 | 0.715 | Unknown |
| includes | 372.0 | 399.0 | 27.0 | 0.772 | Unknown |
True Width cannot be estimated at this time due to lack of data
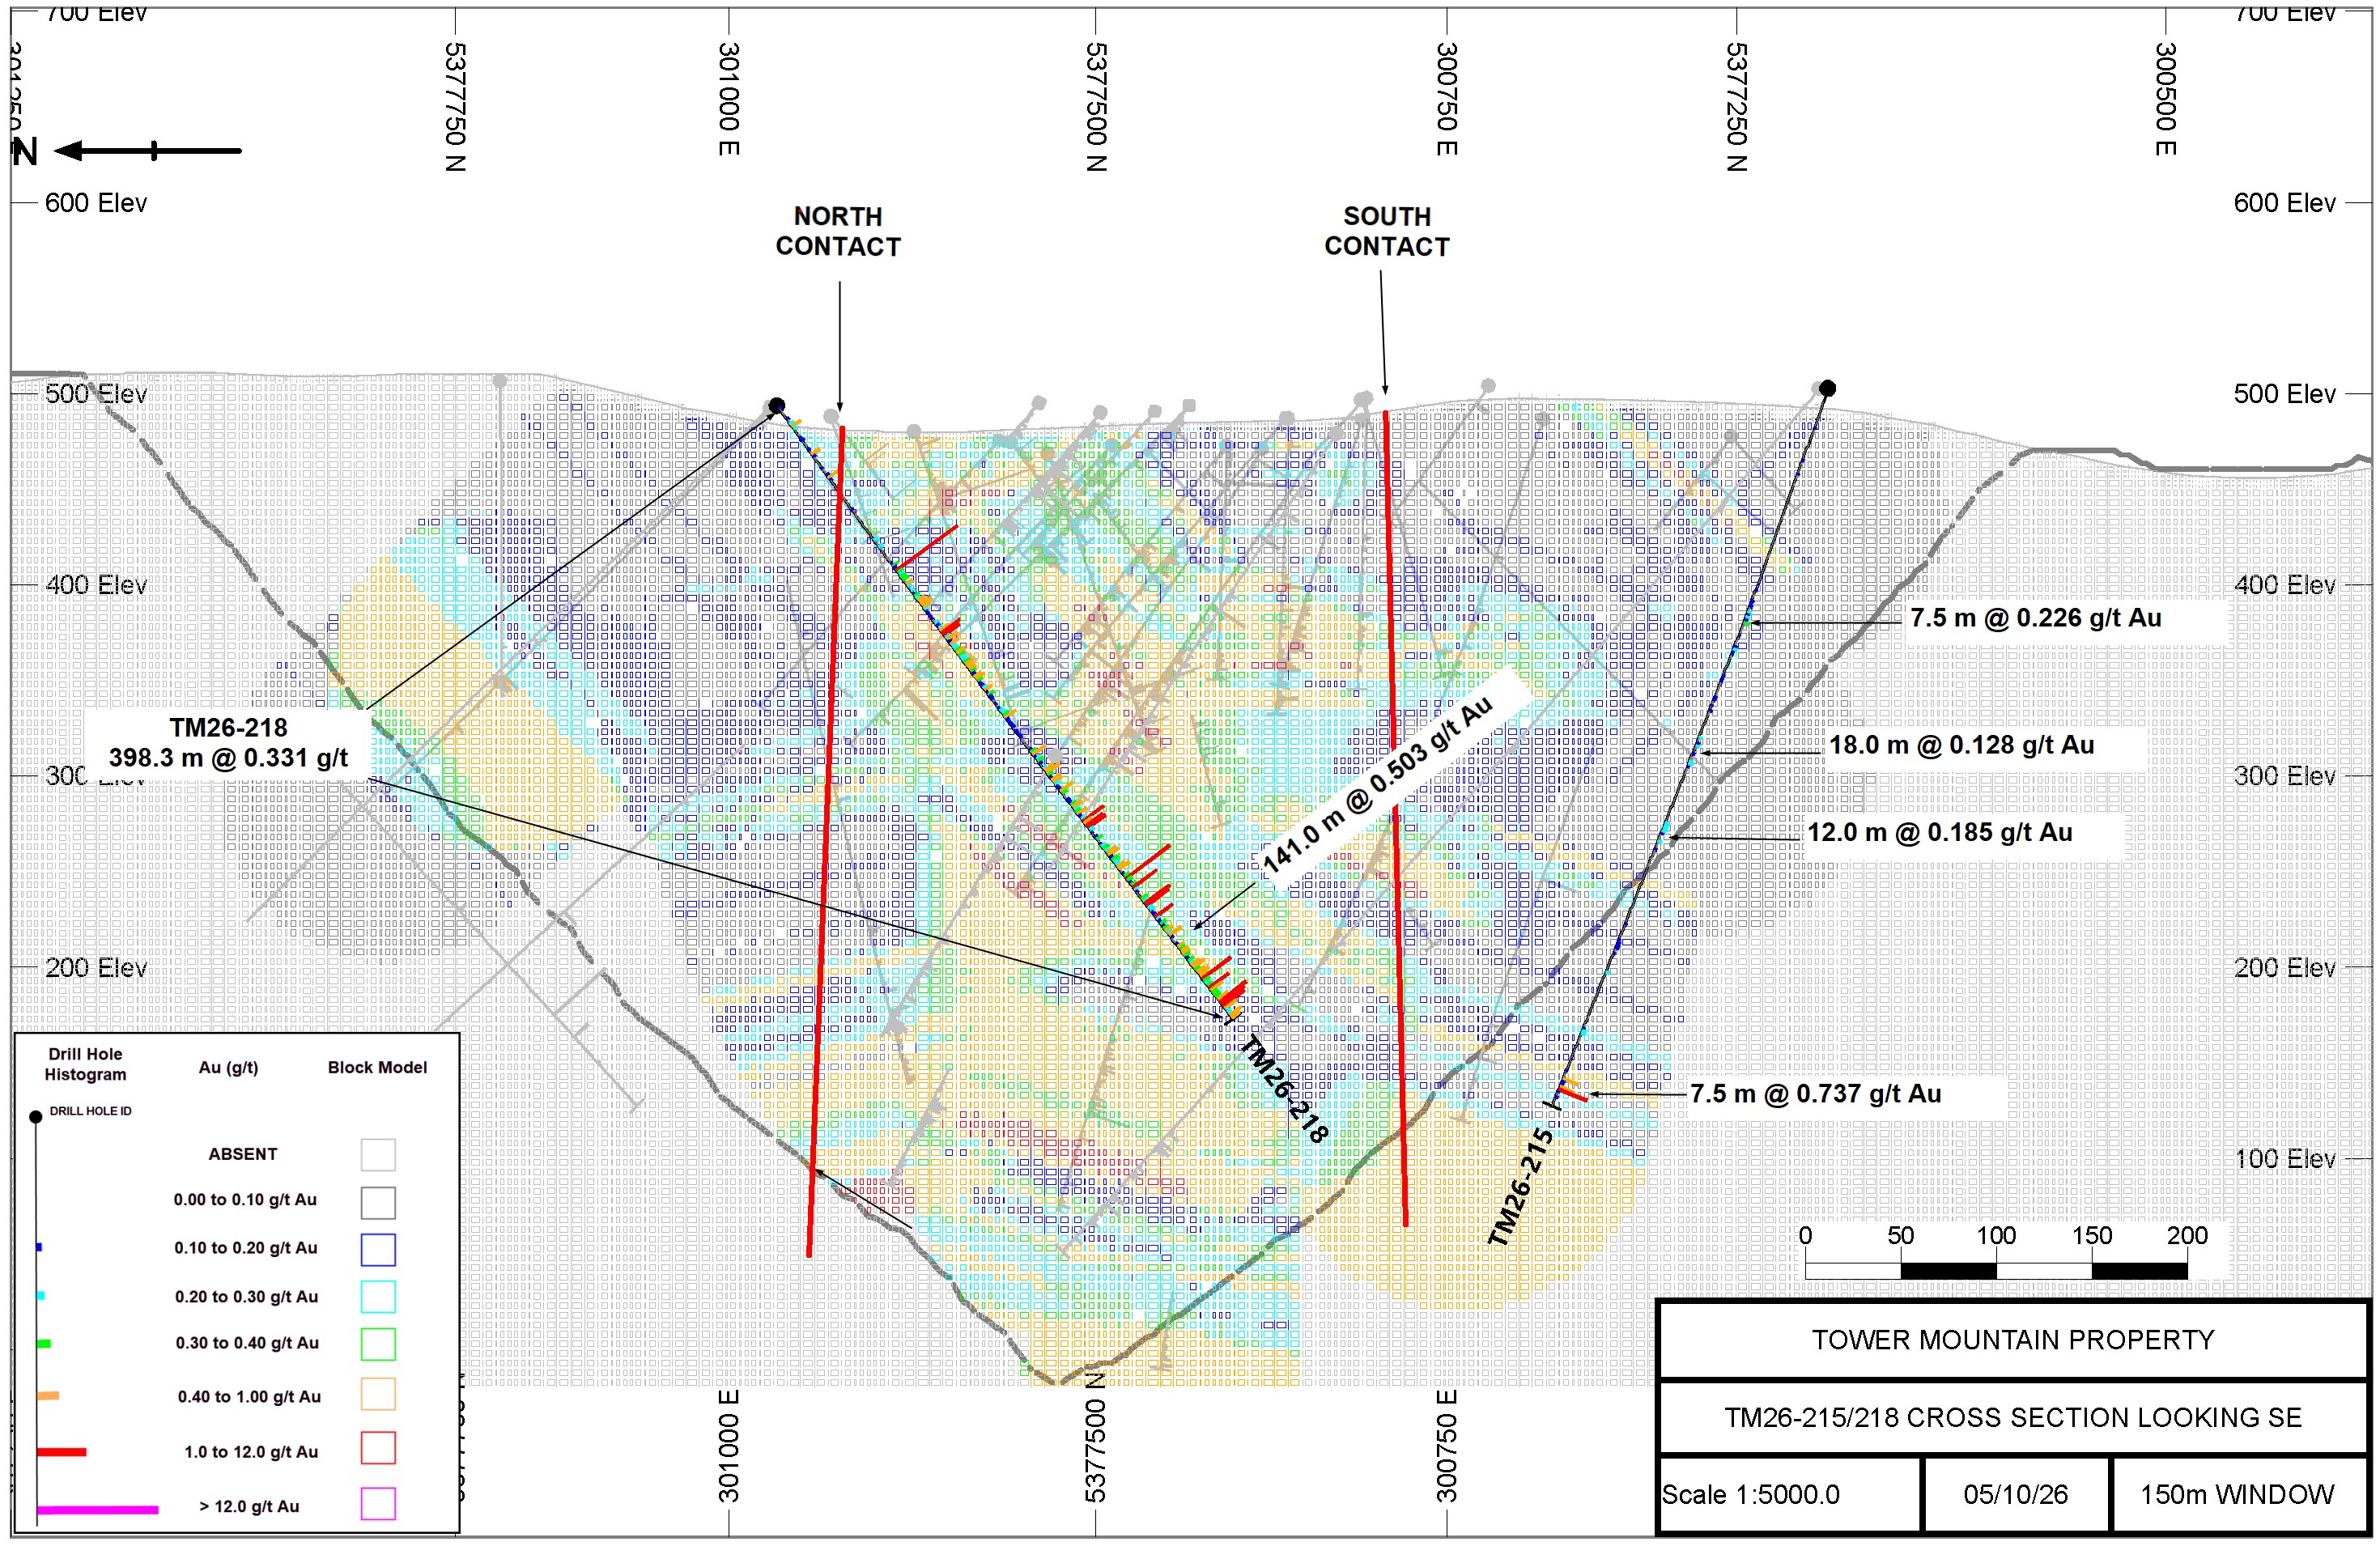
Figure 2.0 - Cross Section TM26-215 AND TM26-218 (Looking SE) 75 metre Influence
To view an enhanced version of this graphic, please visit:
https://images.newsfilecorp.com/files/5364/317104_0b40acf714f3fa6f_002full.jpg
Table 3.0 -TM26-218 Complete Results
| From (m) | To (m) | Au g/t | From (m) | To (m) | Au g/t | From (m) | To (m) | Au g/t | ||
| 0.7 | 1.7 | 0.115 | 60.0 | 61.5 | 0.023 | 120.0 | 121.5 | 0.111 | ||
| 1.7 | 3.0 | 0.018 | 61.5 | 63.0 | 0.054 | 121.5 | 123.0 | 0.314 | ||
| 3.0 | 4.5 | 0.054 | 63.0 | 64.5 | 0.039 | 123.0 | 124.5 | 0.205 | ||
| 4.5 | 6.0 | 0.035 | 64.5 | 66.0 | 0.026 | 124.5 | 126.0 | 0.412 | ||
| 6.0 | 7.5 | 0.016 | 66.0 | 67.5 | 0.142 | 126.0 | 127.5 | 0.432 | ||
| 7.5 | 9.0 | 0.156 | 67.5 | 69.0 | 0.070 | 127.5 | 129.0 | 0.665 | ||
| 9.0 | 10.5 | 0.066 | 69.0 | 70.5 | 0.079 | 129.0 | 130.5 | 0.420 | ||
| 10.5 | 12.0 | 0.277 | 70.5 | 72.0 | 0.043 | 130.5 | 132.0 | 0.232 | ||
| 12.0 | 13.5 | 0.558 | 72.0 | 73.5 | 0.079 | 132.0 | 133.5 | 0.148 | ||
| 13.5 | 15.0 | 0.212 | 73.5 | 75.0 | 0.020 | 133.5 | 135.0 | 0.106 | ||
| 15.0 | 16.5 | 0.021 | 75.0 | 76.5 | 0.003 | 135.0 | 136.5 | 0.125 | ||
| 16.5 | 18.0 | 0.015 | 76.5 | 78.0 | 0.007 | 136.5 | 138.0 | 0.123 | ||
| 18.0 | 19.5 | 0.056 | 78.0 | 79.5 | 0.003 | 138.0 | 139.5 | 0.088 | ||
| 19.5 | 21.0 | 0.140 | 79.5 | 81.0 | 0.034 | 139.5 | 141.0 | 0.252 | ||
| 21.0 | 22.5 | 0.177 | 81.0 | 82.5 | 0.044 | 141.0 | 142.5 | 0.160 | ||
| 22.5 | 24.0 | 0.026 | 82.5 | 84.0 | 0.020 | 142.5 | 144.0 | 0.254 | ||
| 24.0 | 25.5 | 0.079 | 84.0 | 85.5 | 0.038 | 144.0 | 145.5 | 0.551 | ||
| 25.5 | 27.0 | 0.039 | 85.5 | 87.0 | 0.271 | 145.5 | 147.0 | 1.190 | ||
| 27.0 | 28.5 | 0.132 | 87.0 | 88.5 | 0.064 | 147.0 | 148.5 | 1.010 | ||
| 28.5 | 30.0 | 0.044 | 88.5 | 90.0 | 0.052 | 148.5 | 150.0 | 0.283 | ||
| 30.0 | 31.5 | 0.503 | 90.0 | 91.5 | 0.296 | 150.0 | 151.5 | 0.667 | ||
| 31.5 | 33.0 | 0.163 | 91.5 | 93.0 | 0.052 | 151.5 | 153.0 | 0.156 | ||
| 33.0 | 34.5 | 0.060 | 93.0 | 94.5 | 0.050 | 153.0 | 154.5 | 0.534 | ||
| 34.5 | 36.0 | 0.043 | 94.5 | 96.0 | 0.047 | 154.5 | 156.0 | 0.225 | ||
| 36.0 | 37.5 | 0.036 | 96.0 | 97.5 | 0.028 | 156.0 | 157.5 | 0.256 | ||
| 37.5 | 39.0 | 0.048 | 97.5 | 99.0 | 0.084 | 157.5 | 159.0 | 0.369 | ||
| 39.0 | 40.5 | 0.109 | 99.0 | 100.5 | 0.098 | 159.0 | 160.5 | 0.546 | ||
| 40.5 | 42.0 | 0.074 | 100.5 | 102.0 | 0.118 | 160.5 | 162.0 | 0.361 | ||
| 42.0 | 43.5 | 0.055 | 102.0 | 103.5 | 0.388 | 162.0 | 163.5 | 0.298 | ||
| 43.5 | 45.0 | 0.153 | 103.5 | 105.0 | 0.191 | 163.5 | 165.0 | 0.215 | ||
| 45.0 | 46.5 | 0.684 | 105.0 | 106.5 | 3.970 | 165.0 | 166.5 | 0.392 | ||
| 46.5 | 48.0 | 0.144 | 106.5 | 108.0 | 0.365 | 166.5 | 168.0 | 0.505 | ||
| 48.0 | 49.5 | 0.047 | 108.0 | 109.5 | 0.269 | 168.0 | 169.5 | 0.440 | ||
| 49.5 | 51.0 | 0.025 | 109.5 | 111.0 | 0.341 | 169.5 | 171.0 | 0.418 | ||
| 51.0 | 52.5 | 0.043 | 111.0 | 112.5 | 0.338 | 171.0 | 172.5 | 0.344 | ||
| 52.5 | 54.0 | 0.042 | 112.5 | 114.0 | 0.061 | 172.5 | 174.0 | 0.156 | ||
| 54.0 | 55.5 | 0.061 | 114.0 | 115.5 | 0.412 | 174.0 | 175.5 | 0.404 | ||
| 55.5 | 57.0 | 0.052 | 115.5 | 117.0 | 0.217 | 175.5 | 177.0 | 0.509 | ||
| 57.0 | 58.5 | 0.083 | 117.0 | 118.5 | 0.072 | 177.0 | 178.5 | 0.342 | ||
| 58.5 | 60.0 | 0.062 | 118.5 | 120.0 | 0.205 | 178.5 | 180.0 | 0.103 |
Table 3.0 -TM26-218 Complete Results (continued)
| From (m) | To (m) | Au g/t | From (m) | To (m) | Au g/t | From (m) | To (m) | Au g/t | ||
| 180.0 | 181.5 | 0.158 | 240.0 | 241.5 | 0.138 | 300.0 | 301.5 | 0.689 | ||
| 181.5 | 183.0 | 0.275 | 241.5 | 243.0 | 0.559 | 301.5 | 303.0 | 0.059 | ||
| 183.0 | 184.5 | 0.484 | 243.0 | 244.5 | 0.512 | 303.0 | 304.5 | 0.110 | ||
| 184.5 | 186.0 | 0.146 | 244.5 | 246.0 | 0.275 | 304.5 | 306.0 | 0.346 | ||
| 186.0 | 187.5 | 0.377 | 246.0 | 247.5 | 0.126 | 306.0 | 307.5 | 2.850 | ||
| 187.5 | 189.0 | 0.152 | 247.5 | 249.0 | 0.127 | 307.5 | 309.0 | 0.300 | ||
| 189.0 | 190.5 | 0.147 | 249.0 | 250.5 | 0.801 | 309.0 | 310.5 | 0.178 | ||
| 190.5 | 192.0 | 0.059 | 250.5 | 252.0 | 0.322 | 310.5 | 312.0 | 0.321 | ||
| 192.0 | 193.5 | 0.134 | 252.0 | 253.5 | 0.057 | 312.0 | 313.5 | 1.580 | ||
| 193.5 | 195.0 | 0.092 | 253.5 | 255.0 | 0.075 | 313.5 | 315.0 | 0.290 | ||
| 195.0 | 196.5 | 0.146 | 255.0 | 256.5 | 0.192 | 315.0 | 316.5 | 0.123 | ||
| 196.5 | 198.0 | 0.222 | 256.5 | 258.0 | 0.167 | 316.5 | 318.0 | 0.007 | ||
| 198.0 | 199.5 | 0.288 | 258.0 | 259.5 | 0.331 | 318.0 | 319.5 | 0.003 | ||
| 199.5 | 201.0 | 0.374 | 259.5 | 261.0 | 0.602 | 319.5 | 321.0 | 0.397 | ||
| 201.0 | 202.5 | 0.678 | 261.0 | 262.5 | 0.268 | 321.0 | 322.5 | 0.297 | ||
| 202.5 | 204.0 | 0.199 | 262.5 | 264.0 | 0.332 | 322.5 | 324.0 | 1.600 | ||
| 204.0 | 205.5 | 0.130 | 264.0 | 265.5 | 0.584 | 324.0 | 325.5 | 1.460 | ||
| 205.5 | 207.0 | 0.165 | 265.5 | 267.0 | 0.174 | 325.5 | 327.0 | 0.256 | ||
| 207.0 | 208.5 | 0.185 | 267.0 | 268.5 | 0.218 | 327.0 | 328.5 | 0.297 | ||
| 208.5 | 210.0 | 0.026 | 268.5 | 270.0 | 1.360 | 328.5 | 330.0 | 0.135 | ||
| 210.0 | 211.5 | 0.114 | 270.0 | 271.5 | 0.548 | 330.0 | 331.5 | 0.180 | ||
| 211.5 | 213.0 | 0.137 | 271.5 | 273.0 | 1.070 | 331.5 | 333.0 | 1.120 | ||
| 213.0 | 214.5 | 0.162 | 273.0 | 274.5 | 1.180 | 333.0 | 334.5 | 0.228 | ||
| 214.5 | 216.0 | 0.140 | 274.5 | 276.0 | 0.262 | 334.5 | 336.0 | 0.171 | ||
| 216.0 | 217.5 | 0.092 | 276.0 | 277.5 | 0.100 | 336.0 | 337.5 | 0.365 | ||
| 217.5 | 219.0 | 0.044 | 277.5 | 279.0 | 0.042 | 337.5 | 339.0 | 0.171 | ||
| 219.0 | 220.5 | 0.081 | 279.0 | 280.5 | 0.169 | 339.0 | 340.5 | 0.310 | ||
| 220.5 | 222.0 | 0.072 | 280.5 | 282.0 | 0.367 | 340.5 | 342.0 | 0.497 | ||
| 222.0 | 223.5 | 0.198 | 282.0 | 283.5 | 0.052 | 342.0 | 343.5 | 0.274 | ||
| 223.5 | 225.0 | 0.341 | 283.5 | 285.0 | 0.133 | 343.5 | 345.0 | 0.759 | ||
| 225.0 | 226.5 | 0.848 | 285.0 | 286.5 | 0.298 | 345.0 | 346.5 | 0.179 | ||
| 226.5 | 228.0 | 0.123 | 286.5 | 288.0 | 0.311 | 346.5 | 348.0 | 0.093 | ||
| 228.0 | 229.5 | 0.274 | 288.0 | 289.5 | 0.222 | 348.0 | 349.5 | 0.064 | ||
| 229.5 | 231.0 | 0.358 | 289.5 | 291.0 | 0.618 | 349.5 | 351.0 | 0.178 | ||
| 231.0 | 232.5 | 0.161 | 291.0 | 292.5 | 0.691 | 351.0 | 352.5 | 0.410 | ||
| 232.5 | 234.0 | 0.042 | 292.5 | 294.0 | 0.184 | 352.5 | 354.0 | 0.362 | ||
| 234.0 | 235.5 | 0.212 | 294.0 | 295.5 | 0.390 | 354.0 | 355.5 | 0.497 | ||
| 235.5 | 237.0 | 0.566 | 295.5 | 297.0 | 0.222 | 355.5 | 357.0 | 0.411 | ||
| 237.0 | 238.5 | 0.855 | 297.0 | 298.5 | 0.254 | 357.0 | 358.5 | 0.305 | ||
| 238.5 | 240.0 | 0.300 | 298.5 | 300.0 | 0.462 | 358.5 | 360.0 | 0.181 |
Table 3.0 -TM26-218 Complete Results (continued)
| From (m) | To (m) | Au g/t | From (m) | To (m) | Au g/t | From (m) | To (m) | Au g/t | ||
| 360.0 | 361.5 | 0.354 | ||||||||
| 361.5 | 363.0 | 0.216 | ||||||||
| 363.0 | 364.5 | 0.520 | ||||||||
| 364.5 | 366.0 | 0.704 | ||||||||
| 366.0 | 367.5 | 0.334 | ||||||||
| 367.5 | 369.0 | 0.548 | ||||||||
| 369.0 | 370.5 | 0.673 | ||||||||
| 370.5 | 372.0 | 0.496 | ||||||||
| 372.0 | 373.5 | 1.870 | ||||||||
| 373.5 | 375.0 | 0.369 | ||||||||
| 375.0 | 376.5 | 0.283 | ||||||||
| 376.5 | 378.0 | 0.340 | ||||||||
| 378.0 | 379.5 | 1.300 | ||||||||
| 379.5 | 381.0 | 0.795 | ||||||||
| 381.0 | 382.5 | 0.343 | ||||||||
| 382.5 | 384.0 | 0.329 | ||||||||
| 384.0 | 385.5 | 0.327 | ||||||||
| 385.5 | 387.0 | 0.663 | ||||||||
| 387.0 | 388.5 | 1.780 | ||||||||
| 388.5 | 390.0 | 1.500 | ||||||||
| 390.0 | 391.5 | 1.420 | ||||||||
| 391.5 | 393.0 | 0.794 | ||||||||
| 393.0 | 394.5 | 0.243 | ||||||||
| 394.5 | 396.0 | 0.203 | ||||||||
| 396.0 | 397.5 | 0.798 | ||||||||
| 397.5 | 399.0 | 0.542 |
MRE Reconciliation
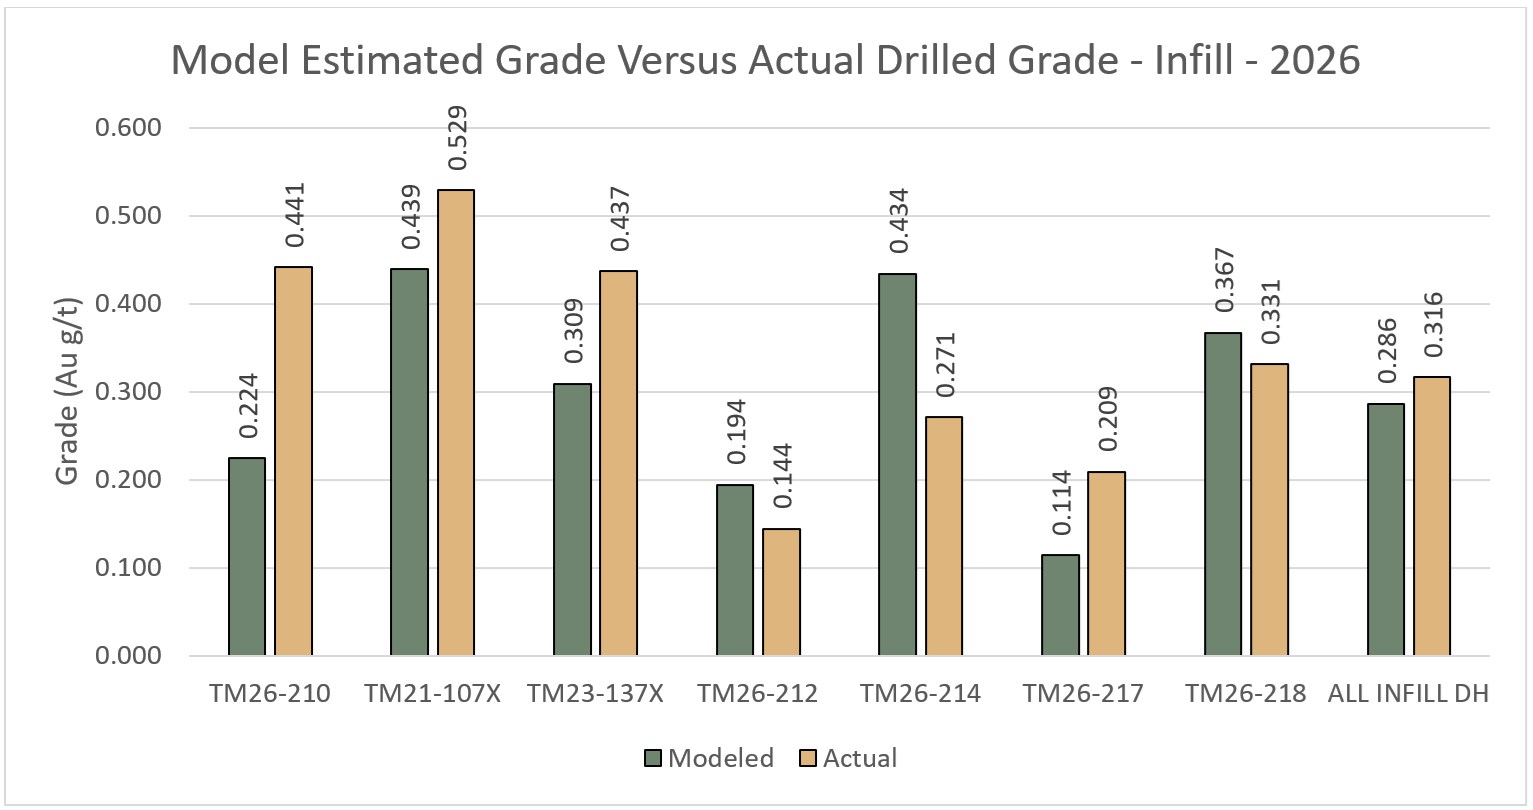
Reconciliation of drill results to date for the Bench Target relative to the 2026 MRE model suggest an overall grade increase relative to model-predicted grades. Figure 3.0 presents a summary of model-predicted grades compared to actual drilled grade for the seven (7) infill holes completed to date. All seven holes post-date the 2026 MRE model and therefore can be compared directly to model-predicted grades to measure the predictive accuracy of the model.
The results indicate significant variation on a hole-by-hole basis, ranging from a low of -38% (TM26-214) to a high of 100% (TM26-210). This is typical and within expected tolerances. On a weighted average basis, the comparison suggests that actual drilled grades are ~10% higher than the predicted modeled grade.
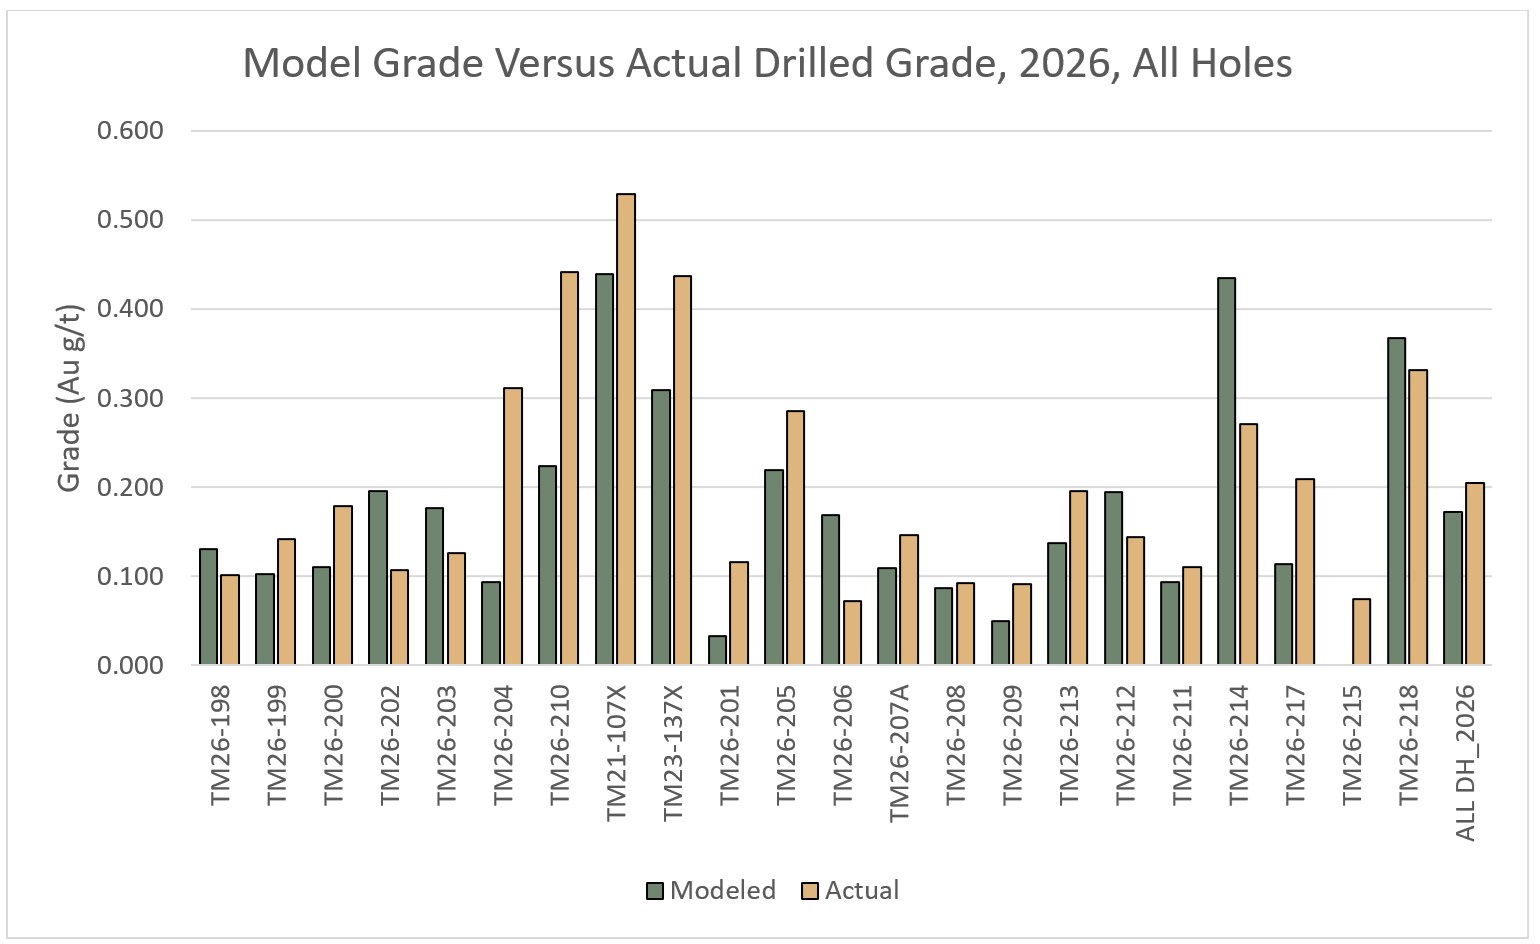
Similar results are observed for the project to date drilling which includes the exploration holes completed at the UV Target and the holes drilled along the eastern margin of the 2026 MRE optimized pit limit, targeting the large un-estimated portion of the model (Reference Figure 4.0). This data set also suggests that drilled grades are returning higher values than what is currently predicted by the 2026 MRE.
Both analyses exclude mineralization intersected outside the 2026 MRE model limit, specifically, the high-grade results intersected in holes TM26-210 and TM23-137X that extend beyond the base of the 2026 MRE model.
Figure 3.0 - Model Estimated Versus Actual Drilled Grade - Resource Conversion Drilling
To view an enhanced version of this graphic, please visit:
https://images.newsfilecorp.com/files/5364/317104_00f6f22b04192a4e_001full.jpg
Figure 4.0 - Model Estimated Versus Actual Drilled Grade - All Drill Holes 2026
To view an enhanced version of this graphic, please visit:
https://images.newsfilecorp.com/files/5364/317104_00f6f22b04192a4e_002full.jpg
Quality Assurance and Quality Control
Diamond drilling utilizes NQ diameter tooling. The core is received at the on-site logging facility where it is photographed, logged for geotechnical, physical properties and geological data. Samples are identified, recorded, and cut in half by wet diamond saw. Half the core is sent for assay at an accredited laboratory with the remaining half core stored on site. A standard sample length of 1.5 meters is typically employed, varying only at major lithological contacts.
Certified standards and blanks are randomly inserted into the sample stream and constitute approximately 10% of the sample stream. Certified standards and blank performance is monitored with any failures evaluated and investigated to determine if said failure is a result of error during submission. Any unexplained failures are identified and the five samples preceding and following the failure are re-assayed. Commencing in 2026, duplicate pulps are prepared at a rate of 1 in every 20 samples. The duplicate pulps are sent to a second independent analytical facility for analyses.
Activation Laboratories Ltd., Thunder Bay, Ontario, ISO/IEC 17025:2017 is the primary independent analytical service provider.
AGAT Laboratories, Thunder Bay, Ontario, ISO/IEC 17025:2017 is the secondary, independent analytical facility.
Samples are received, dried, crushed to 80% passing 2.0 mm. A 250-gram sample is split and pulverized. Samples are analyzed for gold using a 30-gram lead collection fire assay fusion (FA) with an atomic absorption (AAS) finish. All assay results greater than 5.0 g/t Au are re-assayed using a gravimetric analysis. All assays greater than 30.0 g/t Au are re-assayed using screen metallics where a representative 1000-gram sample is split sieved at 149µm. Assays are performed on the entire +149 µm fraction and two splits of the -149 µm fraction. A final assay is calculated based on the weight of each size fraction.
Qualified Person
Technical information in this news release has been reviewed and approved by Wes Hanson, P.Geo., President and CEO of Thunder Gold Corp., who is a Qualified Person under the definitions established by NI 43-101.
About the Tower Mountain Gold Property
The 7,625-hectare, 100%-owned Tower Mountain Property is beside the Trans-Canada highway, 40-km west of Thunder Bay, Ontario (pop. 120,000). Gold mineralization occurs in variably brecciated and altered rocks surrounding the calc-alkalic Tower Mountain Intrusive Complex ("TMIC"). Drilling to date has established an initial mineral resource parallel to the western contact of the intrusion representing approximately 25% of the TMIC halo.
The MRE has an effective date of January 19, 2026. A Technical Report titled "NI 43-101 Technical Report for the 2026 Mineral Resource Estimate on the Tower Mountain Project, Ontario, Canada." is available on the Company's website at www.thundergoldcorp.com and on SEDAR+ (www.sedarplus.ca) under the Company's Issuer profile.
The Report was prepared by Charley Murahwi, P.Geo., FAusIMM.; William Lewis, P.Geo., Tudorel Ciuculescu, P.Geo., and Richard Gowans, P.Eng., all of Micon International Limited ("Micon"), Toronto, Ontario, Canada. The Report was prepared in accordance with National Instrument 43-101 Standards of Disclosure for Mineral Projects ("NI 43-101") and CIM Definition Standards of Mineral Resources and Mineral Reserves.
The MRE is summarized as follows:
Tower Mountain Mineral Resource Estimate - January 19, 2026
| Category | Tonnage (Mt) | Grade (g/t Au) | Contained Metal ('000 oz gold) |
| Indicated | 34.5 | 0.46 | 514 |
| Inferred | 211.1 | 0.45 | 3,053 |
Notes:
- The effective date of this MRE is January 19, 2026.
- Messrs. William Lewis, P.Geo., Charley Murahwi, P.Geo., FAusIMM, and Tudorel Ciuculescu, P.Geo. from Micon International Limited are the Qualified Persons (QPs) responsible for this MRE.
- The MRE has been classified in the Indicated and Inferred categories. At this time, there are no Measured resources at the Tower Mountain Project.
- The calculated gold cut-off grade is 0.19 g/t Au.
- An average specific gravity (SG) value of 2.77 g/cm3 was used.
- The MRE used economic assumptions for open pit mining. The following economic parameters were used for generating the cut-off grade: a gold price of US$3,000/oz, 80% recovery, open pit mining cost of US$3.0/t, processing costs of US$8.0/t, general and administration cost of US$3.5/t, transportation cost of US$2.5/oz of gold, and a royalty of 3%.
- The open pit used slope angles of 30° in overburden and 50° in fresh rock.
- The block model is orthogonal and has a parent block size of 5 m x 5 m x 5 m, with minimum sub-block size of 2.5 m x 2.5 m x 2.5 m.
- The open pit optimization used a re-blocked size of 10 m x 10 m x 10 m.
- The mineral resources described above have been prepared in accordance with the current Canadian Institute of Mining, Metallurgy and Petroleum Standards and Practices.
- Numbers have been rounded to the nearest million tonnes and nearest thousand ounces. Differences may occur in totals due to rounding.
- Mineral Resources are not Mineral Reserves as they do not have demonstrated economic viability. The quantity and grade of reported Inferred Mineral Resources are uncertain in nature and there has been insufficient exploration; however, it is reasonably expected that a significant portion of Inferred Mineral Resources could be upgraded into Indicated Mineral Resources with further exploration.
- Micon QPs have not identified any legal, political, environmental, or other relevant factors that could materially affect the potential development of the mineral resources and of the estimate.
The remaining 75% of the TMIC halo demonstrates similar geology, alteration, and geophysical signatures and is untested by drilling.
A second gold trend, identified in 2026, outcrops at surface and is continuously mineralized over a 100-metre width. This gold mineralization occurs within Timiskaming-type conglomerates that have been traced for over 5.0 kilometres along a southwest trend paralleling the Thunder Lake Fault. The Company believes both targets offer opportunities to materially increase the total resource through systematic drilling.
About Thunder Gold Corp.
Thunder Gold is advancing the Tower Mountain project in Thunder Bay, Ont. -- an emerging gold system with the scale, consistency and quality to support a long-life, open-pit operation. Results from the disciplined drill programs have consistently reinforced confidence in the continuity and predictability of the discovery while highlighting significant potential for expansion across multiple zones of the Tower Mountain intrusive complex. With industry-leading drilling costs, existing infrastructure and a skilled local work force, Tower Mountain represents a rare combination of size, scalability and cost-effective growth.
At Thunder Gold, our vision is clear: to unlock a discovery that has the potential to become a transformational gold project, delivering long-term value for shareholders while contributing to the future of Canada's mining industry.
For more information about the Company please visit: www.thundergoldcorp.com.
On behalf of the Board of Directors,
Wes Hanson, P.Geo., President and CEO
For further information contact:
Wes Hanson, CEO
(647) 202-7686
whanson@thundergoldcorp.com
Bryan Baritot, Investor Relations
IR@thundergoldcorp.com
NEITHER THE TSXV NOR ITS REGULATION SERVICES PROVIDER (AS THAT TERM IS DEFINED IN THE POLICIES OF THE TSXV) ACCEPTS RESPONSIBILITY FOR THE ADEQUACY OR ACCURACY OF THIS RELEASE.
The information contained herein contains "forward-looking information" and "forward-looking statements" within the meaning of applicable securities legislation (collectively, "forward-looking statements"). Forward-looking statements relate to information that is based on assumptions of management, forecasts of future results, and estimates of amounts not yet determinable. All statements, other than statements of historical fact, are forward-looking statements and are based on predictions, expectations, beliefs, plans, projections, objectives and assumptions made as of the date of this news release, including the Company's plans regarding exploring its mineral exploration properties; anticipated results of geophysical surveys, drilling programs, geological interpretations and potential mineral recovery. Any statement that involves discussions with respect to predictions, expectations, beliefs, plans, projections, objectives, assumptions, future events or performance (often but not always using phrases such as "expects", or "does not expect", "is expected", "anticipates" or "does not anticipate", "plans", "budget", "scheduled", "forecasts", "estimates", "believes" or "intends" or variations of such words and phrases or stating that certain actions, events or results "may" or "could", "would", "might" or "will" be taken to occur or be achieved) are not statements of historical fact and may be forward-looking statements.
Forward-looking statements are subject to a variety of risks and uncertainties which could cause actual events or results to differ from those reflected in the forward-looking statements, including, without limitation: risks related to failure to obtain adequate funding on a timely basis and on acceptable terms; risks related to the outcome of legal proceedings; political and regulatory risks associated with mining and exploration; risks related to the maintenance of stock exchange listings; risks related to environmental regulation and liability; the potential for delays in exploration or development activities or the completion of feasibility studies; the uncertainty of profitability; risks and uncertainties relating to the interpretation of drill results, the geology, grade and continuity of mineral deposits; risks related to the inherent uncertainty of production and cost estimates and the potential for unexpected costs and expenses; results of prefeasibility and feasibility studies, and the possibility that future exploration, development or mining results will not be consistent with the Company's expectations; risks related to the gold price and other commodity price fluctuations; and other risks and uncertainties related to the Company's prospects, properties and business detailed elsewhere in the Company's disclosure record. Should one or more of these risks and uncertainties materialize, or should underlying assumptions prove incorrect, actual results may vary materially from those described in forward-looking statements. Investors are cautioned against attributing undue certainty or reliance on forward-looking statements. These forward-looking statements are made as of the date hereof and the Company does not assume any obligation to update or revise any forward-looking statements, other than as required by applicable law, to reflect new information, events or circumstances, or changes in management's estimates, projections or opinions. Actual events or results could differ materially from those anticipated in the forward-looking statements or from the Company's expectations or projections.

To view the source version of this press release, please visit https://www.newsfilecorp.com/release/317104
Source: Thunder Gold Corp.