(All dollar amounts are in United States dollars, unless otherwise stated)
Toronto, Ontario--(Newsfile Corp. - April 4, 2024) - Omai Gold Mines Corp. (TSXV: OMG) (OTCQB: OMGGF) ("Omai Gold" or the "Company") is pleased to announce positive results from its first Preliminary Economic Assessment ("PEA") for the Wenot Project, one of the two gold deposits located on its 100%-owned Omai Property, in Guyana. The PEA supports an initial open pit mining scenario for production averaging 142,000 ounces of gold per year over a 13-year mine life, with peak year production of 184,000 ounces. Total Wenot production is estimated at 1,840,000 ounces of payable gold. A spot gold price sensitivity of $2,200/oz supports an after-tax Net Present Value5% ("NPV") of $777 million, a 24.7% Internal Rate of Return ("IRR"), and a payback period of 3.5 years.
Elaine Ellingham, President and CEO comments: "We are extremely pleased with this first economic assessment for the new Omai that incorporates only our Wenot open pit deposit at this time. This PEA is an important step forward as it converts our successful exploration programs into a baseline production scenario that shows potential for robust economic development for Omai to once again become a large-scale gold producer, supported by the many benefits of a brownfields project including good road access, a nearby skilled workforce and the strong support of government for re-development."
"Although we have not included the adjacent Gilt Creek Deposit in this PEA economics, we are confident that it will contribute to an overall future mine plan. Since Gilt Creek would be an underground mine, it would have required significant additional engineering, time and cost, and our priority was to establish a baseline valuation for our shareholders. We have fast-tracked the advancement of this project over the past two years and are pleased to deliver these tangible results."
PEA Highlights for Wenot Open Pit
- After-tax NPV5% of $556 million and after-tax IRR of 19.8% based on $1,950/oz gold with a sensitivity case at $2,200/oz gold giving an after-tax NPV5% of $777 million and IRR of 24.7%
- Initial capital ("Capex") of $375 million and sustaining capital of $172 million over life-of-mine
- Projected average gold production of 142,000 oz per year over a 13-year mine life
- After-tax payback of 4.3 years at base case $1,950/oz gold (3.5 years at $2,200/oz gold)
- Average cash operating costs of $916/oz gold and all-in sustaining costs of $1,009/oz
- Cumulative cash flow of $1.07 billion after-tax over 13 years on base case assumptions
- Total payable gold production of 1.84 million ounces
- Average head grade of 1.51 g/t Au and 92.5% process recovery
- Average strip ratio for the open pit life-of-mine estimated at 7.8:1
Click here to view a 3D model of the Wenot Open Pit Deposit
Omai's CEO continued, "We are pleased with the PEA results as it establishes the potential for a single "superpit" for the Wenot deposit. We further believe that Omai holds exceptional potential to both expand the mine plan and to boost the economics: 1) At Wenot, there are gold zones identified along strike and at depth that can be expected to expand Mineral Resources within and outside the designed PEA pit; 2) By completing engineering studies and incorporating the adjacent Gilt Creek Deposit, the Omai mine plan could potentially expand to a 20+ year mine life; and 3) By advancing work on two high-grade near-surface zones, there is potential for higher grade process plant feed for the first few years that would boost economics considerably. The PEA sets the stage for Omai to advance engineering and permitting initiatives towards a Preliminary Feasibility Study ("PFS"). With these goals in mind, we are anxious to continue our work advancing the Omai Project in 2024."
Financial and operating metrics from the PEA are presented in Table 1 below.
Note: The PEA is preliminary in nature and includes Inferred Mineral Resources that are considered too speculative geologically to have the economic considerations applied to them that would enable them to be categorized as Mineral Reserves, and there is no certainty that the PEA will be realized. Mineral Resources that are not Mineral Reserves do not have demonstrated economic viability.
Table 1. Financial and Operating Metrics from the Preliminary Economic Assessment
| 2024 Wenot Preliminary Economic Assessment (PEA) Highlights | |
| Production | |
| Mine life (years) | 13.0 |
| Total gold production (ounces) | 1,840,000 |
| Average annual gold production (ounces) | 142,000 |
| Total mineralization mined (tonnes) | 41,101,000 |
| Total waste mined (tonnes) | 322,291,000 |
| Total material mined (tonnes) | 363,392,000 |
| Total waste-to-mineralization ratio | 7.8:1 |
| Average gold grade (grams per tonne) | 1.51 |
| Gold Process Recovery (%) | 92.5% |
| Average Process Plant throughput (tpd) | 9,000 |
| Operating Costs | |
| Mining cost per tonne (Total Material) | $1.63 |
| Mining cost per tonne (Mineralization) | $14.44 |
| Processing Cost per tonne | $15.58 |
| G&A cost per tonne | $3.16 |
| Total cost per tonne processed 1,3 | $33.19 |
| Total cash cost (per ounce sold)1,3 | $916 |
| Mine-site all-in-sustaining cost (per ounce sold)2,3 | $1009 |
1 Total cash costs include mining, processing, surface infrastructures, transport, G&A and royalty costs.
2 All-in sustaining cost ("AISC") includes total cash costs, sustaining capital expenses to support the on-going operations, and closure/reclamation.
3 Non-IFRS financial performance measures with no standardized definition under IFRS. Refer to the note at the end of this press release.
| Capital Costs | |
| Initial capital expenditure (Initial Capex)3 | $375.2 M |
| Sustaining capital expenditures3 | $171.5 M |
| Net reclamation costs (cost less salvage value) | $0 |
| Total capital expenditure - life of mine | $546.8 M |
| Total capital expenditure (per ounce sold) - life of mine | $297/oz |
| Base Case Economic Analysis: $1,950 per ounce Gold Price | |
| IRR (after-tax) | 19.8% |
| NPV @ 0% discount rate (millions, after-tax) | $1,067.7 |
| NPV @ 5% discount rate (millions, after-tax) | $556.4 |
| Payback (years) | 4.3 |
| Economic Analysis Sensitivity at $2,200 per ounce Gold Price | |
| IRR (after-tax) | 24.7% |
| NPV @ 0% discount rate (millions, after-tax) | $1,402.5 |
| NPV @ 5% discount rate (millions, after-tax) | $776.6 |
| Payback (years) | 3.5 |
Financial Analysis and Sensitivities
The Project generates cumulative after-tax free cash flow of $1,067 million and average annual free cash flow of $112.5 million over the 13-year producing mine life.
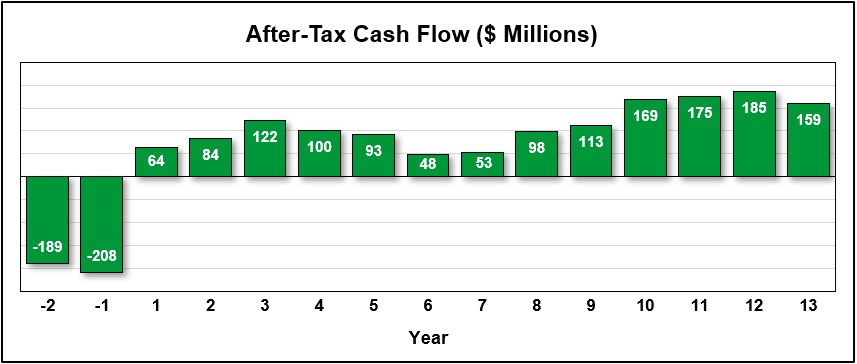
Figure 1. After-tax Cash Flow over Life-of-Mine
To view an enhanced version of this graphic, please visit:
https://images.newsfilecorp.com/files/8712/204278_ee82559cb432ea82_001full.jpg
The PEA financial analysis is significantly influenced by gold price, operating costs and capital costs as shown in Table 2. For example, at the base case gold price of US$1,950/oz, the Wenot Project generates after-tax NPV of $556.4 million using a 5% discount rate with an after-tax IRR of 19.8%. However, a 10% sensitivity increase to the base case gold price to $2,145/oz, results in an after-tax NPV of $728.2 million and an after-tax IRR of 23.7% with a payback period of 3.6 years from the commencement of production.
Table 2. PEA Sensitivities to Gold Price, Operating Costs (Opex) and Capital Costs (Capex)
Gold Price Sensitivities
| Range | GOLD PRICE | After Tax NPV (5%) ($M) | IRR | Payback (Yrs) |
| -20% | $1,560 | 210.1 | 11.1% | 8.4 |
| -10% | $1,755 | 384.1 | 15.7% | 5.8 |
| 0 | $1,950 | 556.4 | 19.8% | 4.3 |
| 10% | $2,145 | 728.2 | 23.7% | 3.6 |
| 20% | $2,340 | 899.8 | 27.3% | 3.2 |
Opex Sensitivities
| Range | OPEX | After Tax NPV (5%) ($M) | IRR | Payback (Yrs) |
| -20.0% | $807 | 706.3 | 23.6% | 3.7 |
| -10.0% | $908 | 631.5 | 21.7% | 3.9 |
| 0.0% | $1,009 | 556.4 | 19.8% | 4.3 |
| 10.0% | $1,110 | 481.1 | 17.9% | 4.7 |
| 20.0% | $1,211 | 406.0 | 15.9% | 5.8 |
Capex Sensitivities
| Range | CAPEX | After Tax NPV (5%) ($M) | IRR | Payback (Yrs) |
| -20.0% | $300 | 638.8 | 24.7% | 3.5 |
| -10.0% | $338 | 597.7 | 22.1% | 3.9 |
| 0.0% | $375 | 556.4 | 19.8% | 4.3 |
| 10.0% | $413 | 514.9 | 17.9% | 4.7 |
| 20.0% | $450 | 473.5 | 16.2% | 5.4 |
Gold Production
Annual production over the life-of-mine from the Wenot pit is expected to average 142,000 ounces of gold with a peak year production of 184,000 ounces, for total payable gold production of 1,840,000 ounces.

Figure 2. Wenot Production Profile
To view an enhanced version of this graphic, please visit:
https://images.newsfilecorp.com/files/8712/204278_omai2en.jpg
Capital Costs
The initial capital costs are estimated at $375.2 million, with life-of-mine sustaining costs estimated at $172 million. Contingencies of $54 million and $18 million are included in initial and sustaining capital costs, respectively. These estimates were based on current costs and quotes received from potential local vendors with other estimates based on references and experience from similar operations.
The main components of the $375.2 million initial capital costs include: $100 million for the processing plant equipment and buildings plus $75 million indirect costs to construct the process plant, $46 million for mining equipment and surface preparation, $45 million for surface civil and infrastructure, $33 million for capitalized pre-stripping, $20 million for owner's costs, and $54 million contingency.
The main components of the $172 million sustaining capital include: $139 million for mining equipment, $9 million for tailings and water treatment, $6 million for process plant equipment, and $18 million contingency.
Cash Costs
Total cash cost including royalties is estimated at $41.00 per tonne processed or $916/oz of payable gold. The all-in-sustaining cost is estimated at $1,009/oz of payable gold. Operating cost estimates were developed using vendor quotes and knowledge of similar operations with productivities being derived from benchmarking and industry practices.
Table 3. Total Cash Costs
| Mining Cost (per tonne processed) | $14.44 |
| Processing Cost (per tonne processed) | $15.58 |
| G&A Cost (per tonne processed) | $3.16 |
| Total Cost (per tonne of processed) 1 | $33.19 |
| Royalties (per tonne processed) | $7.81 |
| Total Cash Cost (per ounce sold)1,3 | $916 |
Mineral Resource Estimate
The PEA is based only on the Wenot Open Pit Deposit and excludes the adjacent Gilt Creek Deposit. Management believes that the Gilt Creek Deposit, which would require underground mining, is sufficiently attractive to be integrated into a larger mine plan, however, to accelerate and simplify this current PEA, it was excluded.
On February 8, 2024, the Company announced an updated Mineral Resource Estimate ("MRE") for the Omai Property in Guyana (Wenot and Gilt Creek Deposits). It details a total Indicated MRE of 1.985 million ounces of gold averaging 2.15 g/t Au and an Inferred MRE of 2.279 million ounces averaging 2.26 g/t Au.
The PEA is based on the Wenot Deposit, with an Indicated MRE of 834,000 ounces averaging 1.48 g/t Au and an Inferred MRE of 1,614,000 ounces averaging 1.99 g/t Au. The pit design used in the PEA does not include 58,600 oz of Indicated Mineral Resources and 456,900 oz of Inferred Mineral Resources, which represents approximately 21% of the total Wenot MRE ounces (Figure 5). These excluded MRE ounces are either hosted within multiple, narrow veins or are isolated zones at depth that result in a high strip ratio. However, it is expected that at least a portion of this currently excluded Mineral Resource could be incorporated in future economic scenarios upon further drilling.

Figure 3. 3-D Model of Wenot and Gilt Creek Deposits, Omai Gold Property, Guyana
To view an enhanced version of this graphic, please visit:
https://images.newsfilecorp.com/files/8712/204278_ee82559cb432ea82_003full.jpg
The Mineral Resource Estimates for Omai are presented in Table 4. Notes accompanying the 2024 MRE are shown below the table, summarizing the economic and technical assumptions.
Table 4. 2024 (January) Mineral Resource Estimates
| Indicated Resources | Inferred Resources | |||||||
| Resource Area | Mining Method | Tonnes (k) | Au (g/t) | Au (koz) | Tonnes (k) | Au (g/t) | Au (koz) | |
| GILT CREEK (1.5 g/t Cut-Off) | Underground | 11,123 | 3.22 | 1,151 | 6,186 | 3.35 | 665 | |
| WENOT (0.35 g/t Cut-Off) | Open Pit | 17,572 | 1.48 | 834 | 25,183 | 1.99 | 1,614 | |
| Total Mineral Resource Estimate | 28,695 | 2.15 | 1,985 | 31,369 | 2.26 | 2,279 | ||
| Wenot Mineral Resource Estimate by Deposit Type | ||||||||
| WENOT | Saprolite & Alluvium | Open Pit | 2,048 | 1.07 | 70 | 153 | 1.13 | 5 |
| Fresh Rock & Transition | Open Pit | 15,524 | 1.53 | 764 | 25,030 | 2.00 | 1,609 | |
Notes to Accompany the 2024 Mineral Resource Estimate:
1. Mineral Resources that are not Mineral Reserves do not have demonstrated economic viability.
2. The estimate of Mineral Resources may be materially affected by environmental, permitting, legal, title, taxation, socio-political, marketing, or other relevant issues.
3. The Inferred Mineral Resource in this estimate has a lower level of confidence than that applied to an Indicated Mineral Resource and must not be converted to a Mineral Reserve. It is reasonably expected that the majority of the Inferred Mineral Resource could potentially be upgraded to an Indicated Mineral Resource with continued exploration.
4. The Mineral Resources were estimated in accordance with the Canadian Institute of Mining, Metallurgy and Petroleum (CIM), CIM Standards on Mineral Resources and Reserves, Definitions (2014) and Best Practices Guidelines (2019) prepared by the CIM Standing Committee on Reserve Definitions and adopted by the CIM Council.
5. Wenot wireframe constrained gold assays were composited to 1.5 metre lengths and subsequently capped between 10 to 25 g/t. Gilt Creek Wireframe constrained gold assays were composited to 1.0 metre lengths and subsequently capped between 12 to 40 g/t.
6. The Wenot Mineral Resource Estimate incorporates 9,840 assay results from 603 diamond drill holes totalling 87,323 m within the mineralized wireframes.
The Gilt Creek Mineral Resource Estimate incorporates 7,056 assay results from 46 diamond drill holes totalling 27,997 m within the mineralized wireframes
7. Grade estimation was undertaken with ID3interpolation.
8. Wenot wireframe constrained bulk density was determined from 30 site visit samples.
Gilt wireframe constrained bulk density was determined from 28 site visit samples.
9. Wenot gold process recoveries used were 92% for Alluvium/Saprolite and 92% for Transition/Fresh Rock.
Gilt Creek gold process recovery used was 92%
10. The gold price used was US$1,850/oz
11. Wenot US$ open pit operating costs used were $2.50/t for mineralized material mining, $1.75/t for waste mining, $10/t for Alluvium/Saprolite processing, $14/t for Transition/Fresh Rock processing and $2.50/t G&A. Gilt Creek US$ underground operating costs used were $60/t for mining, $15/t for processing and $7/t G&A.
12. At Gilt Creek, MRE blocks were reviewed for grade and geometric continuity. Isolated/orphaned and single block width strings of blocks were removed in order to only report Mineral Resources with a reasonable prospect of economic extraction.
13. Wenot pit slopes were 45o.
Mining
The Project area consists of subdued topography. The area, topography, and climate are amenable to the conventional open pit mining operations proposed for the Project, similar to historical operations. No underground mining is planned at this stage although the potential for development of underground mining of the Gilt Creek Deposit will be evaluated in the future.
The Wenot mining operations will encompass a single large open pit with 55o hard rock inter ramp slopes and 30o saprolite slopes that will be mined with conventional mining equipment in two pushback phases. In order to improve mining selectivity and reduce dilution, two different bench heights and sets of mining equipment will be used. Mineralization will be mined using a 5 m high bench height with 150 mm diameter blast hole drills, and a fleet consisting of 5 m3 bucket excavators and 35 t rigid body haul trucks. Waste rock and saprolite will be mined on 10 m high benches using 200 mm diameter blast hole drills, 22 m3 bucket hydraulic excavators, and 177 t haul trucks. Major pieces of mining equipment will be purchased via a lease financing agreement. Various support equipment will be required, such as dozers, graders, water trucks, and light vehicles for maintenance, personnel transport and mine supervision. The surficial saprolite cover, which is anticipated to be free digging and will not require blasting, is up to 60m thick forming the upper part of the 440 m deep open pit.
The open pit mine will have a mineralization production rate that averages 9,000 tpd over a 13-year mine life. A total of 322.3 Mt of waste rock is planned to be mined, with 2.6 Mt of mineralization in saprolite and 38.5 Mt of mineralization in fresh rock, for a total strip ratio of 7.8:1, at an average grade of 1.51 g/t Au containing 1.99 Moz Au. Total material mined will peak at 110,000 tpd.
Mineralization may be delivered either to the primary crusher or placed into a nearby stockpile. Waste rock is either taken to a waste storage facility or used in tailings dam embankment construction.

Figure 4. Wenot Open Pit Design (Two Phases)
To view an enhanced version of this graphic, please visit:
https://images.newsfilecorp.com/files/8712/204278_ee82559cb432ea82_004full.jpg
Metallurgy & Processing
An average of 9,000 tpd of gold mineralized material will be treated in the Omai process plant. The process plant will consist of a semi-autogenous grinding mill in closed circuit with a pebble crusher and ball mill in a closed circuit with cyclones (SABC circuit). Primary crushing will consist of a gyratory crusher for hard run-of-mine ("ROM") feed. A gravity circuit, which precedes leaching will recover coarse gold from the cyclone underflow, while the cyclone overflow is thickened and treated in a multi-tank carbon-in-leach ("CIL") or carbon-in-pulp ("CIP") circuit. Gold will be stripped from the loaded carbon, concentrated by electrowinning and recovered as gold bars in a gold room.
The Omai Gold process plant will be designed to be a compact facility with attached grinding media and reagent reception. The process plant facilities will include a laboratory, a mill maintenance workshop, and safety, personal services and management offices.
Metallurgical Data
The anticipated metallurgical performance for processing the Omai Mineral Resources has a dual base of verification: (i) A comprehensive test program by Lakefield Research (now SGS Canada) that was completed in 1990 on drill core representing seven mineralized zones, and (ii) The processing of 80 million tonnes of mineralized material over 12 years by Omai Gold Mines Limited (OGML) from the Fennel and Wenot pits as well as alluvial zones.
During operations from 1993 to 2005, the hard rock ROM feed was crushed in a gyratory crusher and ground by a combination of SAG and ball mills (a SABC designation). Soft mineralized material was blended by a backhoe into the crushed hard rock feed. A combination of gravity-based methods including spiral, Nelson centrifuge and tabling was employed to recover free gold. Gold leaching was conventional with a mild concentration of process reagents, air-sparged leaching followed by CIP gold recovery, stripping from the carbon, electrowinning and electric furnace refining. The historical gold recovery ranged from 92% to 94%.
Metallurgical testing at Lakefield included grinding tests indicating that the Bond Work Index was very high for the hard-rock composites at 19 to 25 KWh/t. As anticipated, the Work Index was very low (~6 KWh/t) for saprolite. Gravity concentration was examined for diorite and saprolite composites and a substantial proportion of gold (~30%) was recovered. A series of standard, 48-hour leach tests were performed on each composite, with the effect of pre-grinding of the samples to up to 90% passing -200 mesh. The results indicated a high gold extraction, from 92% to 97% on the hard rock samples, with only a small effect due to grind size.
Carbon-in-pulp (CIP) testing, representing the recovery of the extracted gold liberated as a process reagent-complex in leaching, was also tested. The recovery of gold to carbon was high for all composites. Flocculation and thickening tests indicated that reasonable performance could be anticipated in pre-leach thickening which is a key parameter when processing soft, saprolitic feeds.
While the processing history can be used as a new Omai process design basis, test-based options for process upgrading will be considered for crushing-grinding, gravity concentration, gold leaching and recovery (CIL vs. CIP). Since crushing-grinding is the most energy intensive stage, lower energy intensity options including a second stage crushing and high pressure grinding rolls (HPGR's) will be considered to address both cost and sustainability factors.
Access & Infrastructure
The Omai Project is located approximately 165 km south of Guyana's capital city of Georgetown and is accessible via a major road that connects Georgetown to Brazil, roughly 350 km south of the Project. This road is paved for the first 90 km to the town of Linden (population ~45,000). Linden is the second largest city in Guyana and was established for bauxite mining. When Omai was in production roughly 90% of the workforce lived in Linden, and it is expected to again be a source from much of the Omai workforce. The road from Linden is currently being widened and paved. It is expected that by year end 2024, there will be a paved road from Georgetown, via Linden, to within 8 km of the Omai Project. The Omai Mine road extends to the east bank of the Essequibo River where a public ferry takes passengers and vehicles across the river on a regular basis.
The Omai site is mostly cleared of forest and has an extensive network of dirt roads providing access to most areas of the Property. The site includes a number of large warehouses remaining from the mining days. The Omai camp consists of two large warehouses that have been repurposed as offices, accommodations, drill core logging facilities and drill core storage, and workshop. Two bunkies provide additional housing, with the camp currently having accommodations for 60 workers.
The mining and processing infrastructure will be located at the Omai site. The Project will require construction of the following infrastructure: 9,000 tpd process plant, offices, truck shop and warehouse, new camp accommodation, surface water management facility, service and haulage roads and initial tailings management facility. An existing airstrip will be used for emergencies and time sensitive transport.
Tailings and Water Management
The tailings storage plan will take advantage of existing facilities and features on the Omai Property, including the existing 350-acre tailings facility and the dewatered Fennel mined-out open pit. Tailings decant will be recycled to the process plant with the excess water treated for discharge. Based on historical (OGML) evidence, the natural degradation of residual process reagents will facilitate the meeting of strict discharge criteria, and only treatment for suspended solids removal will be required.
Workforce
During the construction of the mine, the workforce is estimated to consist of approximately 250 people for an 18-month period, this is in addition to employees who would be required for open pit pre-stripping operations in the 12 months leading up to the production phase of the mine life. During production from the Wenot open pit, the average number of employees at the mine and process plant is estimated at 439 people. The schedule will be two 12-hour shifts per day for 7 days a week.
Next Steps
The positive results of the PEA warrant advancing the Project to the next study stages. Work programs, recommended to advance the Project to Pre-Feasibility Study level, include:
- Infill drilling of gaps in projected gold zones that could potentially reduce waste rock and increase mineralized material within the Wenot designed pit, focusing on the southern side of the Deposit.
- Drilling to convert Inferred Mineral Resources to Indicated.
- Drilling near-surface areas to improve the process plant feed grade in the first two years of mine life.
- Conduct metallurgical studies including crushing-grinding, gravity, leaching and gold recovery tests on bulk samples. Process selection will depend on efficiency of gold recovery and minimizing electricity demand.
- Evaluate gold leaching and recovery variability by Mineral Resource type and identify process options that result in lower energy consumption.
- Detailed geochemical characterization of waste and mineralized rock.
- Detailed geotechnical investigation in the Wenot pit and at various infrastructure sites.
- Develop a water management plan
- Studies of tailings management facility development and/or refurbishment.
Qualified Persons
The PEA and Mineral Resource Estimate were completed in accordance with the Canadian Institute of Mining, Metallurgy and Petroleum ("CIM") Definition Standards incorporated by reference in National Instrument 43-101 - Standards of Disclosure for Mineral Projects ("NI 43-101") (2014) and CIM Estimation Best Practice Guidelines (2019).
The PEA and Mineral Resource Estimate, including verification of the data disclosed, was under the supervision of Eugene Puritch, P.Eng., FEC, CET, President of P&E Mining Consultants Inc., who is a Qualified Person (QP) and is independent of Omai Gold for the purposes of NI 43-101, and has reviewed and approved the technical contents of this new release. The NI 43-101 MRE and PEA Technical Report will be published on SEDAR (www.sedarplus.ca) within 45 days from the date of this news release.
Elaine Ellingham P.Geo. is a Qualified Person (QP) under NI 43-101 "Standards of Disclosure for Mineral Projects" and has reviewed the technical information contained in this news release. Ms. Ellingham is not considered to be independent for the purposes of NI 43-101.
About Omai Gold Mines Corp.
Omai Gold Mines Corp. holds a 100% interest in the Omai Prospecting License that includes the past producing Omai Gold Mine in Guyana, and a 100% interest in the adjoining Eastern Flats Mining Permits. The Company announced an updated NI 43-101 Mineral Resource Estimate ("MRE") February 8, 2024 that includes 2.0 million ounces of gold (Indicated) and 2.3 million ounces (Inferred)1. Once South America's largest producing gold mine, Omai produced over 3.7 million ounces of gold between 1993 and 2005. Mining ceased at a time when the average gold price was less than US$400 per ounce. As a brownfields project, Omai benefits from good road access and a wealth of historical data that provides knowledge of the geology and gold mineralization on the Property, as well as metallurgy, historical process recoveries and many other relevant mining parameters. The Company's first economic study, a Preliminary Economic Assessment ("PEA") is presented in this news release above.
For further information, please see our website www.omaigoldmines.com or contact:
Elaine Ellingham, P.Geo.
President & CEO
elaine@omaigoldmines.com
Phone: +1-416-473-5351
Neither the TSX Venture Exchange nor its Regulation Services Provider (as that term is defined in the policies of the TSX Venture Exchange) accepts responsibility for the adequacy or accuracy of this release.
Cautionary Note Regarding Forward-Looking Information
This press release contains forward-looking statements or information (collectively, "FLI") within the meaning of applicable Canadian securities legislation. FLI is based on expectations, estimates, projections, and interpretations as at the date of this press release.
All statements, other than statements of historical fact, included herein are FLI that involve various risks, assumptions, estimates and uncertainties. Generally, FLI can be identified by the use of statements that include words such as "seeks", "believes", "anticipates", "plans", "continues", "budget", "scheduled", "estimates", "expects", "forecasts", "intends", "projects", "predicts", "proposes", "potential", "targets" and variations of such words and phrases, or by statements that certain actions, events or results "may", "will", "could", "would", "should" or "might", "be taken", "occur" or "be achieved." FLI herein includes, but is not limited to, statements regarding the results of the Omai PEA, including the production, operating cost, capital cost and cash cost estimates, the projected valuation metrics and rates of return, and the cash flow projections, as well as the anticipated permitting requirements and Project design, including processing and tailings facilities, infrastructure developments, metal recoveries, mine life and production rates for the Project, the potential to further enhance the economics of the Project and optimize the design, potential timelines for obtaining the required permits and financing. Forward-looking information is not, and cannot be, a guarantee of future results or events.
FLI is designed to help you understand management's current views of its near- and longer-term prospects, and it may not be appropriate for other purposes. FLI by their nature are based on assumptions and involve known and unknown risks, uncertainties and other factors which may cause the actual results, performance, or achievements of the Company to be materially different from any future results, performance or achievements expressed or implied by such FLI. Although the FLI contained in this press release is based upon what management believes, or believed at the time, to be reasonable assumptions, the Company cannot assure shareholders and prospective purchasers of securities of the Company that actual results will be consistent with such FLI, as there may be other factors that cause results not to be as anticipated, estimated or intended, and neither the Company nor any other person assumes responsibility for the accuracy and completeness of any such FLI. Except as required by law, the Company does not undertake, and assumes no obligation, to update or revise any such FLI contained herein to reflect new events or circumstances, except as may be required by law. Unless otherwise noted, this press release has been prepared based on information available as of the date of this press release. Accordingly, you should not place undue reliance on the FLI or information contained herein.
Assumptions upon which FLI is based, without limitation, include the results of exploration activities, the Company's financial position and general economic conditions; the ability of exploration activities to accurately predict mineralization; the accuracy of geological modelling; the ability of the Company to complete further exploration activities; potential changes in project parameters or economic assessments; the legitimacy of title and property interests in the Project; the accuracy of key assumptions, parameters or methods used to estimate the MREs and in the PEA; the ability of the Company to obtain required approvals; geological, mining and exploration technical problems; failure of equipment or processes to operate as anticipated; the evolution of the global economic climate; metal prices; foreign exchange rates; environmental expectations; community and non-governmental actions; any impacts of COVID-19 on the Project; and, the Company's ability to secure required funding. Risks and uncertainties about Omai Gold's business are more fully discussed in the disclosure materials filed with the securities regulatory authorities in Canada, which are available at www.sedarplus.ca. Furthermore, should one or more of the risks, uncertainties or other factors materialize, or should underlying assumptions prove incorrect, actual results may vary materially from those described in FLI.
Non-IFRS Financial Measures
Omai Gold has included certain non-IFRS financial measures in this press release, such as initial capital expenditures, sustaining capital expenditures, total cash costs and all in sustaining costs, which are not measures recognized under IFRS and do not have a standardized meaning prescribed by IFRS. As a result, these measures may not be comparable to similar measures reported by other companies. Each of these measures used are intended to provide additional information to the user and should not be considered in isolation or as a substitute for measures prepared in accordance with IFRS. Non-IFRS financial measures used in this press release and common to the gold mining industry are defined below.
Total Cash Costs and Total Cash Costs per Ounce
Total cash costs are reflective of the cost of production. Total cash costs reported in the PEA include mining costs, processing, general and administrative costs of the mine, off-site costs, refining costs, transportation costs and royalties. Total cash costs per ounce is calculated as total cash costs divided by payable gold ounces.
All-In Sustaining Costs and All-In Sustaining Costs per Ounce
All-in sustaining costs and all-in sustaining costs per ounce are reflective of all of the expenditures that are required to produce an ounce of gold from operations. All-in sustaining costs reported in the PEA include total cash costs, sustaining capital, closure costs, but exclude corporate general and administrative costs. All-in sustaining costs per ounce is calculated as all-in sustaining costs divided by payable gold ounces.
A description of the significant cost components that make up the forward looking non-IFRS financial measures of total cash costs and all in sustaining costs per ounce of payable gold produced is shown in the table below.
Cautionary Note to United States Investors
Omai Gold prepares its disclosure in accordance with the requirements of securities laws in effect in Canada, which differ from the requirements of U.S. securities laws. Terms relating to mineral resources in this press release are defined in accordance with NI 43-101 under the guidelines set out in CIM Definition Standards on Mineral Resources and Mineral Reserves, adopted by the Canadian Institute of Mining, Metallurgy and Petroleum Council on May 19, 2014, as amended ("CIM Standards"). The U.S. Securities and Exchange Commission (the "SEC") has adopted amendments effective February 25, 2019 (the "SEC Modernization Rules") to its disclosure rules to modernize the mineral property disclosure requirements for issuers whose securities are registered with the SEC under the U.S. Securities Exchange Act of 1934. As a result of the adoption of the SEC Modernization Rules, the SEC will now recognize estimates of "Measured Mineral Resources", "Iindicated Mineral Resources" and "Inferred Mineral Resources", which are defined in substantially similar terms to the corresponding CIM Standards. In addition, the SEC has amended its definitions of "Proven Mineral Reserves" and "Probable Mineral Reserves" to be substantially similar to the corresponding CIM Standards.
U.S. investors are cautioned that while the foregoing terms are "substantially similar" to corresponding definitions under the CIM Standards, there are differences in the definitions under the SEC Modernization Rules and the CIM Standards. Accordingly, there is no assurance any Mineral Resources that Omai Gold may report as "Measured Mineral Resources", "Indicated Mineral Resources" and "Inferred Mineral Resources" under NI 43-101 would be the same had Omai Gold prepared the Mineral Resource Estimates under the standards adopted under the SEC Modernization Rules. In accordance with Canadian securities laws, estimates of "Inferred Mineral Resources" cannot form the basis of feasibility or other economic studies, except in limited circumstances were permitted under NI 43-101.

Figure 5. Wenot Deposit Showing Pit Design and Mineral Resources Outside Pit
To view an enhanced version of this graphic, please visit:
https://images.newsfilecorp.com/files/8712/204278_5.jpg
![]()
To view the source version of this press release, please visit https://www.newsfilecorp.com/release/204278
Source: Omai Gold Mines Corp.