Toronto, Ontario--(Newsfile Corp. - September 9, 2020) - Moneta Porcupine Mines Inc. (TSX: ME) (OTC Pink: MPUCF) (FSE: MOP) ("Moneta" or the "Company") is pleased to announce the excellent results from the Company's Preliminary Economic Assessment ("PEA") of the South West deposit at its 100% owned Golden Highway Project located in Timmins, Ontario. The PEA study demonstrates robust economics and is based on a stand-alone, owner-operated mine and mill with an 11-year mine life which produced an after-tax Net Present Value ("NPV") of C$236 million using a 5% discount rate. The financial model shows an after-tax Internal Rate of Return ("IRR") of 30% and a capital payback period of 3.4 years. All amounts are shown in Canadian dollars unless otherwise stated.
South West Deposit PEA Highlights
- After Tax Net Present Value at a 5% discount rate ("NPV5%") of C$236 million and after-tax Internal Rate of Return ("IRR") of 30% at US$1,500/oz gold and exchange rate of US$0.77/C$
- C$371 million after tax cash flow over the life of mine
- 75,700 ounces annual production during full production for 719,000 ounces total gold production
- Peak gold production of 85,700 ounces per annum
- Cash cost of US$590 per ounce and all in sustaining cost of US$747 per ounce gold
- Highly leveraged to the gold price with after tax NPV5% of C$423 million and 47% IRR at US$1,900 per ounce gold
- Initial capital of C$144 million, and sustaining capital of C$136 million
- After-tax discounted pay-back of 3.4 years, with an 11 year mine life
- Attractive alternative Toll Milling development option with after-tax NPV5% of C$197 million and IRR of 44% at US$1,500 gold with initial capital costs of C$65 million
- Potential to expand production from additional deposits located on the Golden Highway Project
"We are extremely pleased with the positive results from this preliminary economic assessment of the South West deposit and its robust project economics including an NPV of C$236 million and IRR of 30% at US$1,500 ounce gold and a 5% discount rate," commented Gary O'Connor, CEO. "The PEA study which assumed underground extraction of our South West deposit only has shown the potential to produce up to 85,700 ounces per annum for a total of 719,000 ounces life of mine at an attractive cash cost of US$590 per ounce, with low initial capital of C$144 million repaid over 3.4 years. The excellent economics are afforded by the project's location in Canada's most prolific gold mining camp, Timmins Ontario, with extensive existing infrastructure and experienced and available services and workforce. The South West deposit would generate C$371 million after tax cash flow over the life of mine. We will now be able to focus on expanding the adjacent deposits and discovering new zones of gold mineralization to continue to add value to the Golden Highway Project with a growing resource base. In addition to our base case development plan, we also have a highly attractive development option which involves minor initial capital expenditure, shorter development time line and negates the need to permit and build our own processing plant and associated infrastructure assuming Toll Milling of the ore."
Mr. O'Connor commented, "In addition to the highly successful PEA on our South West deposit, we have 5 additional gold deposits on the Golden Highway project and have discovered three new mineralized areas, Westaway, Halfway and South Basin in 2020, of which a maiden resource for Westaway is planned for this year. During 2020 we have doubled the footprint of continuous mineralization from 2 kilometres to 4 kilometres at Golden Highway. In addition, we have discovered regional scale potential with gold mineralization discovered over 1.2 km on the southern margins of the South Basin with a potential strike length of 12 km."
PEA: TECHNICAL INPUT AND FINANCIAL RESULTS SUMMARY
Table 1 - Technical Inputs and Financial Assumptions
| Economics | Pre-Tax | Post-Tax | |
| Net present value (NPV5%) | C$ million | $368.2 | $236.4 |
| Internal rate of return (IRR) | % | 39.2 % | 29.7 % |
| Payback Period (undiscounted) | years | 2.9 years | 3.4 years |
| LOM avg. annual cash flow | C$ million | $66.9 | $ 48.6 |
| LOM cumulative cash flow (undiscounted) | C$ million | $556.3 | $371.3 |
| LOM Average cash costs | US$ per ounce | US$590 | |
| LOM Average AISC - All in Sustaining Costs | US$ per ounce | US$747 | |
| LOM Average AIC - All in Costs | US$ per ounce | US$902 | |
| Initial Capital Costs | C$ Million | C$144.2 | |
| Sustaining Capital Costs (LOM) | C$ Million | C$135.7 | |
| Profitability Index | NPV/Initial Capital | 1.64 | |
| Peak Investment | C$ million | C$114.3 | |
| Gold price assumption | US$ per ounce | US$1,500 | |
| Exchange rate | US$/C$ | 0.77 | |
| Royalty | per ounce | nil | |
| Mine life | years | 11 | |
| Mill Head Grade (diluted) and Recovery | g/t Au, % | 3.93 g/t Au, 94.2% | |
| Average annual mining rate | tonnes/day (tpd) | 1,750tpd | |
| Average annual gold production | thousand ounces/yr | 76Koz/pa | |
| Total LOM recovered gold | thousand ounces | 719.2koz | |
The average annual mining rate and gold production is calculated for years 3 to 11 of mining when mining is at full production rates. All other parameters are measured for life of mine (LOM) and include the 2 year ramp up period. No royalties or encumbrances are attributed to any of the South West deposit.
The PEA was prepared in accordance with National Instrument 43-101 ("NI 43-101") by Micon International Limited ("Micon") of Toronto, Canada with an effective date of September 09, 2020. The Company will file the PEA on SEDAR at www.sedar.com in accordance with NI 43-101 within 45 days.
This preliminary economic assessment is preliminary in nature; it includes inferred mineral resources that are considered too speculative geologically to have the economic considerations applied to them that would enable them to be categorized as mineral reserves, and there is no certainty that the preliminary economic assessment will be realized.
GOLD PRICE SENSITIVITIES
The following table demonstrates the post-tax sensitivities of NPV and IRR to gold price per ounce. The base case, highlighted in the table below, assumes US$1,500 per ounce of gold and an exchange rate of 0.77 (US$/C$):
Table 2: Gold Price Sensitivities

To view an enhanced version of Table 2, please visit:
https://orders.newsfilecorp.com/files/4852/63412_table2.png
Figure 1: Sensitivities Chart
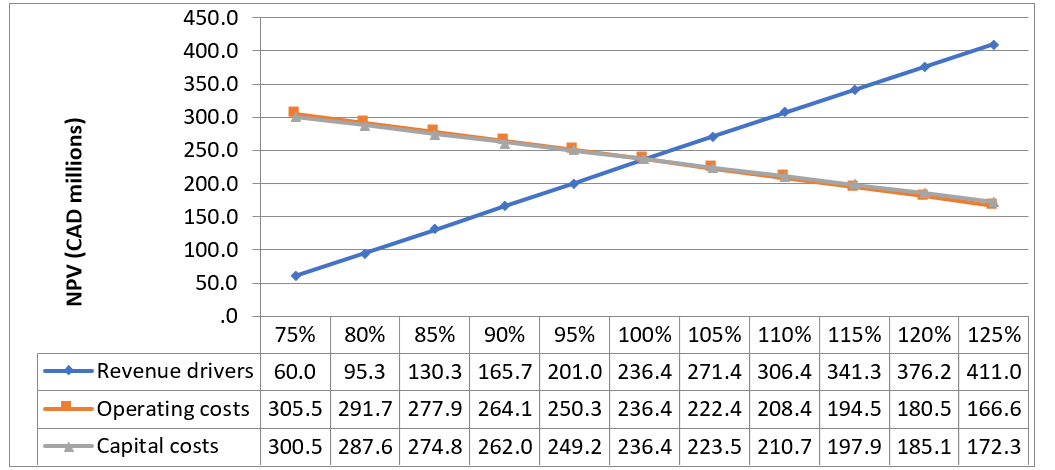
To view an enhanced version of Figure 1, please visit:
https://orders.newsfilecorp.com/files/4852/63412_fig1.png
The Project economics are most sensitive to revenue drivers (gold prices, gold grade and recovery). Operating and capital cost sensitivities are similar and are also presented in Figure 1.
OPPORTUNITIES
The PEA outlined several initiatives that may enhance the Project including:
- Potential to mine additional ounces from the current resource estimate from the developed underground infrastructure with more selective mining
- Opportunity to drill out additional gold mineralization from underground not currently in the mineral resource estimate
- Include lower grade gold mineralized haloes and veins systems not currently in the resource model which will lower the amount of dilution
- With modelling of lower grade veins and haloes, development through these areas could potentially be processed through the mill. Current mine plan assumes the development in these areas carries no grade
- Optimize the metallurgical recoveries with more test work to potentially increase the overall gold recoveries
- The possibility of increasing the tonnes mined per year with longer/additional mining shifts
- Additional mineral resources located adjacent to South West and currently the focus of ongoing exploration and resource updates by Moneta are not covered in this PEA. Additional resources and mine plans have the potential to significantly increase production from the project
- Optimization of the mine plan and mine production schedule to potentially decrease costs and increase production
NEXT STEPS
- The South West resource requires additional infill drilling to upgrade inferred resources to measured and indicated categories
- Continue and expand the current environmental base line studies and data collection
- Drill known open extensions of the resource to expand the potential size of the South West deposit
- Additional metallurgical recovery and environmental test work is required to better define the process flow sheet
- Drill out adjacent gold deposits to enable additional resources to be considered in any further development plans
- Drill test exploration targets to continue to grow the resource base
- Hydrological and geotechnical studies will be required
- Commence pre-feasibility level mine engineering and development studies upon completion of resource expansion and infill drill programs
MINE PRODUCTION SCHEDULE
The PEA at South West considers underground mining utilizing ramp access with longitudinal long hole stoping mining methods. The initial development of the access ramp is to be performed by contractors with mine development and ore production transitioning to 100% owner owned operations in year 2. Two years have been scheduled for the ramp-up of production with the full production rate of 1,750 tpd being achieved in year 3. Full production occurs for 9 years for a total of 11 years mine life with average production of 75,700 ounces per year during full production, peaking in year 5 with 85,700 ounces of gold produced.
A minimum mining width of 3.00 m is used for the longitudinal long hole stoping mining planned, with 20 m between sub-levels and 15 m long stopes planned. The average width of stopes is approximately 8.0 m. Dilution of 0.5 m on both the footwall and hanging wall of stopes is added with no grade.
Table 3: Mine Production Schedule
| Year | -1 | 1 | 2 | 3 | 4 | 5 | 6 | 7 | 8 | 9 | 10 | Totals |
| Tonnes (t) | 213 | 462 | 603 | 621 | 620 | 617 | 622 | 621 | 621 | 621 | 417 | 6,035 |
| Grade (g/t) | 3.93 | 4.05 | 3.91 | 3.90 | 4.57 | 3.73 | 3.56 | 3.95 | 4.19 | 3.70 | 3.77 | 3.93 |
| Contained Au | 26.8 | 60.1 | 75.9 | 77.8 | 91.0 | 73.9 | 71.2 | 78.8 | 83.6 | 73.7 | 50.4 | 763.5 |
| Recovery (%) | 94.2% | 94.2% | 94.2% | 94.2% | 94.2% | 94.2% | 94.2% | 94.2% | 94.2% | 94.2% | 94.2% | 94.2% |
| Recovered Au | 25.3 | 56.6 | 71.5 | 73.3 | 85.7 | 69.7 | 67.1 | 74.3 | 78.8 | 69.4 | 47.5 | 719.2 |
Figure 2: Annual Gold Production Chart

To view an enhanced version of Figure 2, please visit:
https://orders.newsfilecorp.com/files/4852/63412_fig2.png
Table 4: Mine Production Technical Details
| Mine Plan Summary | ||
| Mine Life | Years | 11 |
| Including Ramp-up | Years | 2 |
| Mining rate | tpd | 1,750 |
| Height between sub-levels | m | 20.00 |
| Minimum mining width | m | 3.00 |
| Length of stopes | m | 15.00 |
| Dilution | m | 0.5 / 0.5 |
| Average width of stopes | m | ~8.00 |
| Dilution grade | g/t Au | 0.00 |
| Cut-off grade | g/t Au | 2.60 |
| Total mill-feed mined | Million tonnes | 6.035 |
| Diluted Grade | g/t Au | 3.93 |
| Contained Ounces | Thousand ounces | 763.49 |
| Recovered ounces | Thousand ounces | 719.21 |
OPERATING COSTS
Owner operating costs were developed from first principles. Initial access development will be contracted and contractor rates were based on written quotes. Owner mining is assumed for all ore production and associated development. Ore is brought to the surface by means of a 4.0 m x 4.5 m access ramp utilizing 30 t trucks.
Table 5: Operating Cost Summary
| Operating Costs | ||
| Cost Centre | LOM (C$MM) | (C$/t) |
| Mining | $393.2 | $65.16 |
| Processing | $112.9 | $18.70 |
| G&A | $36.8 | $6.10 |
| Total | $542.9 | $89.96 |
Figure 3: Cash flow and Operating Cost Chart

To view an enhanced version of Figure 3, please visit:
https://orders.newsfilecorp.com/files/4852/63412_fig3b.png
CAPITAL COSTS
Initial capital costs include a 15% contingency on direct and indirect costs. The initial capital costs also include owner's costs, EPCM costs, first fills, insurance and indirect costs. Sustaining costs include a 10% contingency on underground development costs.
Trade-off studies were evaluated to include "lease-to-purchase" options for mining equipment. The lease to purchase equipment does result in lower initial capital and higher IRR's but returned lower NPV valuations and higher cash costs of production. The lease to purchase remains an attractive development option to reduce initial capital costs.
Table 6: Capital Cost Summary
| Capital Costs | |
| Cost Centre | C$MM |
| Mining Equipment | 6.05 |
| Auxiliary | 43.64 |
| Processing | 40.39 |
| Infrastructure | 21.50 |
| In-directs | 15.68 |
| Contingency | 16.91 |
| Total Initial Capital | 144.16 |
| Sustaining Capital (LOM) | 135.72 |
| Closure | 10.00 |
| Total Capital Costs | 289.88 |
SOUTH WEST MINERAL RESOURCE ESTIMATE UPDATE
The mineral resource estimate for South West was updated by Micon for the PEA. The same geological interpretation and geological wireframes were used as per the November 2019 mineral resource update. No additional drilling has been performed by Moneta at South West since the November 2019 resource. Due to the updated economic parameters used in the PEA, the cut-off grade for the South West resource was changed from 3.0 g/t Au to 2.6 g/t Au, assuming US$1,250 per ounce gold. The current PEA only assessed the economics of producing gold from the South West deposit and did not evaluate the adjacent deposits on the Golden Highway Project.
Table 7: Golden Highway Project Mineral Resource Estimate
| Deposit Name | Cut-off Used (Au g/t) | Indicated | Inferred | ||||
| Tonnes (t) | Grade (g/t) | Ounces (oz) | Tonnes (t) | Grade (g/t) | Ounces (oz) | ||
| South West | 2.6 | 4,530,000 | 4.07 | 592,400 | 9,607,000 | 4.01 | 1,237,900 |
| Windjammer South | 3.0 | 364,000 | 4.19 | 49,100 | 173,000 | 4.59 | 25,500 |
| 55 | 3.0 | 216,000 | 5.11 | 35,400 | 327,000 | 4.31 | 45,300 |
| West Block | 3.0 | - | - | - | 301,000 | 3.23 | 31,200 |
| Discovery | 3.0 | - | - | - | 108,000 | 4.12 | 14,300 |
| Windjammer North | 3.0 | - | - | - | 265,000 | 3.80 | 32,400 |
| Total | 5,110,000 | 4.12 | 676,900 | 10,781,000 | 4.00 | 1,386,600 | |
Notes:
- Mineral Resource Estimates are reported at a cut-off grade of 3.00 g/t Au for an underground mining scenario, except for the South West zone which used the cut-off determined in this PEA (2.6 g/t). The cut-off grade was calculated at a gold price of US$1,250 per ounce, an exchange rate of US$/C$ of 0.75 and operational assumptions outlined in Section 14 of this report. The cut-off for the South West zone was derived by calculations presented in the mining sections of this report.
- The resource estimate is supported by statistical analysis with different high-grade capping applied to each of the deposits ranging from 6.0 g/t Au to 37.0 g/t Au on 1-m composites.
- The mineral resources presented here were estimated with a block size of 10 m x 5 m x 10 m utilizing sub-blocks of variable size as required, and constrained within geological wire frames with a minimum width of 1.50 m, except for the South West update. There the mineral resources were estimated using a sub-blocked model with a parent block size of 15 m x 5 m x 15 m and child block size down to 5 m x 1 m x 5m utilizing these sub-blocks as required and constrained within geological wire frames with a minimum width of 1.50 m. The cells are estimated by Ordinary Kriging using the appropriate variogram model of each structure with individual search ellipsoids.
- The mineral resources presented here were estimated by Micon International Limited using the Canadian Institute of Mining, Metallurgy and Petroleum (CIM) Definitions and Standards on Mineral Resources and Reserves.
- Mineral resources which are not mineral reserves do not have demonstrated economic viability. The estimate of mineral resources may be materially affected by environmental, permitting, legal, title, market or other relevant issues.
- The quantity and grade of reported Inferred Resources are somewhat uncertain in nature and there has not been sufficient work to define these Inferred Resources as Indicated or Measured Resources.
- There are no historical underground voids from mining including shafts, ramps drifts or stopes in any of the deposit areas.
- Tonnage estimates are based on bulk densities individually measured and calculated for each of the deposit areas, averaging 2.78 tonnes per cubic metre for the total resource. Resources are presented as undiluted and in situ.
- The mineral resource estimates for South West and West Block are dated September 09, 2020. All other zones are dated January 15, 2019. The effective date for the drill hole database used to produce this updated mineral resource estimate for South West and West Block is November 26, 2019 and November 19, 2018 for the other zones. Tonnages and ounces in the tables are rounded to the nearest thousand and hundred respectively. Numbers may not total precisely due to rounding.
- At the present time, Micon does not believe that the mineral resource estimate is materially affected by environmental, permitting, legal, title, taxation, socio-political, marketing, or other relevant issues.
METALLURGY
Gold recoveries in the processing plant are based on metallurgical recovery test work performed by SGS-Lakefield Laboratory Limited, based in Ontario, Canada performed in 2012 and 2019. Historical metallurgical recovery test-work conducted by Newmont Gold and Barrick in the 1990's was also reviewed. An average gold recovery of 94.2% is used for the owner build scenario assuming the inclusion of a gravity gold recovery circuit in the process flow sheet to capture coarse gold with 24 hour cyanide leaching of the gravity tails after crushing and grinding, based on the results of test work completed to date.
INFRASTRUCTURE
The Golden Highway project, in which the South West deposit is located, is located 100 km east of Timmins, Ontario adjacent to a major sealed highway, Highway 101. A 5 km access road from the highway affords access to the proposed portal site. High tensile electrical power grids occur within 5 km of the proposed site and carry sufficient power to supply several mining operations in the area. Water is locally available, as is building aggregate.
The proposed base case development option involves the construction of an ore stockpile pad, a 1,750 tpd processing plant with sufficient crushing, grinding and leach capacity to process the ore and recover gold into doré bars. For this option a tailings dam with capacity of approximately 6.0 million tonnes is required to be constructed at site. No camp is required due to the proximity of major population centres with significant local mine contracting and technical expertise.
ALTERNATIVE DEVELOPMENT OPTION: TOLL MILLING
Table 8: Toll Milling Development Option: Technical Inputs and Financial Assumptionsn
| Economics | Pre-Tax | Post-Tax | |
| Net present value (NPV5%) | C$ million | $306.2 | $196. 9 |
| Internal rate of return (IRR) | % | 63.9 % | 43.8 % |
| Payback Period (Undiscounted) | years | 2.2 years | 3.1 years |
| LOM avg. annual cash flow | C$ million | $47.8 | $ 33.4 |
| LOM cumulative cash flow (undiscounted) | C$ million | $446.9 | $296.2 |
| LOM Average cash costs | US$ per ounce | US$796 | |
| LOM Average AISC - All in Sustaining Costs | US$ per ounce | US$938 | |
| LOM Average AIC - All in Costs | US$ per ounce | US$1009 | |
| Initial Capital Costs | C$ Million | C$64.5 | |
| Sustaining Capital Costs (LOM) | C$ Million | C$127.4 | |
| Profitability Index | NPV/Initial Capital | 3.05 | |
| Peak Investment | C$ million | 38.9 | |
| Gold price assumption | US$ per ounce | US$1,500 | |
| Exchange Rate | US$/C$ | 0.77 | |
| Mine Life | years | 11 | |
| Mill Grade (diluted) and Recovery | g/t Au, % | 3.93 g/t Au, 92.2% | |
| Average annual mining rate | tonnes/day (tpd) | 1,750 tpd | |
| Average annual gold production | thousand ounces/yr | 74Koz/pa | |
| Total LOM recovered gold | million ounces | 704Koz | |
The PEA also reviewed the option to process the mined resource at South West utilizing an existing processing plant in the Timmins mining camp. This scenario assumed the same mine plan and production rate with trucking to an existing processing plant and payment of a toll milling rate for the processing of ore and recovery of gold. Primary crushing is included in the costs and no gravity gold recovery circuit is assumed to be used in this option resulting in an average life of mine gold recovery rate of 92.2%. The same underground development capital costs are used as well as the same mine development infrastructure, but no processing plant and no tailings storage facility is assumed in the development plan. The toll treating options would allow for a faster development time with fewer permitting requirements, less construction time and lower capital requirements to develop the toll milling option.
Table 9: Toll Milling Development Option: Gold Price Sensitivities

To view an enhanced version of Table 9, please visit:
https://orders.newsfilecorp.com/files/4852/63412_table9.png
Table 10: Toll Milling Development Option: Operating Costs
| Operating Costs | ||
| Cost Centre | LOM (C$MM) | (C$/t) |
| Mining | $393.24 | $65.16 |
| Processing | $289.68 | $48.00 |
| G&A | $35.77 | $5.93 |
| Total | $718.70 | $119.09 |
WEBCAST DETAILS
Management will host a webcast and conference call to discuss the results of the PEA on September 10, 2020 at 10:30 am ET. Please refer to the details below to join the conference call or the webcast.
CONFERENCE CALL NUMBER
Toll Free Dial-In Number: (833) 772-0367
International Dial-In Number: (343) 761-2596
WEBCAST LINK
https://onlinexperiences.com/Launch/QReg/ShowUUID=AB45B9A9-303C-4209-8145-BE3B789518B2
Please send your questions to management at larmstrong@monetaporcupine.com or at 647-456-9223.
A replay of the conference call will be available at 1:30 pm on the Company's website and by calling (800) 585-8367 or (416) 621-4642.
Further details on the PEA and the complete PEA study document will be found on the Company's website at www.monetaporcupine.com/investors within 45 days and on SEDAR.com
INDEPENDENT QUALIFIED PERSONS
The Preliminary Economic Assessment was prepared for Moneta by independent Qualified Persons (QP's) under National Instrument 43-101 from Micon International Ltd of Toronto, Canada. The independent QP's have reviewed and approved the content of this press release and include:
- B. Terrence (Terry) Hennessey, P.Geo., Senior Economic Geologist and Vice President
- Richard Gowans, P.Eng., President and Principal Metallurgist
- Barnard Foo, P.Eng., M.Eng., MBA, Senior Mining Engineer
- Christopher A. Jacobs, C.Eng, MIMMM, Vice President and Mining Economist
- David Makepeace, M.Eng., P.Eng., Senior Geologist/Environmental Engineer
About Moneta
The Company holds a 100% interest in 6 core gold projects strategically located along the Destor-Porcupine Fault Zone in the Timmins Gold Camp with over 85 million ounces of past gold production. The projects consist of the Golden Highway, North Tisdale, Nighthawk Lake, DeSantis East, Kayorum and Denton projects. The Golden Highway Project covers 12 kilometres of prospective ground along the DPFZ of which 4 km hosts the current 43-101 mineral resource estimate comprised of an indicated resource of 676,900 ounces gold contained within 5.11 Mt @ 4.12 g/t Au and a total of 1,386,600 ounces gold contained within 10.78 Mt @ 4.00 g/t Au in the inferred category at a 2.60 g/t Au at South West and 3.00 g/t Au cut-off for the other deposits.
Non-IFRS Financial Measures
Moneta has included certain non-IFRS financial measures in this news release, such as Initial Capital Cost, Sustaining Capital, Cash Operating Costs ,Total Cash Cost, All-In Sustaining Cost, All-in Cost, Cash Flow Index and Peak Investment, which are not measures recognized under IFRS and do not have a standardized meaning prescribed by IFRS. As a result, these measures may not be comparable to similar measures reported by other corporations. Each of these measures used are intended to provide additional information to the user and should not be considered in isolation or as a substitute for measures prepared in accordance with IFRS.
Non-IFRS financial measures used in this news release and common to the gold mining industry are defined below.
Total Cash Costs and Total Cash Costs per Ounce
Total Cash Costs are reflective of the cost of production. Total Cash Costs reported in the PEA include mining costs, processing & water treatment costs, general and administrative costs of the mine, off-site costs, refining costs, transportation costs and royalties. Total Cash Costs per Ounce is calculated as Total Cash Costs divided by payable gold ounces.
All-in Sustaining Costs ("AISC") and AISC per Ounce
AISC is reflective of all the expenditures that are required to produce an ounce of gold from operations. AISC reported in the PEA includes total cash costs, sustaining capital and closure costs, but excludes corporate general and administrative costs and salvage. AISC per Ounce is calculated as AISC divided by payable gold ounces.
All-in Costs ("AIC") and AIC per Ounce
AIC is reflective of all the expenditures that are required to produce an ounce of gold. AISC reported in the PEA includes total cash costs, general and administrative, initial and sustaining capital and closure costs. AIC per Ounce is calculated as AIC divided by payable gold ounces.
FOR FURTHER INFORMATION, PLEASE CONTACT:
Gary V. O'Connor, CEO
416-357-3319
Linda Armstrong, Investor Relations
647-456-9223
The Company's public documents may be accessed at www.sedar.com. For further information on the Company, please visit our website at www.monetaporcupine.com or email us at info@monetaporcupine.com.
This news release includes certain forward-looking information and forward-looking statements, collectively "forward-looking statements" within the meaning of applicable Canadian securities legislation. Forward-looking statements are frequently identified by such words as "may", "will", "plan", "expect", "anticipate", "estimate", "intend" and similar words referring to future events and results. Forward-looking statements include, but are not limited to information with respect to the future performance of the business, its operations and financial performance and condition such as the Company's drilling program and the timing and results thereof; and the ability of the Company to carry out its anticipated goals and objectives, and potential health issues including the possible impact of the COVID-19 pandemic.
Forward-looking statements are based on the current opinions and expectations of management. All forward-looking information is inherently uncertain and subject to a variety of assumptions, risks and uncertainties, including the speculative nature of mineral exploration and development, fluctuating commodity prices, competitive risks and the availability of financing, as described in more detail in our recent securities filings available at www.sedar.com. Actual events or results may differ materially from those projected in the forward looking-statements and we caution against placing undue reliance thereon. We assume no obligation to revise or update these forward-looking statements.
![]()
To view the source version of this press release, please visit https://www.newsfilecorp.com/release/63412
Source: STLLR Gold Inc.