Vancouver, British Columbia--(Newsfile Corp. - August 29, 2022) - Southern Silver Exploration Corp. (TSXV: SSV) ("Southern Silver") reports results from its Preliminary Economic Assessment ('PEA") on its 100% owned Cerro Las Minitas project ("CLM").
PEA Highlights (all figures in $US unless otherwise noted):
Robust Project Economics - Base Case: after-tax NPV5% of $349M (C$450M) and IRR of 17.9% (using Ag- $21.95/oz, Cu - $3.78/lb, Pb - $0.94/lb and Zn - $1.33/lb);
Excellent Silver and Zinc Price Leverage - Base-case +15%: after-tax NPV5% of $561M (C$730M) and IRR of 24.4% (Ag- $25.24/oz, Cu - $4.35/lb, Pb - $1.08/lb and Zn - $1.53/lb);
Large-Scale Underground Mining Operation with a 15-year mine life with an annual average plant feed of 14.2 Mozs AgEq (inc. 5.8 Mozs Ag) at an AISC of $13.27/oz AgEq sold;
High-Revenue Project: Base Case gross revenues total US$3.7B with silver representing 42% of revenues, zinc representing 39% of revenues. The project has an Initial CapEx of $341M and an NPV-to-CapEx ratio of 1.0X;
Well Located Project in a mining friendly jurisdiction with excellent infrastructure in southeast Durango state, Mexico; and
Further Exploration Upside: Drilling through to August 2022 has confirmed mineralized extensions to the Mina La Bocona and Skarn Front deposits that have not been incorporated into the current Resource Model. Other deposits remain open laterally and to depth and remain to be explored
Lawrence Page. Q. C. President, said: "Cerro las Minitas is aptly named in Mexico as the "Hill of Mines" and is located in the Faja de Plata or "Silver Belt" of northern Mexico where numerous silver and base metal mines have been developed and are currently operating. This location is significant since all the elements necessary to establish a mine are present in infrastructure, competent work force, access to transportation, miner-friendly legislation, power and access to mills and smelters and an environment amenable for year-round operations.
The PEA modelling is based upon a Mineral Resource Estimate prepared in late 2021 with data derived from 171 drill holes. Since that time, twenty-four additional drill holes have been completed resulting in the identification of a further 400 metres of mineralized strike-length and additional value added. The property remains under-explored and the current PEA, with details disclosed in this news release, presents the outline of a large-scale, underground, silver and base metal mine with robust economics which can only grow larger and more valuable as drilling continues to define additional high - grade mineralization.
Since acquisition of the property in 2010 and subsequent identification of the mineral resources, a very profitable and valuable mine has been modelled in the results of the PEA disclosed today. Total acquisition, exploration and development costs are approximately $35 million and significantly, the property is not burdened with royalties, presenting potential financing opportunities for additional drilling and development work on the property. This presentation of the results of the PEA marks a significant milestone in the development of the property and 'the best is yet to come' ".
PEA SUMMARY:
Study support
- The study is based on the Mineral Resource Update ("Resource") by KGL, as of October 27th 2021, using a $60NSR/t cut-off:
- Indicated - 12.3Mt averaging 106g/t Ag, 0.16% Cu 1.3% Pb, and 3.3% Zn totaling 42.1Moz Ag, 44Mlb Cu, 358Mlb Pb and 895Mlb Zn; and
- Inferred - 19.6Mt averaging 117g/t Ag, 0.23% Cu, 1.2% Pb and 2.3% Zn totaling 73.6Moz Ag, 98Mlb Cu, 500Mlb Pb and 1,009Mlb Zn.
(see Appendices for Resource details)
- Only sulphide mineralization was included in the study;
- The PEA project team included Kirkham Geosciences Ltd. ("KGL"), M3 Engineering & Technology Corp. ("M3"), Entech Mining Limited ("Entech"), and Metallurgical Process Consultants Limited ("MPC"); and
- Base Case PEA metal price assumptions: Ag = $21.95/oz, Cu = $3.78/lb, Pb = $0.94/lb, Zn = $1.33/lb.
Cautionary Statement
The PEA is preliminary in nature, it may include mineral resources that are considered too speculative geologically to have the economic considerations applied to them that would enable them to be categorized as mineral reserves, and there is no certainty that the PEA will be realized. Mineral resources that are not mineral reserves have not demonstrated economic viability. The mineral resources may be affected by subsequent assessment of mining, environmental, processing, permitting, taxation, socio-economic, and other factors.
Project Economics
The CLM project demonstrates robust LOM revenues over 15 years of production and after-tax Net Present Value at a 5% discounted rate (NPV5%) of $349M. Projected maximum cash outlay for the project is estimated to be US$341M and project payback is approximately 60 months.
Table 1: CLM Project Economics
| Item | Units | Base Case |
| Revenue | $M US | $3,705 |
| Total Costs (excl. income tax and EBITDA royalty) | $M US | $2,581 |
| LOM pre-tax cash flow | $M US | $1,124 |
| LOM after-tax cash flow | $M US | $696 |
| NPV pre-tax (5% Discount) | $M US | $619 |
| NPV pre-tax (10% Discount) | $M US | $336 |
| IRR pre-tax | % | 25.4% |
| NPV after-tax (5% Discount) | $M US | $349 |
| NPV after-tax (10% Discount) | $M US | $156 |
| IRR After Tax | % | 17.9% |
| Max Cash Outlay | $M US | $341 |
| Payback (discounted, after-tax) | months | 60 |
After-Tax, Free Cash Flow
Figure 1 illustrates the estimated annual and cumulative after-tax cash flow over the life-of-mine ("LOM"). Mine scheduling targets higher margin mineralization in the first eight years of production leading to a more aggressive paydown of capital and improved economics.
Figure 1: Annual and LOM after-tax Cash Flow

To view an enhanced version of this graphic, please visit:
https://images.newsfilecorp.com/files/5344/135230_a6c73f215430abf0_003full.jpg
Economic Sensitivities
The Project's gross revenues, NPV5% and IRR shows greatest sensitivity to metal prices.
Table 2: Gross Revenue, NPV5% and IRR sensitivity at base-case and +/- 15% pricing
| All Metal Price (Ag, Cu, Pb, Zn) Sensitivity | ||||
| Metal Price | Revenue (US$M) | NPV, after tax @ 0% (US$M) | NPV, after tax @ 5% (US$M) | IRR, after Tax |
| Base Case | $3,705 | $696 | $349 | 17.9% |
| +15% | $4,261 | $1,024 | $562 | 24.4% |
| -15% | $3,149 | $368 | $137 | 10.6% |
Note: Base Case price assumes Ag = $21.95/oz, Cu = $3.78/lb, Pb = $0.94/lb, Zn = $1.33/lb
Other factors that may impact the NPV sensitivity include changes in silver and zinc metal recoveries, OpEx and Initial Capital. These relative impacts together with changes in silver and zinc prices are shown in Table 3 and Figure 2.
Table 3: NPV sensitivity as a function of select metals prices, recoveries, CapEx and OpEx:
| Sensitivity NPV @ 5%, after Tax (US$M) | ||||||
| Sensitivity | Silver Price | Zinc Price | Silver in Pb Recovery | Zinc Recovery | Initial Capital | OPEX |
| 20% | $468 | $460 | $286 | $240 | ||
| 15% | $438 | $432 | $302 | $268 | ||
| 10% | $408 | $404 | $405 | $387 | $318 | $295 |
| 5% | $379 | $377 | $377 | $368 | $333 | $322 |
| 0% | $349 | $349 | $349 | $349 | $349 | $349 |
| -5% | $320 | $321 | $321 | $330 | $365 | $376 |
| -10% | $290 | $294 | $293 | $311 | $381 | $403 |
| -15% | $260 | $266 | $265 | $292 | $396 | $431 |
| -20% | $231 | $239 | $236 | $273 | $412 | $458 |
Note: +15% and +20% Silver and Zn recoveries are not applicable
Figure 2: After-tax NPV5% sensitivities

To view an enhanced version of this graphic, please visit:
https://images.newsfilecorp.com/files/5344/135230_a6c73f215430abf0_006full.jpg
Production and Costs:
Potential annual mine production is estimated to deliver 14.2 Moz AgEq (includes 5.8 Mozs Ag) to the processing facility averaged over a 15-year period. Potential annual saleable product in concentrate, which excludes treatment and refining, is estimated to average 12.7 Moz AgEq (includes 5.3 Moz Ag) with annual product of sales (net deductions, treatment and refining) averaging 11.3 Moz AgEq (includes 4.7 Mozs Ag).
Peak annual Plant Feed is achieved in Year 8 with 22.7 Mozs AgEq (includes 8.2 Moz Ag) being mined with peak annual saleable product in concentrate of 20.7 Moz AgEq (includes 7.5 Moz Ag), and peak annual product of sales of 18.0 Moz Ag Eq (includes 6.7 Moz Ag). Table 4 summarizes the estimated metal production from the CLM project.
Table 4: CLM LOM Production and Metal Sales
| Units | Y1-8 | LOM | |
| AgEq Plant Feed (Yearly Average) | (Moz) | 16.8 | 14.2 |
| AgEq Saleable Product (Yearly Average) | (Moz) | 15.2 | 12.7 |
| AgEq Product of Sales (Yearly Average) | (Moz) | 13.4 | 11.3 |
| AgEq Plant Feed (Total) | (Moz) | 134.8 | 213.6 |
| AgEq Saleable Product (Total) | (Moz) | 121.4 | 190.4 |
| AgEq Product of Sales (Total) | (Moz) | 107.5 | 168.8 |
| All-In Sustaining Cost (AISC) | (US$/AgEq oz) | $12.73 | $13.27 |
| includes Contained Silver | |||
| Units | Y1-8 | LOM | |
| Ag Plant Feed (Yearly Average) | (Moz) | 6.9 | 5.8 |
| Ag Saleable Product (Yearly Average) | (Moz) | 6.3 | 5.3 |
| Ag Product of Sales (Yearly Average) | (Moz) | 5.6 | 4.7 |
| Ag Plant Feed (Total) | (Moz) | 55.2 | 86.4 |
| Ag Saleable Product (Total) | (Moz) | 50.6 | 79.1 |
| Ag Product of Sales (Total) | (Moz) | 45.2 | 70.8 |
Note: AgEq was determined assuming only base case metal pricing
Mine Schedule and All-In-Sustaining-Cost (AISC)
Mine scheduling targets higher value silver-lead production in the first 8 years of mine life with lower AgEq grading material (zinc-copper dominant) being targeted in the final 7 years. Total plant feed (mine production) is estimated to be 213.6 Mozs AgEq (includes 86.4 Mozs Ag) with 168.8 Moz AgEq (includes 70.8 Moz Ag) being sold. Total all-in sustaining costs ("AISC") are estimated to be $US 2.24B, averaging $US 91.61/t mined or $US10.49/oz AgEq plant feed, US$11.76/oz AgEq for saleable product and $US13.27/oz AgEq sold. LOM production and AISC are illustrated in Figure 3.
Figure 3: LOM AgEq sales and AISC:
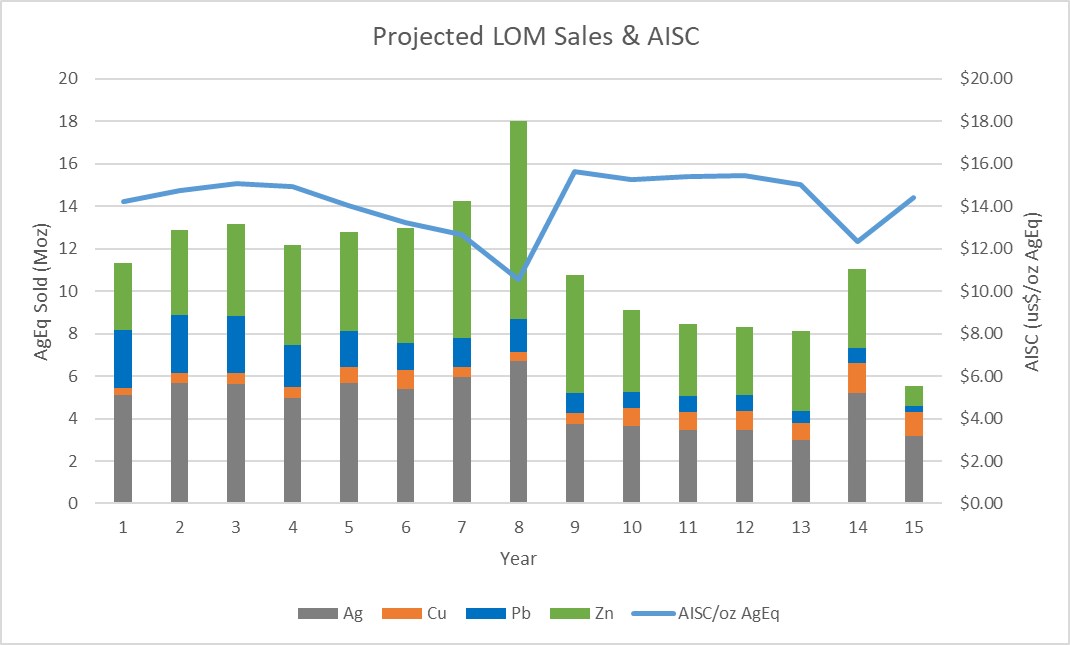
To view an enhanced version of this graphic, please visit:
https://images.newsfilecorp.com/files/5344/135230_a6c73f215430abf0_008full.jpg
OPERATIONS:
Mining:
The mine plan was completed by Entech and incorporates longitudinal and transverse longhole stoping methods. Two separate portals are proposed to access the various deposits, with one portal accessing the Blind-El Sol and Skarn Front deposits, and a second portal accessing the La Bocona and South Skarn deposits. The process in creating the mine plan is further described below:
- Datamine® Mineable Stope Optimizer ("MSO") was used to produce shapes for mine planning purposes. The Resource model from October 27, 2021 by Kirkham Geosciences Ltd. was used for the evaluation and MSO analyses considered a preliminary cut-off value of $US 64/t NSR;
- MSOs considered minimum mining width of 3.0 m minimum mining width (inclusive of 1.0 m width for unplanned dilution in rock), 25 m sub-levels, and 20 m strike lengths;
- A total of 24.5 million tonnes averaging $US 128/t NSR (109 g/t Ag, 0.20 % Cu, 1.07 % Pb, and 2.57 % Zn) was sent to the processing facility, representing a conversion of approximately 78% of the Resource at a $US 64/t cut-off value;
- Depending on the width of the stope and the strike of continuous sections of wider zones, transverse stoping was selected and mined bottom-up. For predominately narrower zones (typically less than 18m) longitudinal stoping was selected and mined either top-down or bottom-up depending on location and timing of development. Overall, the average stope width by tonnage was 16.5 m;
- Detailed geotechnical analysis including hydrogeological modelling is to be completed in further studies of the deposit. The assumptions made for the study included that longhole stoping would be an appropriate method for this Preliminary Economic Assessment. An equivalent linear overbreak slough (ELOS) was assumed to be 1.0m (0.5m from each wall) and additional dilution for mining of backfill was considered. Backfill dilution was varied depending on exposure, with 1.0m considered from the backs (top-down), 0.25m from the floor (bottom-up), 0.5m from the far wall (longitudinal stoping), and 0.5m from one adjacent wall (transverse stoping mined centre-out);
- A stope recovery factor of 93% and development recovery factor of 97% was considered.
The grade and average stoping widths are illustrated in Figure 4 and Figure 5 respectively.
Figure 4: US$NSR/t grade distribution of the Cerro Las Minitas MSO model - looking northeast
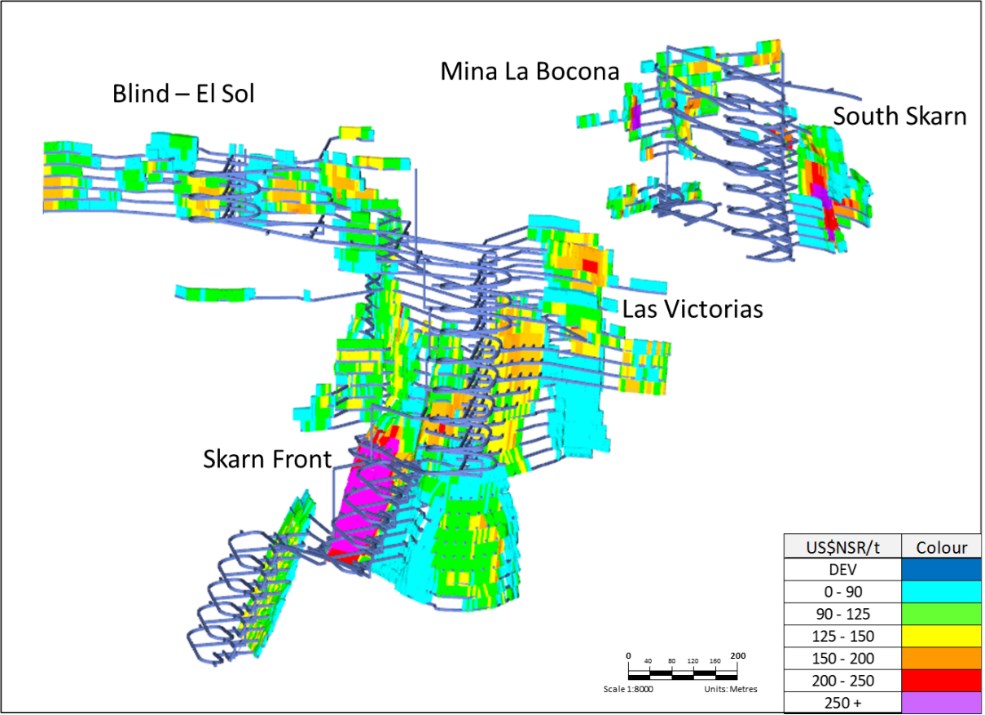
To view an enhanced version of this graphic, please visit:
https://images.newsfilecorp.com/files/5344/135230_a6c73f215430abf0_009full.jpg
Figure 5: Average Stope Width of the Cerro Las Minitas MSO model - looking northeast

To view an enhanced version of this graphic, please visit:
https://images.newsfilecorp.com/files/5344/135230_a6c73f215430abf0_010full.jpg
Processing:
The process plant for the base-case PEA-level study is a conventional sulphide flotation system consisting of:
- Primary crushing, a 15,000 tonnes ROM stockpile, reclaim and secondary crushing, closed-circuit ball mill grinding and sequential Cu-Pb-Zn (each with rougher-regrind-cleaner stages) flotation circuit producing three filtered concentrates for sale;
- Sulphide tails are dry sequestered for potential future recovery of refractory gold;
- Barren tailings to Paste Plant for underground mine cement backfill with the surplus, dry-stacked to surface
- Design Annual Throughput of 1,642,500 tonnes based on nominal 4,500 tpd throughput and 5,500 tpd instantaneous throughput. (92% availability LOM).
Head grades:
MSO scheduling successfully prioritized higher grade material to the mill earlier in the mine life resulting in higher heads grades (and associated annual revenue) in the first eight years of production as compared to the final 7 years.
Similarly, processed tonnes averages 1.79 million tonnes in the first eight years of mine life and 1.44 million tonnes in the final 7 years.
Table 5: Head grade over Yr1-8 and LOM
| HEAD GRADES | Units | Y1-8 Average | LOM |
| Avg. Annual Plant Feed | (kt) | 1,791 | 1,630 |
| Ag | (g/t) | 120 | 110 |
| Cu | (%) | 0.14 | 0.20 |
| Pb | (%) | 1.4 | 1.1 |
| Zn | (%) | 2.8 | 2.6 |
| AgEq | (g/t) | 293 | 272 |
Recoveries and Tailings:
- Only sulphide mineralization was included in the mine model. Average grades are reported above.
- A series of Batch/Locked cycle testwork/variability testwork programs conducted between 2018 and 2022 confirmed that the Cu-Pb-Zn sequential flotation flowsheet would be appropriate for processing all the sulphide mineralization from the deposit.
- Circuit design based on high Eh stainless grinding media and optimised reagent selection for sequential flotation which maximizes base metal grades and recoveries while minimizing misplacement of base metals to other concentrates.
- While mining progresses through various geo-metallurgical ore types, the plant is designed to handle wide variations in both grade and sulphide mass pull. The LOM data indicates that 75% -80% of the mined tonnage is Skarn Front type ore, and the tabled grades reflect this averaging.
- Recent testwork confirmed that arsenic elimination from the zinc circuit allows generation of a pyrite/arsenopyrite-rich concentrate containing 80% of the ROM gold to be produced. This material is to be filtered and sequestered for possible future recovery of the refractory gold.
- Non-sulphide tailings surplus to the backfill requirements are dry stacked in a suitable area some 1000m NW of the process plant.
CONCENTRATE TERMS:
Metal Payables
The project is expected to produce three clean, high-quality concentrates with minimal penalty elements as established in Southern Silver's metallurgical test work. Southern Silver utilized Industry standard payables and deductions.
Approximately 91% of Ag is recovered with 84 % reporting to the Pb concentrate.
Table 6: Metal Recoveries established for the PEA
| Item | Pb Conc. | Zn Conc. | Cu Conc. |
| Pb Recovery | 88% | ||
| Zn Recovery | 93% | ||
| Cu Recovery | 60% | ||
| Ag Recovery | 84.3% | 7.3% | |
| Concentrate Grade (Primary Base Metal) | 65% | 53% | 27% |
Refining and Treatment:
Treatment and refining charges were based on consultation with industry professionals and generated the terms indicated below:
Table 7: Refining and Treatment
| Ag | Cu | Pb | Zn | |
| Cu Concentrate | ||||
| Average Concentrate Grade LOM | - | 27% | - | - |
| Payable Metal | - | 95% | - | - |
| Minimum Deduction | 1 unit | |||
| Pb Concentrate | ||||
| Average Concentrate Grade LOM | 6,350g/t | - | 64.90% | - |
| Payable Metal | 95% | - | 95% | - |
| Minimum Deduction | 50g/t | - | 3 Units | - |
| Zn Concentrate | ||||
| Average Concentrate Grade LOM | 179g/t | - | - | 53.50% |
| Payable Metal | 70% | - | - | 85% |
| Minimum Deduction | 3oz/t | - | - | 8 units |
The high Ag grade in the Pb concentrate makes it attractive to smelters and could result in more favourable treatment terms, but these have not been considered at the PEA level. Penalty elements are low, with Cd (in solution with Zn) ($49/t conc.) being the major contributor to Zn penalties, and Sb (in solution with Pb) being the major source of Pb penalties ($27/t conc). Arsenic present in 2020 concentrates was removed in 2022 testwork, but an allocation of $14.60/t Pb concentrate is still provided for in the PEA.
Concentrate Transportation:
Transportation costs assume trucking of the concentrate via containers to the international port at Manzanillo, Colima, and then shipping via ocean freight to Asia. Estimated transportation costs (trucking, port handling and ocean freight) are US$96/wmt (wet metric tonnes) for Pb concentrate and US$106/wmt for Zn concentrate. Moisture contents are assumed to be 8.5% based on the grind size of the final concentrates.
CAPITAL EXPENDITURES:
Total initial capital investment in the project is estimated to be $341.0 million and includes $55 million contingency, which represents the total direct and indirect cost for the development of the project, including associated infrastructure.
Table 8: Capital Expenditure break down.
| Item | Total ($M) |
| Process Plant and Infrastructure | |
| Project Directs including freight | $185 |
| Project Indirects | $35 |
| Contingency | $55 |
| Sub-Total | $275 |
| Process Pre-production | $3 |
| Mining | |
| Pre-Production Capital Costs | $63 |
| Total Initial Capital Costs | $341 |
| Sustaining Capital | $168 |
| Total Capital Costs | $509 |
The initial Capex of $275M was distributed in the Cash Flow model using a 40% (Yr -2), 55% (Yr -1), 5% (Yr 1) methodology.
Mining development costs were developed by Entech considering a mining contractor model. Total capital costs including sustaining capital allocated to mining are approximately $US228M comprising of the following:
Table 9: Mining Capital Breakdown
| Item | Total (US$M) |
| Initial Development | $35 |
| Sustaining Development | $104 |
| Capitalised OpEx | $23 |
| Equipment Purchases/Rebuilds | $29 |
| Projects | $37 |
| Total Mining Capital Costs | $228 |
- Initial development costs are approximately $US 35M;
- Sustaining development are approximately $US 104M;
- Reallocated operating expense of $US 23M.
- Contractor mobilization, equipment purchases and half-life rebuilds (pumps, primary and auxiliary fans, compressors, and substations) are approximately $US 29M;
- Initial project capital expenses (portals, primary fans, initial pump stations, refuge chambers, etc. plus a 25% contingency) are approximately $US 37M; and,
- Total lateral capital development cost of $US 5,705 /m and includes a reallocation of operating expense to capital of $US 701 /m;
- Direct costs of $3,749 /m and indirect costs of $US 1,255 /m.
OPERATING COSTS
Operating costs are broken down into Mining, Processing, G&A and Treatment and Refining costs, plus additional production charges including government royalty, employee profit sharing and closure expenses. Operating costs were developed by M3 and Entech (Mine Operating Cost).
Table 10: Operating cost breakdown on a per tonnage basis
| Area | US$/mt ore processed |
| Mine Operating Cost | $38.74 |
| Process Plant Operating Cost | $15.12 |
| G & A | $3.59 |
| Treatment & Refining Charges | $22.66 |
| Operating Cost | $80.10 |
| Royalties - Revenue | $0.32 |
| PTU-Profit Sharing | $4.15 |
| Closure & Salvage Value | $0.17 |
| Other Production Cost | $4.63 |
| Total | $84.74 |
Mining:
The operating costs reflect a contractor mining option which defers capital but utilizes the experience of a contractor for initial construction and development of the mine. Mining considers a modern and large operation using large 21-t loaders and 63-t capable trucks targeting an average daily plant feed of approximately 4,500 tpd (peak of 5,200 tpd averaged for Year 5) and 5,200 tpd when including waste development (peak of 6,100 tpd in Years 2-4). Mining costs are developed by Entech and are from Entech's cost database which includes pricing from mining contractors.
Table 11: Production and Development Breakdown
| Item | Total (US$) | Total (US$/t) |
| Development | $140 | $5.71 |
| Production | $808 | $33.03 |
| Total Production and Development Costs | $947 | $38.74 |
Operating costs are summarized as follows and are appropriate for a Preliminary Economic Assessment:
- Total underground mining operating costs are approximately $US 947M at an average of $US 38.74/t;
- Operating development (including non-capital waste development) of $US 2,852/m (direct costs of $US 2,505 /m) and averages on a per tonne basis of $US 5.71/t;
- Production costs of $US 33.03/t of which $US 24.71 are direct costs and $US 8.32/t are indirect costs which includes labour (mine management/technical services), maintenance, power, and other costs.
Processing and G+A costs:
The process plant for the base-case PEA-level study is a conventional sulphide flotation system consisting of both primary and secondary crushing, a closed-circuit ball mill grinding and sequential Cu-Pb-Zn flotation circuit producing three filtered concentrates for sale. Operating costs are as follows:
Table 12: Breakdown of Process Plant Operating cost
| Operating & Maintenance | US$/mt ore processed |
| Labor | $1.35 |
| Electrical Power | $4.45 |
| Reagents | $5.08 |
| Liners/Grinding Media | $1.31 |
| Maintenance Parts | $1.60 |
| Supplies and Services | $1.33 |
| Total (US$) | $15.12 |
G&A costs reflect a well-located project in an area of excellent infrastructure and immediately adjacent to the town of Guadalupe Victoria (population: ~35,000).
Table 13: Breakdown of G&A cost
| Item | US$/mt ore processed |
| Labor | $0.95 |
| IT/Communications | $0.50 |
| HR/Safety/Social | $0.68 |
| Property/Security | $0.96 |
| Legal/Finance/Accounting | $0.50 |
| Total | $3.59 |
OPPORTUNITIES:
Mine life extension: Additional drilling on the project, through to August 2022 (see NR-06-22; July 25,2022), has now confirmed the continuity of new mineralization over an approximate 400 metre strike-length extending laterally from the Mina La Bocona to the Skarn Front deposits. This mineralization has not been accounted for in the current study. Furthermore, mineralization remains open at depth, specifically beneath the Mina La Bocona, South Skarn and some portions of the Skarn Front deposits suggesting further potential Resource growth.
Infill Drilling: Infill drilling, specifically on the portions of the deposit that fall within the Inferred category of classification will increase confidence in the Mineral Resource estimate, will further de-risk the project and potentially increase the value of the project.
Metallurgical Upside: Recent metallurgical testwork confirmed that arsenic elimination from the zinc circuit allows generation of a pyrite/arsenopyrite-rich concentrate containing 80% of the ROM gold to be produced. This material is to be filtered and sequestered for possible future recovery of the refractory gold.
TECHNICAL DISCLOSURE
- All mineral resources have been estimated in accordance with Canadian Institute of Mining and Metallurgy and Petroleum (CIM) definitions, as required under NI43-101.
- Mineral resources reported demonstrate reasonable prospect of eventual economic extraction, as required under NI43-101.
- Mineral resources are not mineral reserves and do not have demonstrated economic viability. The mineral resources may be materially affected by environmental, permitting, legal, marketing, and other relevant issues.
- The PEA is preliminary in nature, it may include mineral resources that are considered too speculative geologically to have the economic considerations applied to them that would enable them to be categorized as mineral reserves, and there is no certainty that the PEA will be realized.
- An inferred mineral resource has a lower level of confidence than that applying to an indicated mineral resource and must not be converted to a mineral reserve. It is reasonably expected that most of the inferred mineral resources could be upgraded to indicated mineral resources with continued exploration.
- All-in Sustaining cost (AISC) is calculated as: Operating costs (mining, processing and G&A) + Incremental PTUs + Concentrate Transportation + Treatment & Refining Charges + Penalties + Sustaining Capital + Closure Costs +Silver Revenue Royalty and is reported on using a per tonne mined, AgEq plant feed, AgEq recovered for sale, and AgEq payable basis
- A full technical report will be prepared in accordance with NI 43-101 and will be filed on SEDAR within 45 days of this press release.
APPENDICES
Appendices with the following supporting information is found at the back of this release.
Appendix A: Base Case Sulphide Mineral Resource Estimate
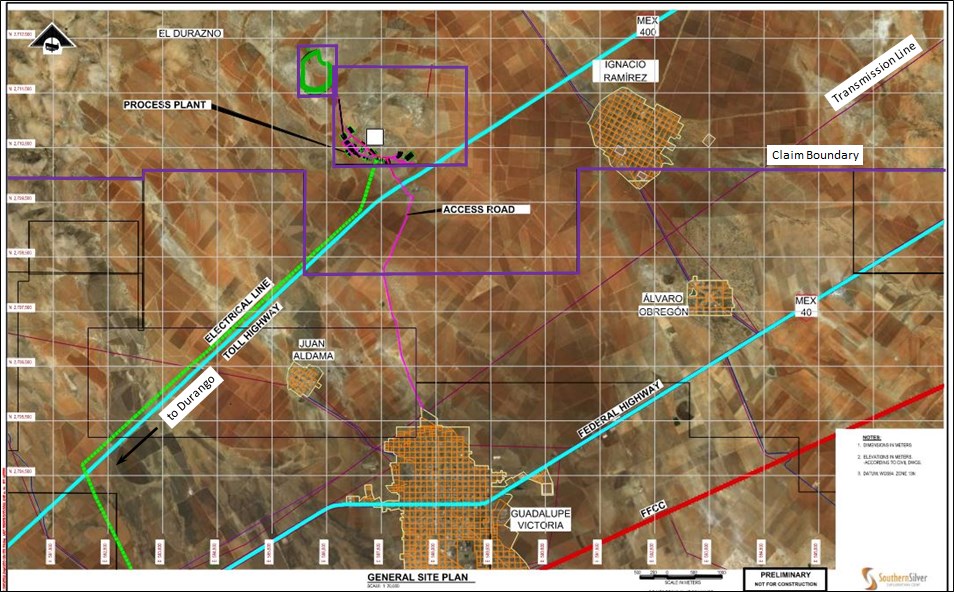
Appendix B: Project location and Infrastructure
Appendix C: Simplified Process Flow Sheet
About Southern Silver Exploration Corp.
Southern Silver Exploration Corp. is an exploration and development company with a focus on the discovery of world-class mineral deposits either directly or through joint-venture relationships in mineral properties in major jurisdictions. Our specific emphasis is the 100% owned Cerro Las Minitas silver-lead-zinc project located in the heart of Mexico's Faja de Plata, which hosts multiple world-class mineral deposits such as Penasquito, Los Gatos, San Martin, Naica and Pitarrilla. We have assembled a team of highly experienced technical, operational and transactional professionals to support our exploration efforts in developing the Cerro Las Minitas project into a premier, high-grade, silver-lead-zinc mine. Our property portfolio also includes the Oro porphyry copper-gold project where a diamond drill program is underway and the Hermanas gold-silver vein project where permitting applications for the conduct of a drill program is underway, both located in southern New Mexico, USA
On behalf of the Board of Directors
"Lawrence Page"
Lawrence Page, Q.C.
President & Director, Southern Silver Exploration Corp.
For further information, please visit Southern Silver's website at https://www.southernsilverexploration.com or contact us at 604.641.2759 or by email at ir@mnxltd.com.
Qualified Person
The PEA for the Cerro Las Minitas project as summarized in this release was completed by Kirkham Geosystems Ltd. ("KGL"), M3 Engineering & Technology Corp. ("M3"), Entech Mining Limited ("Entech"), and Metallurgical Process Consultants Limited ("MPC"). A full technical report will be prepared in accordance with NI43-101 and will be filed on SEDAR within 45 days of this press release.
The scientific and technical content of this news release was reviewed and approved by Robert Macdonald, MSc. P.Geo, VP. Exploration, and is a Qualified Person as defined by National Instrument 43-101 - Standards of Disclosure for Mineral Projects.
Neither TSX Venture Exchange nor its Regulation Services Provider (as that term is defined in the policies of the TSX Venture Exchange) accepts responsibility for the adequacy or accuracy of this release.
This news release contains forward-looking statements. Forward-looking statements address future events and conditions and therefore involve inherent risks and uncertainties. Actual results may differ materially from those currently anticipated in such statements. Factors that could cause actual results to differ materially from those in forward looking statements include the timing and receipt of government and regulatory approvals, and continued availability of capital and financing and general economic, market or business conditions. Southern Silver Exploration Corp. does not assume any obligation to update or revise its forward-looking statements, whether as a result of new information, future events or otherwise, except to the extent required by applicable law.
Appendix A: Base Case Sulphide Mineral Resource Estimate
| CLM Sulphide Resources @ $60/t Cutoff | |||||||||
| Indicated Resources | Average Grade | ||||||||
| Zone | Tonnes | Ag | Au | Pb | Zn | Cu | AgEq | ZnEq | NSR |
| (Kt) | (g/t) | (g/t) | (%) | (%) | (%) | (g/t) | (%) | (US$/t) | |
| Blind Zone | 2,347 | 97 | 0.04 | 1.9 | 2.1 | 0.11 | 295 | 7.2 | 108 |
| El Sol Zone | 1,154 | 80 | 0.04 | 2.2 | 2.0 | 0.09 | 279 | 6.8 | 100 |
| Skarn Front Zone | 7,254 | 108 | 0.06 | 0.8 | 4.2 | 0.19 | 383 | 9.3 | 140 |
| La Bocona Zone | 1,571 | 132 | 0.19 | 2.2 | 1.6 | 0.17 | 302 | 7.3 | 136 |
| Total | 12,325 | 106 | 0.07 | 1.3 | 3.3 | 0.16 | 347 | 8.4 | 130 |
| Inferred Resources | Average Grade | ||||||||
| Zone | Tonnes | Ag | Au | Pb | Zn | Cu | AgEq | ZnEq | NSR |
| (Kt) | (g/t) | (g/t) | (%) | (%) | (%) | (g/t) | (%) | (US$/t) | |
| Blind Zone | 1,347 | 83 | 0.14 | 1.4 | 1.8 | 0.06 | 248 | 6.0 | 88 |
| El Sol Zone | 863 | 65 | 0.03 | 1.8 | 2.3 | 0.05 | 263 | 6.4 | 90 |
| Las Victorias Zone | 1,083 | 148 | 0.66 | 2.1 | 2.6 | 0.14 | 431 | 10.5 | 145 |
| Skarn Front Zone | 11,466 | 115 | 0.05 | 0.7 | 2.7 | 0.32 | 318 | 7.7 | 126 |
| South Skarn Zone | 3,789 | 140 | 0.18 | 2.0 | 1.3 | 0.09 | 309 | 7.5 | 130 |
| La Bocona Zone | 1,057 | 106 | 0.20 | 1.3 | 2.2 | 0.18 | 293 | 7.1 | 117 |
| Total | 19,605 | 117 | 0.12 | 1.2 | 2.3 | 0.23 | 314 | 7.6 | 123 |
| Indicated Resources | Contained Metal | ||||||||
| Zone | Tonnes | Ag TrOz | Au TrOz | Pb | Zn | Cu | AgEq TrOz | ZnEq Lbs | |
| (Kt) | (000's) | (000's) | (Mlbs) | (Mlbs) | (Mlbs) | (000's) | (Mlbs) | ||
| Blind Zone | 2,347 | 7,350 | 3 | 99 | 109 | 5.5 | 22,291 | 371 | |
| El Sol Zone | 1,154 | 2,956 | 2 | 55 | 51 | 2.2 | 10,337 | 172 | |
| Skarn Front Zone | 7,254 | 25,106 | 14 | 126 | 678 | 30.7 | 89,421 | 1,490 | |
| La Bocona Zone | 1,571 | 6,688 | 10 | 77 | 56 | 6.0 | 15,275 | 255 | |
| Total | 12,325 | 42,100 | 28 | 358 | 895 | 44 | 137,323 | 2,288 | |
| Inferred Resources | Contained Metal | ||||||||
| Zone | Tonnes | Ag TrOz | Au TrOz | Pb | Zn | Cu | AgEq TrOz | ZnEq Lbs | |
| (Kt) | (000's) | (000's) | (Mlbs) | (Mlbs) | (Mlbs) | (000's) | (Mlbs) | ||
| Blind Zone | 1,347 | 3,582 | 6 | 40 | 55 | 2 | 10,749 | 179 | |
| El Sol Zone | 863 | 1,816 | 1 | 35 | 43 | 1 | 7,283 | 121 | |
| Las Victorias Zone | 1,083 | 5,152 | 23 | 51 | 62 | 3 | 15,006 | 250 | |
| Skarn Front Zone | 11,466 | 42,462 | 18 | 177 | 687 | 80 | 117,065 | 1,951 | |
| South Skarn Zone | 3,789 | 17,007 | 22 | 167 | 112 | 7 | 37,660 | 628 | |
| La Bocona Zone | 1,057 | 3,589 | 7 | 30 | 51 | 4 | 9,950 | 166 | |
| Total | 19,605 | 73,610 | 78 | 500 | 1,009 | 98 | 197,712 | 3,295 | |
1) The current Resource Estimate was prepared by Garth Kirkham, P.Geo., of Kirkham Geosystems Ltd.
2) All mineral resources have been estimated in accordance with Canadian Institute of Mining and Metallurgy and Petroleum ("CIM") definitions, as required under National Instrument 43-101 ("NI43-101").
3) Mineral resources were constrained using continuous mining units demonstrating reasonable prospects of eventual economic extraction.
4) Silver Equivalents were calculated from the interpolated block values using relative recoveries and prices between the component metals and silver to determine a final AgEq value. The same methodology was used to calculate the ZnEq value.
5) Silver Equivalents and NSR$/t values were calculated using average long-term prices of $20/oz. silver, $1,650/oz. gold, $3.25/lb. copper, $1.0/lb. lead and $1.20/lb. zinc. Metal recoveries, payables and deductions are reported in Table 1. All prices are stated in $USD.
6) Mineral resources are not mineral reserves until they have demonstrated economic viability. Mineral resource estimates do not account for a resource's mineability, selectivity, mining loss, or dilution.
7) An Inferred Mineral Resource has a lower level of confidence than that applying to an Indicated Mineral Resource and must not be converted to a Mineral Reserve. It is reasonably expected that the majority of Inferred Mineral Resources could be upgraded to Indicated Mineral Resources with continued exploration.
8) All figures are rounded to reflect the relative accuracy of the estimate and therefore numbers may not appear to add precisely.
Appendix B: Project Location and Site Infrastructure
To view an enhanced version of this graphic, please visit:
https://images.newsfilecorp.com/files/5344/135230_a6c73f215430abf0_021full.jpg
Appendix C: Simplified Process Flow Sheet
The process plant for the base-case PEA-level study is a conventional sulphide flotation system consisting of both Primary and secondary crushing, a closed-circuit ball mill grinding and sequential Cu-Pb-Zn flotation circuit producing three filtered concentrates for sale. A fourth pyrite concentrate will be produced and sequestered.

To view an enhanced version of this graphic, please visit:
https://images.newsfilecorp.com/files/5344/135230_a6c73f215430abf0_022full.jpg
![]()
To view the source version of this press release, please visit https://www.newsfilecorp.com/release/135230