
With stronger economics and an expanded resource base, Queensway is fully funded to become Canada's next mid-tier gold producer
All dollar amounts are in Canadian dollars unless otherwise stated.
Vancouver, British Columbia--(Newsfile Corp. - October 22, 2026) - New Found Gold Corp. (TSX: NFGC) (NYSE American: NFGC) ("New Found Gold" or the "Company"), a new Canadian gold producer, is pleased to announce positive results for a revised Preliminary Economic Assessment ("PEA" or the "Study") and updated mineral resource estimate ("MRE") on its 100%-owned flagship Queensway Gold Project ("Queensway" or the "Project") in Newfoundland and Labrador ("NL"), Canada.
"I am pleased to announce the results of a revised PEA and updated MRE for Queensway. Our flagship Queensway asset is uniquely attractive, with a high-grade core that starts at surface. It is located in central Newfoundland, close to infrastructure and a skilled workforce," stated Keith Boyle, CEO of New Found Gold. "The revised PEA confirms our estimates for Phase 1 and incorporates our renewed thinking for Phases 2 and 3 of the Project. The PEA more than doubles the Project's NPV5% to $1.7 billion and lifts the IRR to 126%, while Phase 1 capital costs remain in line with the earlier PEA at $150 million. For Phases 2 and 3, the revised approach increases underground ounces in the mine plan by 86% and includes a separate CIL circuit at the Pine Cove mill and the planned Phase 2 expansion of the Queensway mill. Collectively, these changes significantly improve onsite LOM recoveries, increase the doré poured on site and reduce smelter penalties. The revised PEA incorporates a significant amount of work completed at Queensway over the last year and a half."
"In this first update to the Queensway Mineral Resource, we have increased the Measured and Indicated Mineral Resource by 38%, in part due to the addition of the Dropkick Zone. This recent discovery, which remains open along strike and at depth, demonstrates the camp-scale potential at Queensway. We have only begun to evaluate the 110 km of strike extent along two major fault zones."
"Queensway is poised for near-term production. With a mill and tailings facility at Pine Cove and detailed engineering for Phase 1 well-advanced, first mineralized material from Queensway is anticipated to be delivered to the expanded Pine Cove mill in Q4/27. With a Phase 1 open pit operation averaging over 13 grams of gold per tonne, grade control drilling demonstrating continuity, completion of a $220 million finance package and today's revised PEA and updated MRE, New Found Gold has derisked Queensway significantly and charted a clear path to becoming a self-funded mid-tier Canadian gold producer."
Updated PEA and MRE Highlights:
After Tax net present value ("NPV5%"): $1.728 billion ("B") after-tax NPV5% at base case US$3,600 per ounce of gold ("oz Au"), increasing to $2.225 B NPV5% at US$4,100 /oz Au upside case,
Internal Rate of Return ("IRR"): 126% IRR at US$3,600 /oz gold, increasing to 164% IRR at US$4,100 /oz gold,
Gold Production and Mine Life: 1.744 million ("M") oz Au produced over a 15-year phased open pit ("OP") and underground ("UG") operation; Average annual production of 116,000 oz Au and peak annual production of 190,000 oz Au in 2032,
Payback: <1 year payback at US$3,600 /oz gold,
Grade: Average head grade of 13.41 grams of gold per tonne ("g/t Au") in Phase 1 and 2.09 g/t Au average head grade over LOM,
Recovery: 91.5% projected over life of mine ("LOM"),
Cash Cost and All-in Sustaining Cost ("AISC")[1]: US$985 per ounce of gold ("/oz Au") Cash Cost and US$1,375/oz Au AISC,
Capital Expenditures: $149.8 M initial capital, in-line with the previous estimate, $832.1 M growth capital, increased primarily due to scope change of adding a carbon-in-leach ("CIL") circuit to the Pine Cove Mill and in-pit tailings facility ("Pine Cove" or the "Off-site Mill"), and $970.8 M sustaining capital over LOM, increased primarily due to additional underground development to increase underground ounces in the mine plan by 86% and investment in the future of the Project, with cash flows from Phases 1 and 2 anticipated to fund growth capital for Phases 2 and 3, respectively,
Well-Capitalized: With cash and cash equivalents of approximately $167 M in the treasury as at September 30, 2026, a further $35 M debt facility available[2], potential proceeds from warrants expiring in 2027 and cash flow from the Company's 100% owned Hammerdown Gold Deposit through 2027, the Company is fully funded,
Cash Flows: $2.551 B cumulative after-tax cash flows over 15-year LOM, including $836 M from Phase 1,
Mineral Resource Growth: 38% (528 thousand ounces of gold ("koz Au")) increase in Measured & Indicated Mineral Resource to 1.920 Moz Au (27,325 thousand tonnes ("kt") at 2.19 g/t Au); Inferred Mineral Resource remains at 606 koz Au (12,471 kt at 1.51 g/t Au),
Resource Expansion Potential: the orogenic gold system at Queensway remains open to depth and along strike over the 110 kilometre ("km") long camp-scale land package, and
Job Creation: A total of 530 new direct jobs are expected to be created in central Newfoundland over the LOM.
Cautionary Statement
The PEA is preliminary in nature. It includes Inferred Mineral Resources that are considered too speculative geologically to have economic considerations applied to them that would enable them to be categorized as Mineral Reserves, and there is no certainty that the PEA will be realized. Mineral resources are not mineral reserves and do not demonstrate economic viability. No Mineral Reserves are defined for Queensway.
Revised PEA
The PEA strategy of using a phased approach with an offsite permitted mill to execute a rapid path to cash flow remains the same as in the Company's previously released Preliminary Economic Assessment (the "2025 PEA"). The PEA incorporates the updated MRE, as well as several technical advancements including updated engineering, mine planning, metallurgical process design, environmental planning, capital and operating cost estimates, and revised market assumptions, providing a current assessment of the Project's development potential. The key similarities and differences between the PEA and the 2025 PEA are summarized below.
Unchanged from the 2025 PEA:
A three-phase operation,
Offsite and subsequent onsite processing,
A primary conventional OP mine complemented by a high-grade UG mechanized cut and fill mine, and
In-pit tailings deposition at Queensway.
Revised from the 2025 PEA:
Processing Phase 1 at the Company's 100%-owned Off-site Mill, rather than at the idle third party-owned Nugget Pond mill ("Nugget Pond"),
A full gravity-carbon-in-leach ("Gravity-CIL") circuit at own Pine Cove mill, rather than the restart of Nugget Pond,
Initial mining with a contractor, transitioning to owner mining, rather than solely owner mining,
Incorporation of Appleton Fault Zone Peripheral area ("AFZ Peripheral"), including the new Dropkick Zone ("Dropkick") and the Appleton Fault Zone Core area ("AFZ Core") in the mine plan, rather than only the AFZ Core,
An 86% increase of ounces in the mine plan in the UG, both to reduce excessive stripping requirements and as a result of a high-grade shoot delineated at Dropkick,
The advancement of the UG in the mine plan from Phase 3 to Phase 2,
The onsite processing plant ("Queensway Mill") being built in two stages, rather than one,
Constructing two parallel circuits at the Queensway Mill, a Gravity-CIL circuit to treat the high and mid-grade mineralized material and a gravity flotation circuit to treat low-grade and refractory material,
An increase in the strip ratio from 6.0 to 6.5 as a result of the addition of geotechnical studies,
In-pit tailings deposition through all phases of the Project, and
Refinement of operational and capital estimates.
Development Strategy
Queensway is planned as a primary conventional OP mine, complemented by high-grade UG mechanized cut and fill mining across numerous deposits in the AFZ Core and the AFZ Peripheral. The mining strategy consists of OP mining at the AFZ Core starting in Q4/27 using a contractor operating model in the initial years, transitioning to an owner operating model to increase mining and material movement rates. UG mining operations are planned to commence in 2030. Mining operations are expected to run until 2040 based on the current MRE and resultant mine plan.
The development strategy is planned over three phases, as follows:
Phase 1: Milling of OP mineralized material from the Keats and Iceberg deposits is planned to commence in Q4/27 at Pine Cove at a rate of 700 tonnes per day ("tpd"). Pine Cove is currently being converted to a Gravity-CIL circuit comprising conventional comminution, gravity concentration, cyanide leaching and absorption through CIL to produce doré. The Company plans to expand the capacity at Pine Cove to accommodate Queensway Phase 1. High Grade mineralized material from the Queensway site will be trucked to and processed at Pine Cove until the end of 2030.
Phase 2: Commencing in 2031, OP and UG mineralized material from all deposits will be milled at a rate of 4,900 tpd at a new on-site Queensway Mill. Once the Queensway Mill is operational in 2031, the Company will cease sending feed to Pine Cove. The Queensway Mill will be built with two parallel processing circuits; namely, high-grade mineralized material will be treated via a Gravity-CIL circuit at a rate of 2,000 tpd and low-grade mineralized material will be treated via a gravity-flotation circuit at a rate of 2,900 tpd.
Phase 3: The Queensway Mill Gravity-Flotation circuit will be expanded to 5,000 tpd to more rapidly process stockpiled lower grade mineralized materials mined during Phase 1 and Phase 2 while continuing to process OP and UG high-grade mineralized material at 2,000 tpd in the Gravity-CIL circuit, for total processing capacity of the Queensway Mill of 7,000 tpd.
In-Pit Tailings: In-pit tailings deposition will be used throughout all phases of the Project. This approach avoids the need for a conventional above-ground tailings storage facility with perimeter embankment dams and reduces the Project footprint.
Mine Plan and Growth Potential: The current mine plan has outlined production of 1.744 M oz Au over a 15 year mine life. The district-scale land package holds excellent potential to continue to expand the resource base and mine life through ongoing exploration.
Capital Expenditures and Funding: Initial capital expenditures for the Project are $149.8 M and growth capital is $832.1 M. The Company is fully funded for the initial capital expenditures and anticipates cash flows from Phase 1 will fund the growth capital for Phases 2 and 3 at an average gold price of US$3,600/oz.
See Table 1 and Figures 1 to 5 with respect to the PEA and Tables 6 to 11 and Appendix 1 with respect to the MRE.
Table 1: Queensway PEA Financial and Operating Metrics.
| Item | Units | Value |
| Production | ||
| Project life (from start of construction to closure) | years | 17 |
| Mine life | years | 15 |
| Total Potential Mill Feed Tonnage | Mt | 28.3 |
| Average Feed Grade, Au | g/t | 2.09 |
| Mill recoveries (Avg) | % | 91.5 |
| Doré Payable | % | 99.949 |
| Concentrate Payable | % | 87.0 |
| Total Payable Gold (weighted) | % | 97.813 |
| Total Gold Sold | Moz Au | 1.706 |
| Commodity Prices | ||
| Au Average | US$/oz | 3,600 |
| Project Costs (LOM average)1 | ||
| Mining Cost - OP | $/t milled | 29.77 |
| Mining Cost -UG | $/t mined | 171.91 |
| Milling Cost | $/t milled | 26.78 |
| On-Site Crushing Cost | $/t milled | 1.75 |
| Tailings Storage Facility ("TSF") Cost | $/t milled | 0.16 |
| General & Administrative Cost | $/t milled | 2.15 |
| Material Haulage to Pine Cove | $/t milled | 2.38 |
| Water Management Costs | $/t milled | 4.57 |
| Total Cash Cost2, 4 | US$/oz Au | 985 |
| AISC (LOM)3, 4 | US$/oz Au | 1,375 |
| Project Economics | ||
| Gross Revenue | $M | 8,538.6 |
| Total Selling Cost Estimate | $M | 53.9 |
| Effective Royalty Rate | % | 0.42 |
| Total Royalties | $M | 35.8 |
| Total Operating Cost Estimate | $M | 2,245.6 |
| Total Sustaining Capital Cost Estimate | $M | 970.8 |
| Total Growth Capital Cost Estimate | $M | 832.1 |
| Initial Capital Cost Estimate | $M | 149.8 |
| Taxes | $M | 1,700.0 |
| Pre-Tax Cash Flow | $M | 4,250.7 |
| After-Tax Cash Flow | $M | 2,550.6 |
| Pre-Tax Net Present Value @ 5% | $M | 2,972.8 |
| Pre-Tax Internal Rate of Return | % | 204.4% |
| After-Tax Net Present Value @ 5% | $M | 1,727.6 |
| After-Tax Internal Rate of Return | % | 125.8 |
| After-Tax payback period | years | <1 y |
Notes:
1 Total operating costs refer to onsite charges that cover open pit and underground mining, processing and material handling, and onsite general and administrative costs.
2 Cash Cost is calculated as the sum of doré transportation, treatment and refining charges, royalties, and onsite operating costs, divided by the quantity of gold ounces sold.
3 AISC is calculated as the sum of doré transportation, treatment and refining charges, royalties, onsite operating costs, and sustaining capital costs, divided by the quantity of ounces sold.
4 Denotes a "specified financial measure" within the meaning of National Instrument 52-112 - Non-GAAP and Other Financial Measures Disclosure. See note on "Non-IFRS Financial Measures"
Technical Report
The PEA and MRE replace the Company's previous studies completed in 2025 (the 2025 PEA and the "Initial MRE", respectively).
A technical report pertaining to the PEA and MRE (the "Technical Report") prepared by Qualified Persons ("QPs") in accordance with the requirements of National Instrument 43-101 ("NI 43-101") will be filed on the Company's website, under its SEDAR+ profile and on EDGAR (www.sec.gov/edgar) within 45 days of this press release.
The basis for the PEA and the qualifications and assumptions made by the QPs who undertook the PEA are set out in this news release.
The LOM production targets are based on approximately 82% measured and indicated resources and 19% inferred resources; Phase 1 production targets are based on approximately 97% measured and indicated resources and 3% inferred resources. The inferred resources are predominantly scheduled in the latter stages of the mine-life and have had mining factors applied. There is a lower level of geological confidence associated with inferred resources and there is no certainty that further exploration work will result in the determination of indicated resources, or that production metrics itself will be realised. The Company is currently conducting infill drilling focused on the conversion of inferred resources to indicated.
Readers are cautioned that the conclusions, projections and estimates set out in this press release are subject to important qualifications, assumptions and exclusions, all of which will be detailed in the Technical Report. To fully understand the summary information set out in this press release, the Technical Report should be read in its entirety.
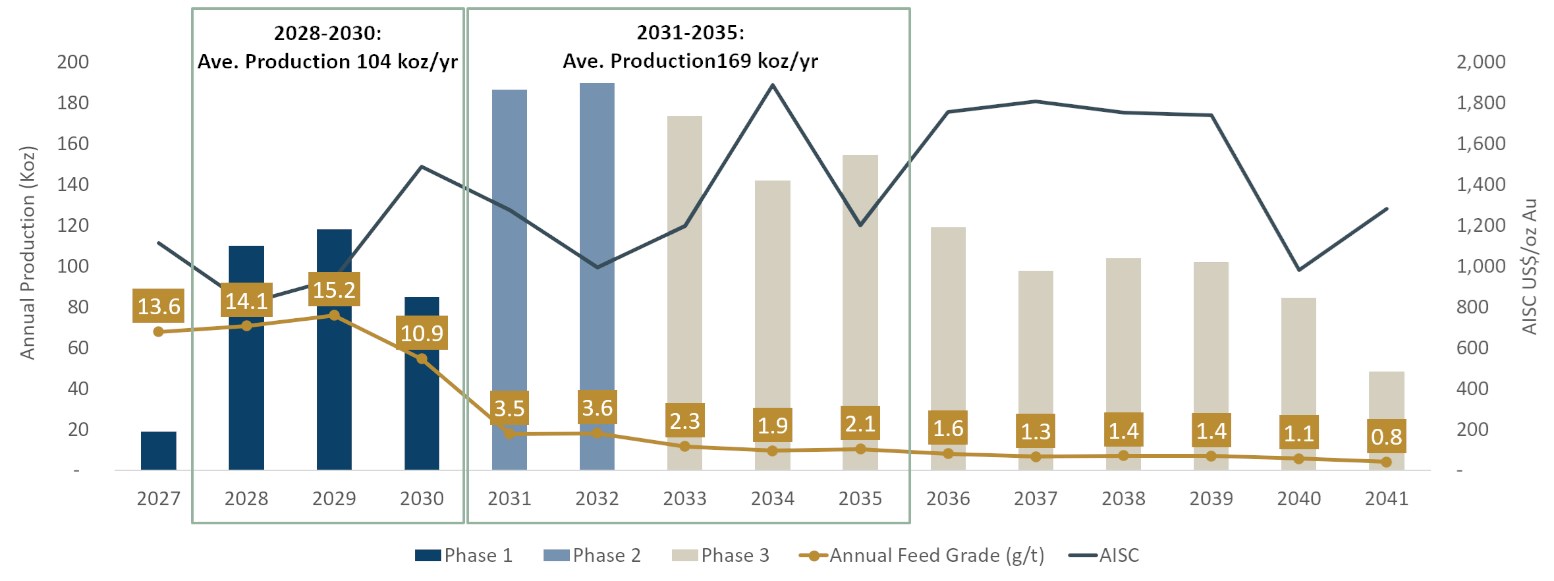
Figure 1: Annual Gold Production, Grade and AISC by Phase.
To view an enhanced version of this graphic, please visit:
https://images.newsfilecorp.com/files/7337/319963_0ce29a3064f12ba8_001full.jpg
Note: AISC is a non-IFRS measure; see notes below for additional information regarding AISC
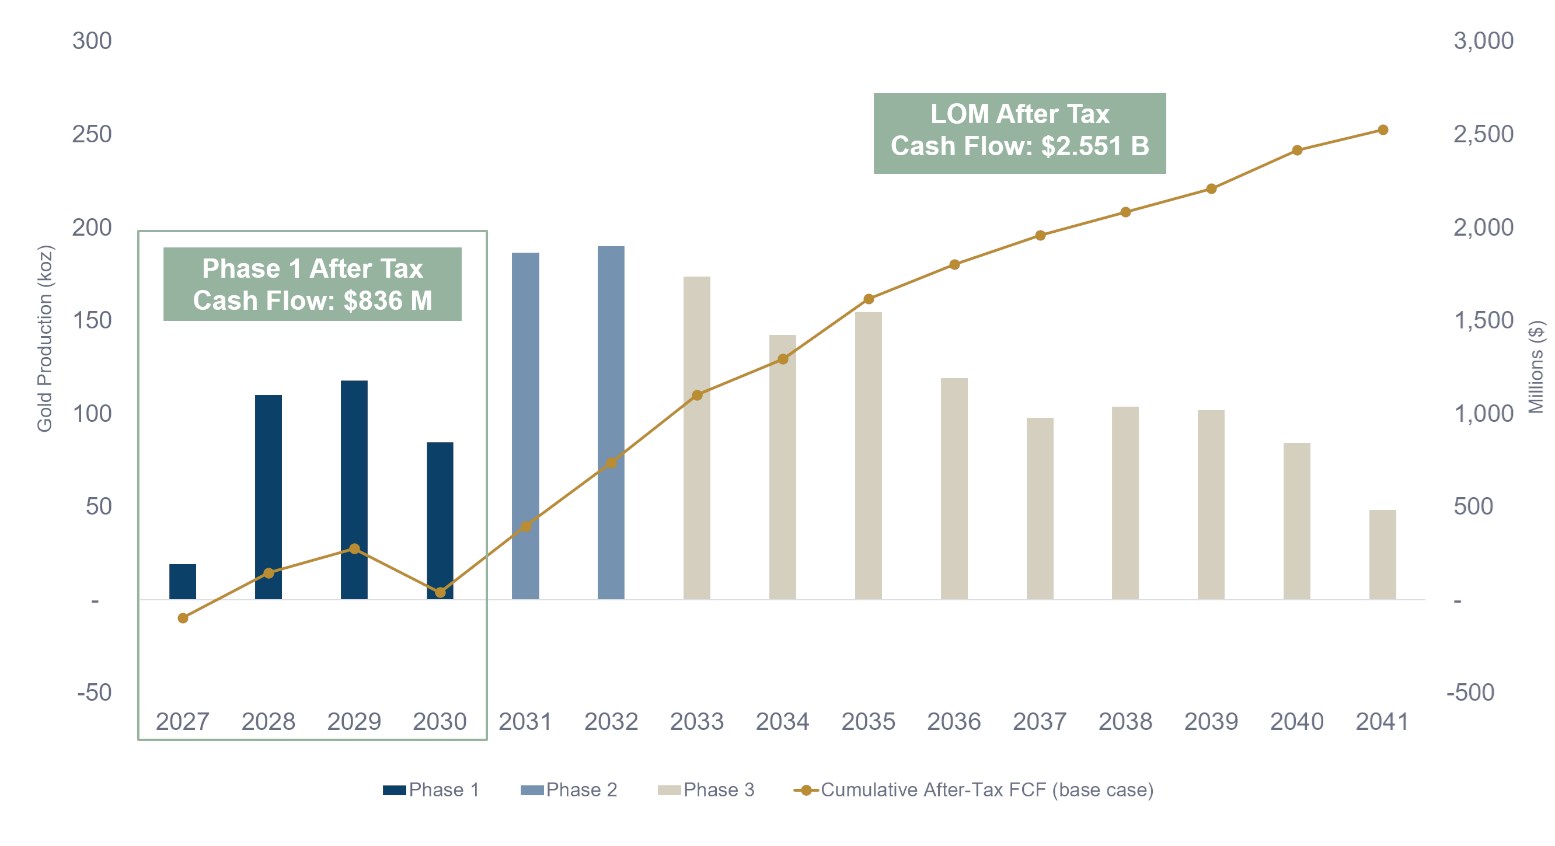
Figure 2: Annual Gold Production and Cumulative Cash Flow.
To view an enhanced version of this graphic, please visit:
https://images.newsfilecorp.com/files/7337/319963_0ce29a3064f12ba8_002full.jpg
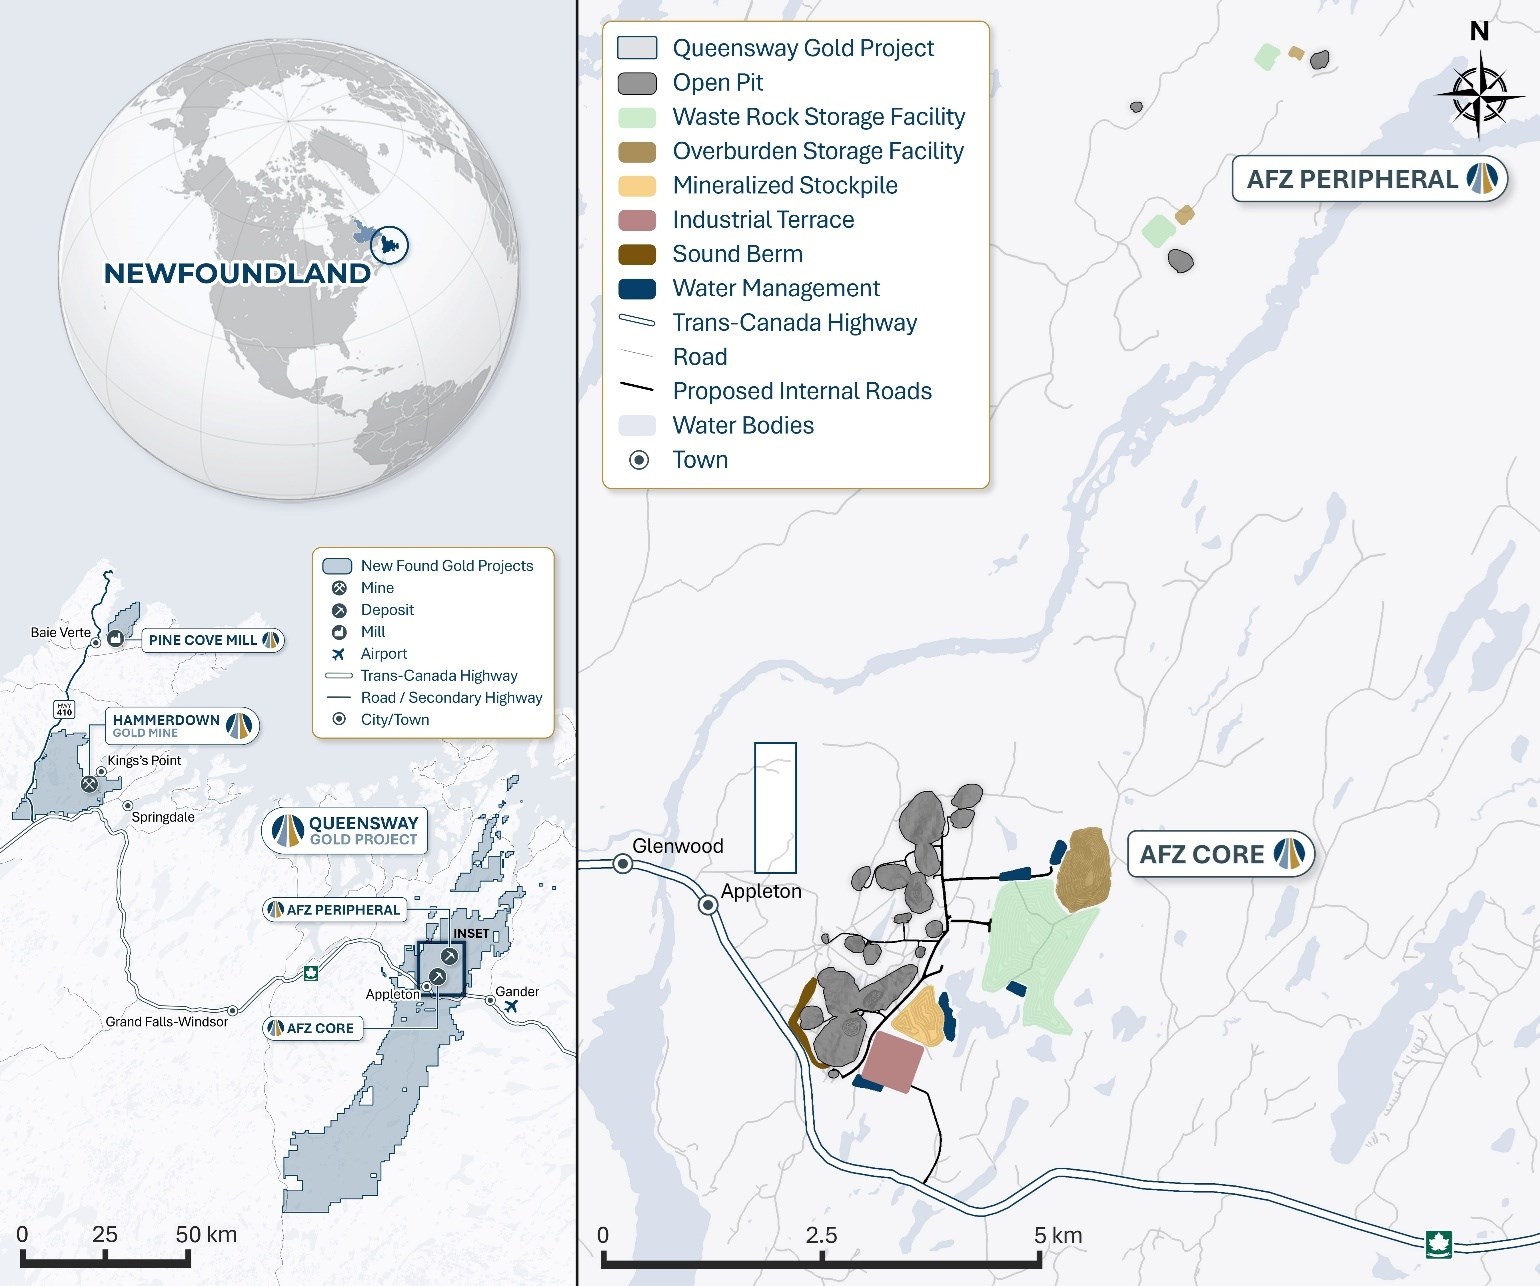
Figure 3: Queensway Location Map.
To view an enhanced version of this graphic, please visit:
https://images.newsfilecorp.com/files/7337/319963_0ce29a3064f12ba8_003full.jpg
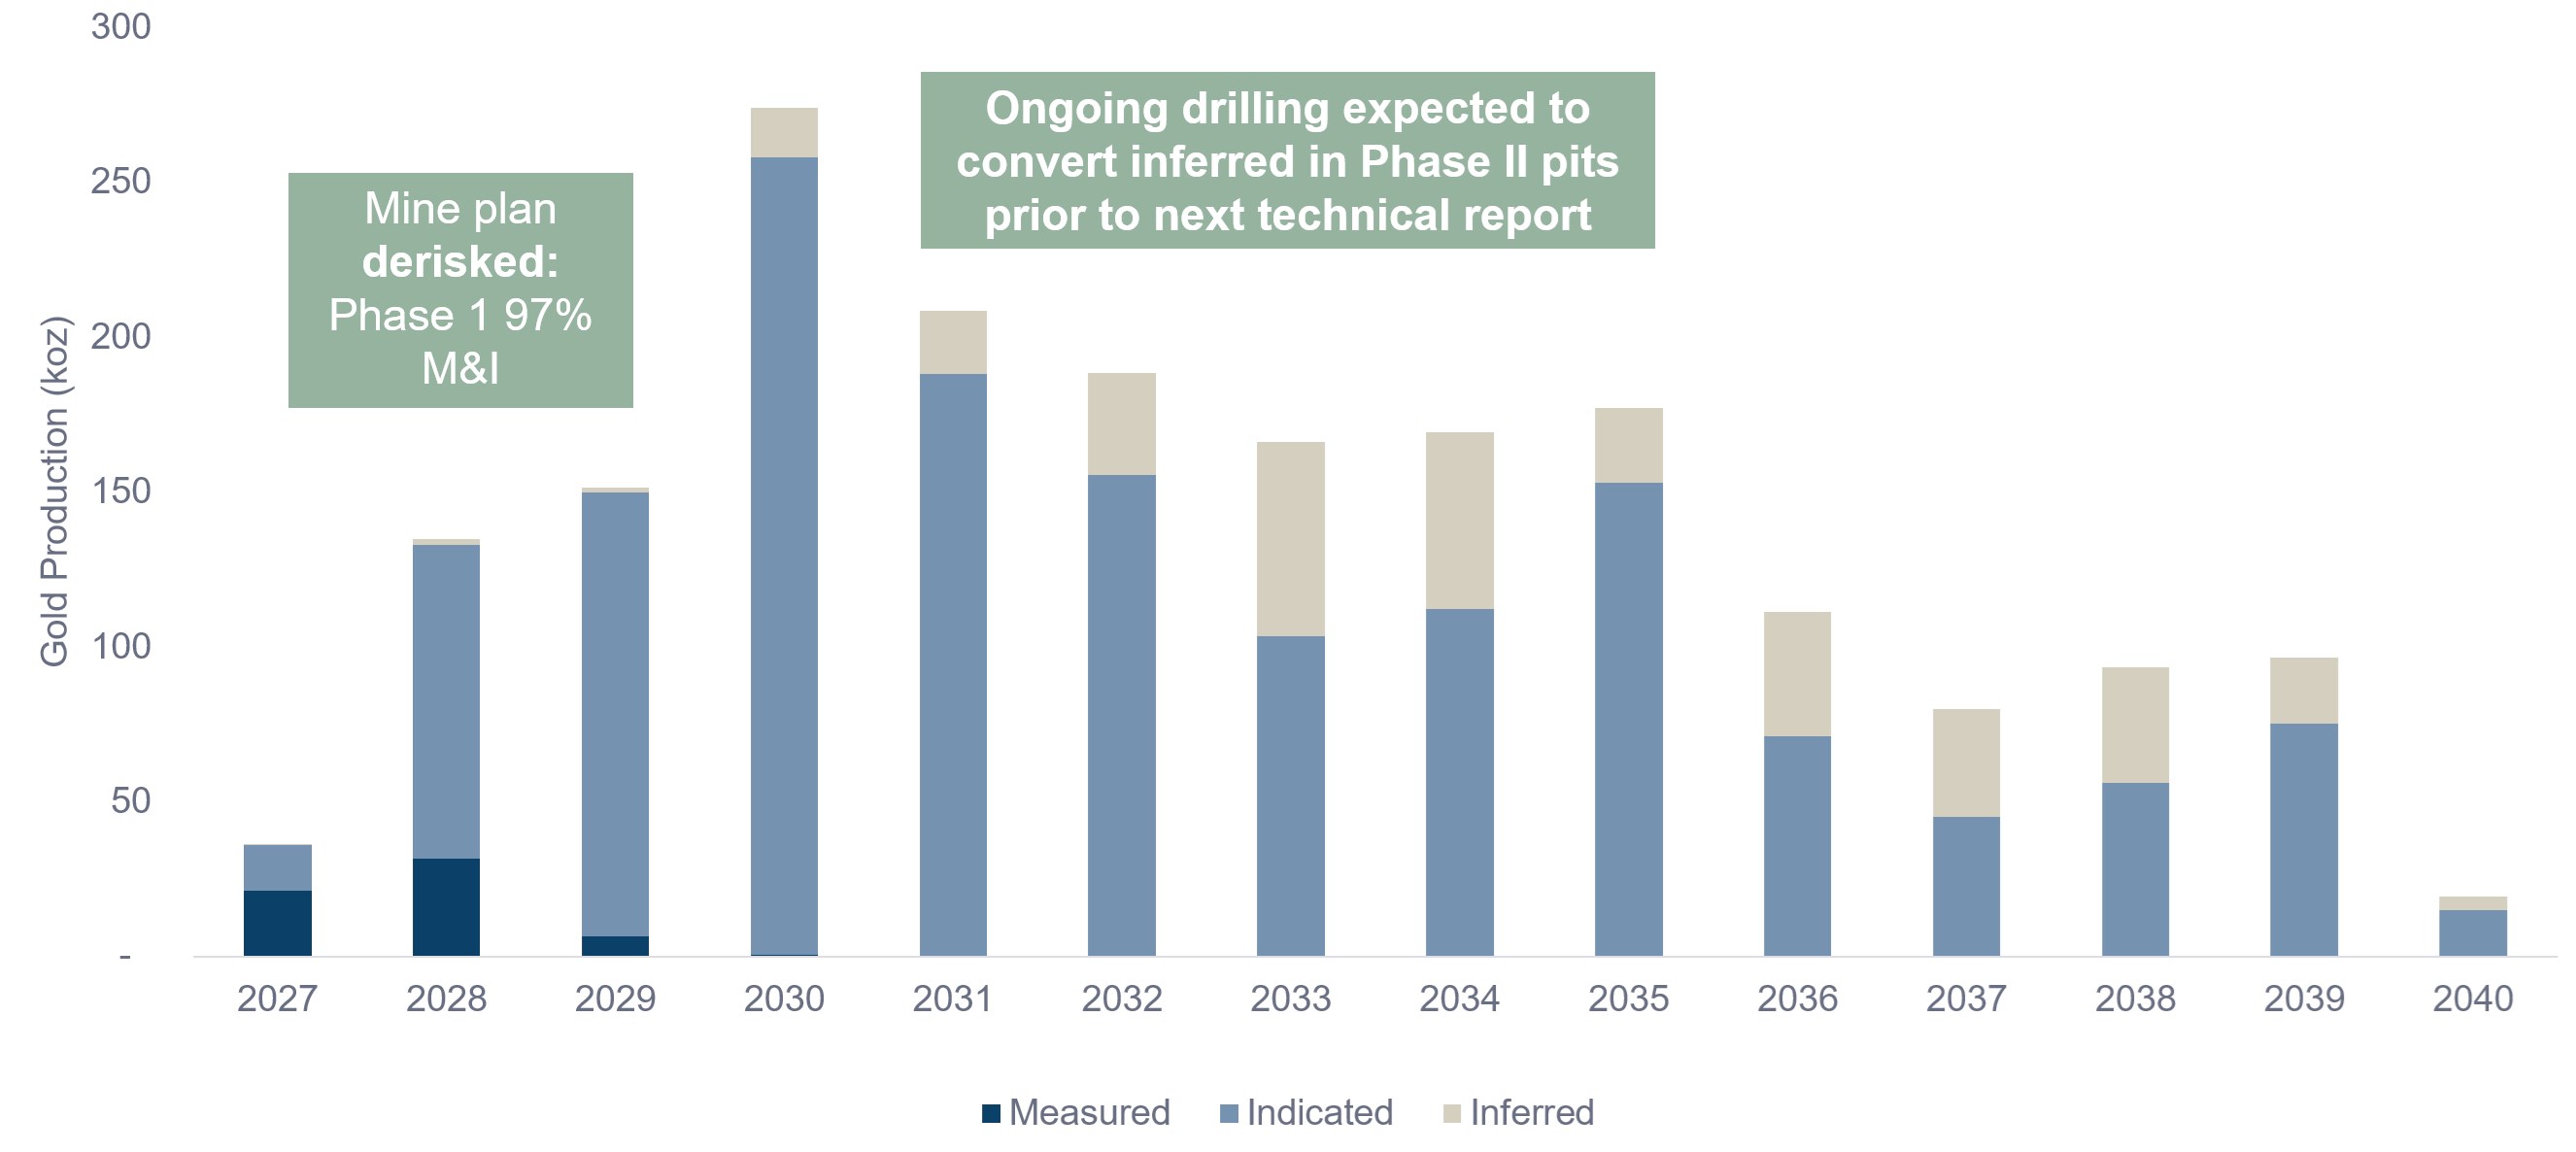
Figure 4. Mined Gold by Mineral Resource Category.
To view an enhanced version of this graphic, please visit:
https://images.newsfilecorp.com/files/7337/319963_0ce29a3064f12ba8_004full.jpg
Mining
The Queensway mine plan envisions both conventional OP truck-and-shovel methods complemented by high-grade UG cut-and-fill mining. The mine schedule was designed to achieve the target processing capacities defined by the different phases of the Project outlined above. The Project considers contractor mining for the first two years of production, with a transition to owner mining over the subsequent two years of operation until the mine is fully operated by an owner-owned fleet.
The OP operation comprises a total of 21 pits. The three principal pits (Iceberg, Keats and Keats West) are sequenced early in the mine life and will subsequently serve as in-pit tailings deposition facilities. The pits will deliver to the mill a total of 26.4 million tonnes ("Mt") of mineralized material at an average diluted gold grade of 1.74 g/t for 1,479 koz of gold, with an overall strip ratio of 6.5:1. The open pit optimization used a 2.5 m x 2.5 m x 2.5 m block model for the Phase 1 pits and a 5.0 m x 5.0 m x 5.0 m block model for the subsequent pits to be mined thereafter to reflect the use of larger equipment and increased production rate. The owner-operated fleet will consist of 64-tonne-class haul trucks and 12 cubic metre ("m³") shovels, selected to minimize dilution and maximize selectivity.
The UG operation will be developed in five zones, accessed from five surface portals, four of which will be collared within the open pits. The primary mining method will be mechanized cut and fill, using a 3 m x 3 m stope size to minimize dilution while maximizing selectivity. Backfill will consist of a combination of rockfill and cemented rockfill. The UG operation will deliver to the mill a total of 1.9 Mt of mineralized material at an average diluted grade of 6.85 g/t for 427 koz Au.
The mining sequence and schedule have been optimized to prioritize higher-grade material being processed early in the mine life. The mine plan has included the segregation of mineralized material by grade bin and a stockpiling strategy to process lower grade material at the end of the mine life. Open pit mining is expected from 2027 until 2040 and will reach a peak mining rate of 53,200 tpd. Underground mining is expected from 2030 until 2039 and will reach a peak mining rate of 800 tpd. The mill feed schedule also includes the processing of low-grade stockpiles until 2042.
Gold ounces included in the mine plan are categorized as being 1% measured, 80% indicated and 19% inferred. The inferred resources are predominantly scheduled in the latter stages of the mine-life. There is a low level of geological confidence associated with inferred resources and there is no certainty that further exploration work will result in the determination of indicated or measured resources. No reserves for the project have been declared at this time.
Processing and Gold Recovery
Phase 1: Off-Site Milling
The PEA envisions treating 256 kt per year (700 tpd) of mineralized material at the existing Pine Cove process plant from 2027 until 2030. High grade material will be crushed at the Queensway site and trucked 275 km to Pine Cove along the Trans-Canada Highway and secondary highway. The current process plant will be converted to a gravity-CIL circuit due to the high gravity recoverable gold and preg-robbing nature of the mineralized material from Queensway. The plant will continue to produce doré with an estimated recovery of 94% which is supported by metallurgical test work.
The Pine Cove upgrade will consist of installing an additional ball mill, adding a gravity concentration circuit, CIL tanks, carbon acid wash and elution circuit, carbon regeneration and handling, new gold room, new reagent make-up systems and an oxygen plant. The existing flotation, leach tanks, drum filters and Merrill Crowe circuit will be decommissioned. CIL tailings will be detoxified prior to storage in the existing in-pit tailings storage facility. Plant modifications have been accounted for in the Phase 1 PEA initial capital cost estimate.
Phases 2 & 3: On-Site Milling and In-Pit Tailings Deposition
An on-site greenfield process plant will be constructed at Queensway and will consist of two treatment circuits, a 2,000 tpd gravity-CIL circuit and 2,900 tpd gravity-flotation circuit. The gravity-CIL circuit will treat high grade mineralized material and the gravity-flotation circuit will treat refractory low grade mineralized material, with both circuits commencing operation in 2031. The gravity-flotation circuit will be expanded to treat 5,000 tpd of mineralized material from 2033 (Phase 3) while the 2,000 tpd gravity-CIL plant will continue to operate.
The Queensway Mill comprises a three-stage crushing plant that will campaign crush ore for either the CIL or flotation circuits. The flotation circuit will consist of a single stage ball mill grinding circuit, gravity concentration, rougher and cleaner sulphide flotation, concentrate dewatering and loadout. The CIL circuit will consist of a single stage ball mill grinding circuit, gravity concentration, preleach thickening, CIL tankage, carbon acid wash and elution circuit, carbon regeneration and handling circuit, and CIL tailings detoxification. The Queensway Mill will have a gold room consisting of electrowinning cells and furnace. Doré will be produced from the gravity circuits and CIL circuit, and salable gold concentrate will be produced from the flotation circuit. The process plant will include reagent make-up systems, oxygen and air services, and water services to support the two treatment circuits. Detoxified CIL tailings will be pumped to the in-pit tailings storage facilities, while flotation tailings will be thickened prior to deposition within the in-pit tailings storage facilities.
The gold recovery is estimated to be 92% at the gravity-CIL circuit and 88% at the gravity-flotation circuit and is supported by metallurgical test work.
Over the LOM, 85% of the gold will report to doré and 15% will report to gold concentrate.
The capital cost estimate for the Queensway process plant and associated plant infrastructure has been accounted for in the Phase 2 and 3 growth capital cost estimates.
On-Site Infrastructure
Queensway Infrastructure
Gander, NL is the primary regional service centre for Queensway. Located approximately 15 km east of the Project site via the Trans-Canada Highway, Gander provides commercial services, accommodations, equipment suppliers, maintenance facilities, an international airport, and a skilled labour force. Additional support is available from the nearby communities of Appleton and Glenwood, with supplemental workforce resources available from Grand Falls-Windsor and surrounding communities.
The Queensway site infrastructure is planned as a conventional owner-operated open-pit mine complex with on-site processing, including administration and dry facilities, maintenance shops and warehouse, fuel and explosives storage, utilities, security infrastructure, stockpiles, water/sewage systems, and supporting roads and power distribution.
Phase 1: Pine Cove and In-Pit Tailings Deposition
The Town of Baie Verte serves as the primary regional service centre for Pine Cove and provides access to a regional hospital, accommodations, restaurants, banking services, vehicle maintenance, and heavy-equipment suppliers. Baie Verte and surrounding communities supply a well trained and experienced workforce with direct familiarity in mining and industrial operations. The site is connected to the provincial power grid and is equipped with limited backup power generation for essential services. The Pine Cove site also includes the Port Rousse deep-water port facility, capable of berthing Panamax-class vessels and supporting the shipment of ores, aggregates, concentrates, and providing direct marine access for bulk materials and equipment.
Existing civil infrastructure on site includes main offices, a mill building, a maintenance shop, storage and warehouses, dry facilities, and contractor facilities. Phase 1 tailings will be stored in an existing permitted in-pit tailings storage facility which will support initial operations and can be expanded for additional storage as required. Water management infrastructure includes two existing historic tailings facilities and a polishing pond.
Phases 2 and 3: In-Pit Tailings Deposition
During Phases 2 and 3, tailings generated from on-site processing at Queensway are planned to be stored within mined-out open pits using an in-pit tailings storage facility. The conceptual design utilizes the Iceberg, Keats, and Keats West pits and is expected to accommodate approximately 28.8 Mt of tailings over the life of the Project.
Water Management
The Project incorporates an integrated water management system designed to collect, treat, reuse, and responsibly discharge site water throughout mining and processing operations. The conceptual design includes contact water collection and treatment infrastructure, diversion of non-contact water, and reclaim water recovery from the TSF to support future processing operations. Construction of a water settling pond and water treatment plant are scheduled as part of the early works prior to production.
Sound Attenuation Berm
The Project design incorporates a conceptual 10 m-high sound attenuation berm to reduce noise propagation toward nearby receptors in the town of Appleton. The berm was incorporated into the Project's acoustic modelling and forms part of the overall environmental mitigation strategy assessed for the Project. Construction of the berm is scheduled to commence as part of the early works prior to production.
Capital and Operating Costs
Phase 1 initial capital cost of $149.8 M will support a 700 tpd mine with off-site milling. The on-site capital costs include all site clearing and road construction, waste dump, stockpile pads, sound berm, water management, building and maintenance facilities. The on-site infrastructure includes the power installation, water supply and water treatment and temporary crushing facilities. The off-site infrastructure includes the Trans-Canada Highway modifications, a new access route to the site and an allowance for Bell Fibre Optic line relocation.
Phase 2 growth capital of $645.8 M is related to the new 4,900 tpd Queensway Mill, a permanent crushing plant, preparation of the Iceberg OP for in-pit tailings deposition and underground mine development and includes initial capital development, mobile and fixed plant equipment purchases.
Phase 3 growth capital of $186.3 M is related to a $105.4 M expansion of the on-site processing plant to 7,000 tpd and ramp access development for accessing the fourth underground deposit.
The sustaining capital costs of $970.8 M include capitalized stripping for the open pit mining, the ongoing capital development for the UG mine, UG fleet purchases and lease payments for the OP equipment, allowances for tailings infrastructure expansion and relocation and reclamation and closure costs.
Operating costs are developed from first principles based on recent precedent projects with similar mining methodologies and location (Tables 2 to 4). Refining and transporting costs are all inclusive of concentrate and doré costs, penalties and charges. Royalties assume 0.42% on the net smelter return.
Table 2: Capital Cost Summary.
| Phase 1 ($M) | Phase 2 ($M) | Phase 3 ($M) | Sustaining Capital ($M) | Total ($M) | |
| Mining | 0.0 | 130.3 | 80.6 | 815.6 | 1,026.5 |
| Offsite Processing | 75.0 | 0.0 | 0.0 | 0.0 | 75.0 |
| Onsite Processing | 0.0 | 194.7 | 50.6 | 0.0 | 245.3 |
| Onsite Infrastructure | 15.6 | 56.9 | 0.0 | 111.0 | 183.5 |
| Offsite Infrastructure | 4.8 | 8.7 | 0.0 | 0.0 | 13.5 |
| Indirects/Owner's Costs/EPCM | 36.0 | 128.4 | 28.5 | 8.5 | 201.4 |
| Contingency | 18.4 | 126.8 | 26.6 | 35.7 | 207.5 |
| Total | 149.8 | 645.8 | 186.3 | 970.8 | 1,952.7 |
Table 3: LOM Operating Cost and AISC.
| LOM Operating Costs | Unit | Value |
| Mining (OP) | $M | 842.6 |
| Mining (UG) | $M | 333.4 |
| Off-Site Milling | $M | 50.1 |
| On-Site Milling | $M | 761.8 |
| Material Handling | $M | 67.3 |
| G&A | $M | 190.3 |
| Total LOM Operating Costs | $M | 2,245.6 |
| Doré transport and refining charges | $M | 13.0 |
| Concentrate transport charges | $M | 29.5 |
| Concentrate treatment and refining charges | $M | 11.4 |
| Penalties | $M | 0.0 |
| Royalty NSR | $M | 35.8 |
| Total Cash Cost | US$/oz sold | 985 |
| AISC (LOM) | US$/oz sold | 1,375 |
| AISC (Years 2027-2030) | US$/oz sold | 1,129 |
| AISC (Years 2031-2035) | US$/oz sold | 1,408 |
Table 4: Unit Operating Cost.
| Unit Operating Costs (LOM) | Unit | Value |
| Mining | $/t processed | 41.55 |
| Processing | $/t processed | 31.07 |
| G&A | $/t processed | 6.71 |
| Total | $/t processed | 79.33 |
| OP Mining Cost | $/t mined1 | 5.27 |
| UG Mining Cost | $/t mined2 | 171.91 |
1 Open pit mined tonnes pertain to all open pit material mined including overburden, waste, and millable mineral
2 Underground mined tonnes pertain to underground millable mineral only and do not include mined waste
Economic Analysis
At a base case consensus long-term gold price of US$3,600/oz and an exchange rate of 1.39 (C$:US$) the Project generates an after-tax NPV5% of $1.728 B and an IRR of 126%. Growth Capital of $645.8 M for Phase 2 is spent in 2028 to 2029 and is fully funded by Phase 1 cashflows. Similarly, Growth Capital of $186.3 M for Phase 3 is spent in year 2030 to 2031 and is fully funded by Phase 2 cashflows. Sensitivity analysis shows the after-tax NPV5% increases to $2,225 million and the IRR increases to 164% when the gold price is raised to US$4,100/oz Au.
Using the base case gold price of US$3,600/oz, the average annual after-tax cash flow is $170 M and the cumulative LOM after-tax cash flow is estimated at $2,551 M (Table 5). The Phase 1 average annual after-tax operating cash flow is $279 M, demonstrating the ability to pay back the initial capital of $149.8 million in less than a year. The Company plans to reinvest the after-tax cash flow generated in Phases 1 and 2 to fund the Project growth capital needed in Phases 2 and 3, respectively.
The Project is subject to three levels of taxation:
Federal corporate income tax (15% of corporate taxable income),
Provincial corporate income tax in the relevant provinces of operation, including Newfoundland and Labrador (15%) and Ontario (11.5%), as applicable, and
Newfoundland and Labrador mining tax (approximately 16% of net mining profits), where applicable.
At the base case, the effective tax rate for the Project is approximately 40%.
The Company, in conjunction with its independent tax advisors, has commenced a preliminary assessment of government initiatives and tax credits that may be available for the Project.
On September 15, 2026, the Canadian government announced the introduction of a new productivity mega deduction for capital investments. In broad terms, the productivity mega deduction builds on existing and previously announced accelerated capital cost allowance measures and resource deductions by extending immediate expensing to a broader range of capital assets and making the immediate deduction available on a permanent basis, effective for property acquired after September 14, 2026. The mega productivity deduction also allows for an immediate deduction of certain resource expenses. Specifically, a taxpayer may be allowed an immediate deduction for any cost or expenses incurred during a taxation year that qualifies as an immediate Canadian development expense. To qualify, the cost or expense must be incurred after September 14, 2026 and must otherwise qualify as a Canadian development expense at the time it is incurred. If the proposed new productivity mega deduction is enacted and available to Queensway as assumed, total tax payments over the LOM remain substantially the same. While the aggregate tax burden over the LOM remains broadly consistent with the productivity mega deduction, the proposed measure accelerates the availability of tax deductions, resulting in lower income tax payments during the early years of the Project and a deferral of tax payments to later periods.
Based on preliminary assessment of the proposed productivity-enhancing deduction tax rules in Canada, the Company may realize an increase in NAV between $60 and $70 M over LOM. Currently, the impact of proposed productivity-enhancing-deduction rules does not appear to be material to Queensway and has not influenced any changes to the Company's strategy or plan with respect to the Project.
Table 5: Gold Price Sensitivity Analysis.
| Gold Price (US$) | 3,100 | 3,240 | 3,600 | 3,960 | 4,100 |
| After-Tax Cashflow ($) | 1,852 | 2,048 | 2,551 | 3,053 | 3,248 |
| After-Tax NPV5% ($) | 1,230 | 1,370 | 1,728 | 2,086 | 2,225 |
| IRR (%) | 87 | 98 | 126 | 153 | 164 |
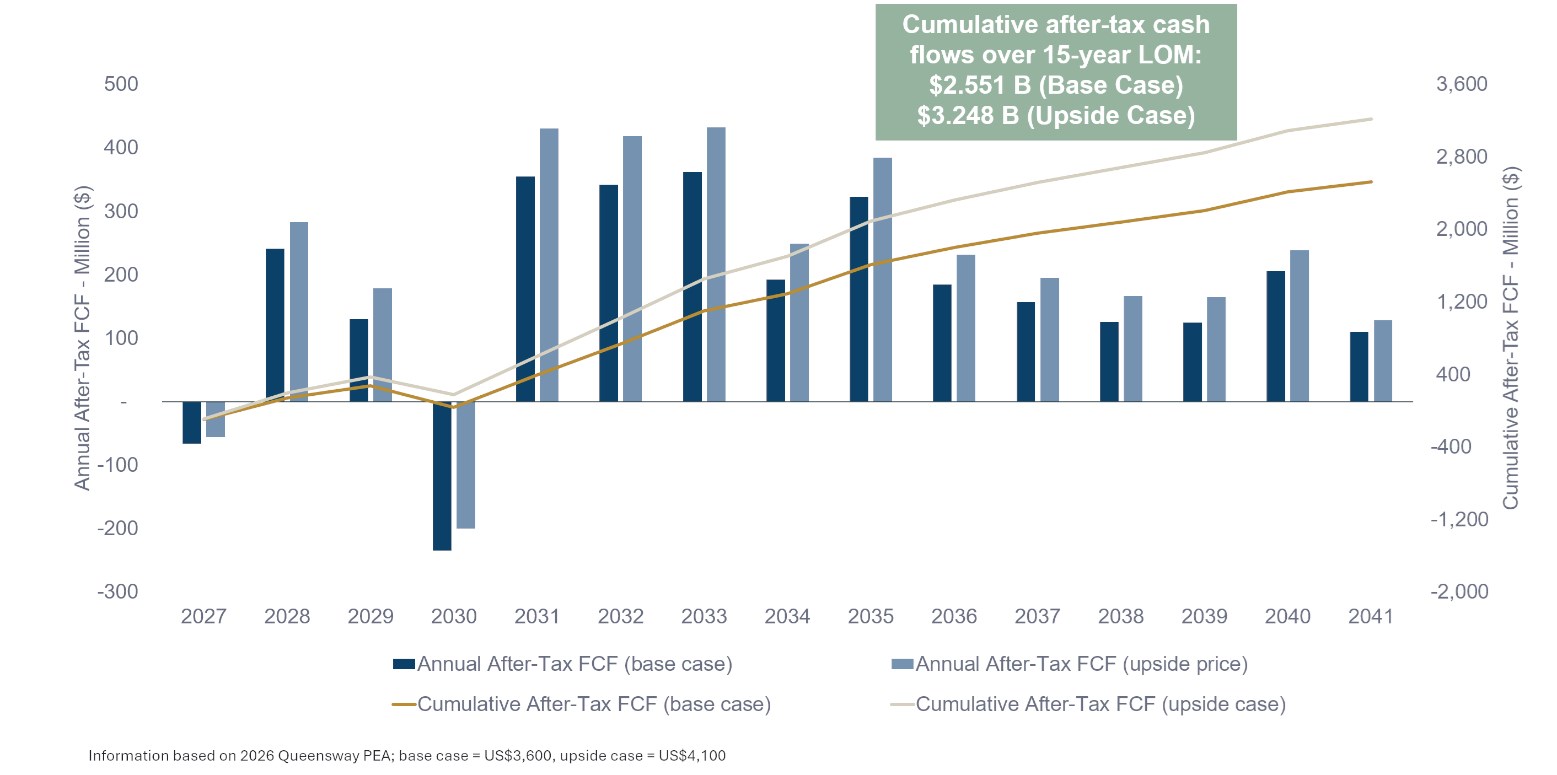
Figure 5: After-Tax Free Cash Flow (Base Case/Upside Case).
To view an enhanced version of this graphic, please visit:
https://images.newsfilecorp.com/files/7337/319963_0ce29a3064f12ba8_005full.jpg
MRE Update Overview and Resource Growth
Combined OP and UG Measured and Indicated Mineral Resources ("M&I") total 27.3 Mt at an average gold grade of 2.19 g/t Au for 1.92 million contained ounces of gold. Inferred Mineral Resources total 12.5 Mt at an average grade of 1.51 g/t Au for 0.61 million ounces of gold. The open pit Mineral Resource is reported within an optimized pit shell with a cut-off grade of 0.30 g/t Au. The underground mineral resource is reported within optimized mineable shapes generated at a cut-off grade of 1.90 g/t Au, with all material within the mineable shapes reported (Table 6). The updated MRE has an effective date of July 6, 2026. MRE by areas (AFZ Core, AFZ Peripheral and JBP) are presented in Tables 7 to 9. A global table broken down by major contributors to the MRE is presented in Appendix 1.
The OP M&I Mineral Resources total 26.8 Mt grading 2.13 g/t Au containing 1.84 million ounces Au and Inferred Mineral Resources total 11.0 Mt grading 1.17 g/t Au containing 0.41 million ounces Au.
The UG Indicated Mineral Resources total 0.51 Mt grading 4.89 g/t Au containing 0.08 million ounces Au and Inferred Mineral Resources total 1.43 Mt grading 4.17 g/t Au containing 0.19 million ounces Au.
Overall, the MRE returned a 38% increase in contained gold in the Measured and Indicated Mineral Resources while the contained gold in the Inferred Mineral Resource remained constant (Table 10).
Updated pit optimizations, which occurs in the OP portion of the Mineral Resource, along with the addition of the Dropkick zone to the MRE account for most of the resource growth. Drilling completed since the November 1, 2024 database cutoff for the Initial MRE and an updated geological model, based on new drilling and excavations, accounts for approximately 20% of the global open pit mineral resource variance. New infill drilling has confirmed the Inferred Mineral Resources, but at slightly lower grades and higher tonnages.
Table 6: Queensway global in-pit and underground updated MRE (AFZ Core, AFZ Peripheral and JBP; effective date July 6, 2026).
| Queensway Updated MRE (AFZ Core, AFZ Peripheral and JBP) | |||
| Category | Tonnage (kt) | Grade (g/t Au) | Gold Content (koz Au) |
| Open Pit (0.30 g/t cut-off grade) | |||
| Measured | 259 | 7.28 | 61 |
| Indicated | 26,557 | 2.08 | 1,780 |
| M&I | 26,816 | 2.13 | 1,840 |
| Inferred | 11,044 | 1.17 | 414 |
| Underground (1.90 g/t cut-off grade) | |||
| Measured | 0 | - | 0 |
| Indicated | 509 | 4.89 | 80 |
| M&I | 509 | 4.89 | 80 |
| Inferred | 1,427 | 4.17 | 191 |
| Total Open Pit and Underground | |||
| Measured | 259 | 7.28 | 61 |
| Indicated | 27,066 | 2.14 | 1,860 |
| M&I | 27,325 | 2.19 | 1,920 |
| Inferred | 12,471 | 1.51 | 606 |
Notes:
- Mineral resources completed by Christian Beaulieu, P.Geo., of Mineralis Consulting Services inc., an independent qualified person as defined by NI 43-101
- The Mineral Resources described above have been prepared in accordance with the CIM Standards (Canadian Institute of Mining, Metallurgy and Petroleum, 2014).
- The effective date of the mineral resource estimate is July 6, 2026, with a database cut-off date of February 28, 2026.
- A cut-off of 0.30 g/t Au is used to report open pit Mineral Resources, and a cut-off of 1.90 g/t Au is used to report underground Mineral Resources.
- The Queensway deposits have been classified as Measured, Indicated and Inferred Mineral Resources according to drill spacing and confidence in the geological models.
- Bulk density was assigned based on bulk density measurements and the proportions of veining and host lithologies, with average values ranging from 2.68 to 2.71 g/cm3 in the mineralized wireframes.
- The MRE is based on a regularized model with a block size of 2.5 m x 2.5 m x 2.5 m.
The open pit MRE is reported within an optimized pit shell, and the underground MRE is reported within optimized stopes. No mining dilution or losses are assumed; however, must-take material is accounted for in underground mineable shapes.
Open pit and underground optimization and cut-off grade are assuming a gold price of US$ 4,000/oz, a CAD/USD exchange rate of 1.38, mill recoveries of 88% for open pit and 92% for underground and total mineralized material-based costs of 33.25CAD/t milled for open pit and 298.25CAD/t milled for underground
Tonnage has been expressed in the metric system, and gold metal content has been expressed in troy ounces. The tonnages have been rounded to the nearest 1,000 tons, and the metal content has been rounded to the nearest 1,000 ounces. Totals may not add up due to rounding errors.
These Mineral Resources are not mineral reserves as they have not demonstrated economic viability. The quantity and grade of reported Inferred Mineral Resources are uncertain in nature and there has been insufficient exploration to define these resources as indicated or measured. The QP responsible for Mineral Resources is not aware of any environmental, permitting, legal, title, taxation, socio-economic, marketing, political, or other relevant considerations that could materially influence the Mineral Resource estimate.
Table 7: AFZ Core in-pit and underground updated MRE (effective date July 6, 2026).
| Queensway Updated MRE (AFZ Core) | |||
| Category | Tonnage (kt) | Grade (g/t Au) | Gold Content (koz Au) |
| Open Pit (0.30 g/t cut-off grade) | |||
| Measured | 259 | 7.28 | 61 |
| Indicated | 24,469 | 2.11 | 1,661 |
| M&I | 24,727 | 2.17 | 1,721 |
| Inferred | 7,573 | 1.02 | 249 |
| Underground (1.90 g/t cut-off grade) | |||
| Measured | - | - | - |
| Indicated | 353 | 4.82 | 55 |
| M&I | 353 | 4.82 | 55 |
| Inferred | 1,040 | 4.05 | 136 |
| Total Open Pit and Underground | |||
| Measured | 259 | 7.28 | 61 |
| Indicated | 24,822 | 2.15 | 1,715 |
| M&I | 25,081 | 2.20 | 1,776 |
| Inferred | 8,613 | 1.39 | 384 |
Notes: See notes for Table 6.
Table 8: AFZ Peripheral in-pit and underground updated MRE (effective date July 6, 2026).
| Queensway Updated MRE (AFZ Peripheral) | |||
| Category | Tonnage (kt) | Grade (g/t Au) | Gold Content (koz Au) |
| Open Pit (0.30 g/t cut-off grade) | |||
| Measured | 0 | - | 0 |
| Indicated | 1,972 | 1.79 | 114 |
| M&I | 1,972 | 1.79 | 114 |
| Inferred | 3,038 | 1.50 | 147 |
| Underground (1.90 g/t cut-off grade) | |||
| Measured | - | - | - |
| Indicated | 132 | 5.28 | 22 |
| M&I | 132 | 5.28 | 22 |
| Inferred | 274 | 5.24 | 46 |
| Total Open Pit and Underground | |||
| Measured | 0 | - | 0 |
| Indicated | 2,104 | 2.01 | 136 |
| M&I | 2,104 | 2.01 | 136 |
| Inferred | 3,312 | 1.81 | 193 |
Notes: See notes for Table 6.
Table 9: JBP in-pit and underground updated MRE (effective date July 6, 2026).
| Queensway Updated MRE (JBP) | |||
| Category | Tonnage (kt) | Grade (g/t Au) | Gold Content (koz Au) |
| Open Pit (0.30 g/t cut-off grade) | |||
| Measured | 0 | - | 0 |
| Indicated | 116 | 1.37 | 5 |
| M&I | 116 | 1.37 | 5 |
| Inferred | 433 | 1.37 | 19 |
| Underground (1.90 g/t cut-off grade) | |||
| Measured | 0 | - | 0 |
| Indicated | 24 | 3.85 | 3 |
| M&I | 24 | 3.85 | 3 |
| Inferred | 113 | 2.64 | 10 |
| Total Open Pit and Underground | |||
| Measured | - | - | - |
| Indicated | 140 | 1.80 | 8 |
| M&I | 140 | 1.80 | 8 |
| Inferred | 546 | 1.64 | 29 |
Notes: See notes for Table 6.
Table 10: Variance combined OP and UG of tonnes, grade and contained gold from the 2025 MRE to the updated MRE.
| 2025 MRE to updated MRE Variance | ||||||
| Category | Difference | % Difference | ||||
| Tonnage (Mt) | Grade (g/t Au) | Contained Gold (Moz Au) | Tonnage | Grade | Contained Gold | |
| Measured | 0.26 | 7.28 | 0.06 | - | - | - |
| Indicated | 9.03 | -0.26 | 0.47 | 50% | -11% | 34% |
| M&I | 9.29 | -0.21 | 0.53 | 51% | -9% | 38% |
| Inferred | 1.76 | -0.26 | -0.002 | 16% | -15% | 0% |
The Mineral Resource database was closed on February 28, 2026 and contains 3,884 drill holes and trenches for a total of 808,222 m, for which 623,616 m have assay intervals (727,086 total assays). This represents an increase of 670 drill holes and trenches, 84,845 m and 87,445 assay intervals relative to the Initial MRE (see New Found Gold news release dated March 24, 2025).
The Project's camp-scale exploration potential is supported by an extensive land package that encompasses over 110 km of strike along the Appleton Fault Zone ("AFZ") and JBP Fault Zone ("JBPFZ"), both of which have demonstrated a spatial relationship to known gold discoveries. To date, most exploration drilling has focused on a 5 km segment of the AFZ Core area and has largely been limited to the upper 250 m, while the Company controls approximately 110 km of strike extent along the AFZ and JBPFZ on the Property. Queensway therefore offers excellent potential to expand known discoveries at depth within the AFZ Core, identify new near-surface discoveries along strike, and advance existing targets and identify new targets property-wide. The identification of gold mineralization in a variety of lithological and structural settings further demonstrates the district-scale potential of Queensway, supported by the scale and continuity of the mineralized system, the number of vein zones defined to date, and the substantial untested ground along key structures. Several targets remain untested, and mineralized zones remain open along strike and at depth, warranting follow-up drill testing in future programs.
MRE Conversion to Mine Plan
The mine plan shows an overall inclusion rate of 82% of M&I and 56% of inferred gold ounces versus the MRE. Furthermore, the mine plan considers ounces that are 82% in the M&I category and 18% in the inferred category. Gold mined in Phase 1 is of high confidence due to the Keats, and Iceberg deposits being mined in that period, with 97% of the ounces being in the M&I category. The Dropkick deposit was newly incorporated in the mine plan and has shown an inclusion rate of 91% of M&I and 61% of inferred gold ounces versus the MRE, which provides justification for further exploration of this deposit. A conversion drilling program has been developed which the Company expects will enhance the resource confidence of the inferred ounces currently considered in the mine plan.
Grade Control Drilling Conversion
The grade control ("GC") drilling completed in 2025 at Keats and Iceberg generally confirmed the continuity and grade of the Initial MRE of the high-grade core. Table 11 shows that the GC drilling confirmed the overall tonnage, grade and ounces for a comparable volume in the Initial MRE. The capping values used in the MRE are similar to those used in the Initial MRE. The difference between capped and uncapped estimates is approximately 17 koz Au for Keats.
Table 11: Variance combined OP and UG of tonnes, grade and contained gold from the Initial MRE to the updated MRE.
| Comparison of Indicated Resources 2025 and Measured Resources 2026 | |||
| Category | Tonnage (kt) | Grade (g/t Au) | Gold Content (koz Au) |
| (0.30 g/t cut-off grade) | |||
| Indicated (Initial MRE) | 219.2 | 8.11 | 57.2 |
| Measured (MRE)* | 220.2 | 8.19 | 57.9 |
| Variance | 1.0 | 0.08 | 0.7 |
| (3.0 g/t cut-off grade) | |||
| Indicated (Initial MRE) | 94.3 | 17.25 | 52.3 |
| Measured (MRE)1 | 93.7 | 17.64 | 53.2 |
| Variance | -0.6 | 0.39 | 0.9 |
1Measured MRE number also includes 2,652 oz of indicated material for comparison.
Environment and Permitting
The Queensway Phase I Environmental Registration ("ER") was submitted to the Newfoundland and Labrador Department of Environment, Conservation and Climate Change on April 30, 2026 and registered on May 7, 2026, commencing the provincial environmental assessment ("EA") process under the Newfoundland and Labrador Environmental Protection Act. By a decision letter dated July 3, 2026 (the "Decision Letter"), the Minister of Environment, Conservation and Climate Change (the "Minister") notified the Company that an Environmental Preview Report ("EPR") is required for Queensway Phase I, following review of the Queensway ER submitted on April 30, 2026.
On September 2, 2026, the Company received EPR Guidelines from the Minister and is advancing preparation of the EPR, with a target submission date of Q4/26. Upon submission, the EPR will be subject to a 35-day review by the Environmental Assessment Committee and the public. Under provincial legislation, a decision on the EPR will be provided within 45 days of submission; with the potential for the Minister to request a fourteen-day extension.
Following release from the EA process, the Project is expected to require a range of provincial and federal permits and approvals typical of mine development projects in NL including, but not limited to, approvals related to water management, fish and fish habitat protection, air emissions and effluent discharge, mine rehabilitation and closure, and construction and operation of mine infrastructure. Subsequent to release from the EA process, the Company will work with the province to obtain a Surface and Mining Lease as part of the permitting process.
The current EA process applies to the Keats, Iceberg, Dome and Jackpot open pits of the Project. Future open pits, underground works and phases, including expansion of processing capacity and development of additional deposits, would be subject to their own environmental assessment, permitting, and regulatory approval processes.
The Project has been designed with consideration for progressive reclamation and eventual closure. Closure planning will continue to evolve through future engineering, environmental, permitting, and closure studies and will include reclamation of disturbed areas, decommissioning of infrastructure, and long-term environmental management measures in accordance with applicable regulatory requirements.
Workforce and Community Benefits
The Project is located near the communities of Appleton, Glenwood, and Gander and plans to draw upon the skilled workforce, contractors, and service providers available in central Newfoundland. As the Project advances, New Found Gold expects to create employment and procurement opportunities within NL and will continue to engage local communities, Indigenous groups, businesses, and government agencies.
Over the LOM, a total of 530 new jobs are expected to be created in central Newfoundland, including 410 jobs at the Queensway mining operations and 120 jobs at the Queensway Mill.
Data Verification
The data used in the MRE is supported by Quality Assurance and Quality Control ("QA/QC") procedures, such as the insertion of certified standards, duplicates and blanks into the sample stream and the utilization of certified independent analytical laboratories for all assays. The QA/QC data and methodology on the project were reviewed and will be summarized in the Technical Report.
Christian Beaulieu, P.Geo. of Minéralis Consulting Services Inc., an independent QP in accordance with the requirements of NI 43-101, has reviewed the adequacy of sample preparation, security, and analytical procedures conducted by New Found Gold from 2019 through to the closure date of the database (February 28, 2026). This review found no material issues or inconsistencies that could materially affect the quality or reliability of the data. The QP is of the opinion that:
New Found Gold's sample preparation procedures are appropriate for the deposit type and mineralization style,
Analytical methods used, including fire assay, photon assay, and screen fire assay, are suitable for determining gold grades at Queensway. Sufficient tests and checks were conducted to validate photon assay as the primary assaying method,
The QA/QC program, which includes certified reference materials ("CRMs"), blanks, field duplicates, and umpire check assays is well-structured, meets industry standards, and provides confidence in the assay data, and
Sample security measures and chain of custody protocols are sufficient to ensure the integrity of the data.
Overall, Mr. Beaulieu is of the opinion that New Found Gold's sampling, analytical methods, and QA/QC program meet industry standards and are suitable for use in the MRE.
Data verification for the drill hole database included comparing gold assay values used to support the MRE against the original analytical certificates from ALS and MSALBAS, the primary laboratories used by New Found Gold between 2018 and 2026, as well as from Eastern Analytical Ltd. as a secondary laboratory. QA/QC results were also verified for potential precision or accuracy issues that could impact the MRE. Core samples and outcrops were also inspected against gold grades and lithological descriptions.
Mr. Beaulieu identified no material discrepancies that would impact the validity of the MRE and is of the opinion that the verification process confirms the reliability of the assay database, ensuring its suitability for use for the MRE.
In accordance with NI 43-101, Mr. Beaulieu conducted a site visit to Queensway and related facilities on October 14 to October 15, 2025. During this site visit, the Mr. Beaulieu inspected mineralized drill core intervals of major deposits (Keats, Keats West, Iceberg, K2), visited the Keats, Iceberg and Lotto trenches (mineralized outcrops), inspected the logging facilities and visited the core storage areas. He also interviewed Company personnel on the geology of Queensway, general logging procedures, sampling and QA/QC protocols. Mr. Beaulieu also verified collar locations using a handheld GPS.
New Found Gold provided full access to all facilities and personnel during the visit. Mr. Beaulieu was accompanied by New Found Gold personnel.
Next Steps
The Technical Report pertaining to the updated MRE and PEA will be filed on the Company's website, under its SEDAR+ profile and on EDGAR within 45 days of this news release.
The Company is currently conducting a 2026 drill program focused on de-risking, discovery and growth.
Following release from the EA process, the Company plans to apply for and obtain a range of provincial and federal permits and work with the province to obtain a Surface and Mining Lease through mid-2027.
Once subsequent permits are received, key milestones for the Company include:
Expansion of Pine Cove to 1,400 tpd capacity for completion in Q4/27
Mobilization of contractors at Queensway in Q1/27
Early works at the Queensway site expected to begin in Q2/27 to include clearing, grubbing, removal of overburden, building of the sound berm, site roads, and water management facilities
Pending receipt of all required permits, mining is anticipated to begin in Q3/27 to build a stockpile for delivery to the Off-site Mill starting in Q4/27.
About New Found Gold
New Found Gold is a new Canadian gold producer with assets in Newfoundland and Labrador, Canada. The Company holds a 100% interest in its flagship asset, Queensway, as well as Hammerdown. With commercial production declared at Hammerdown, the Company remains focused on advancing the fully funded Phase 1 of its flagship Queensway to production.
The Company's portfolio is further strengthened by its district-scale land package at Queensway, covering more than 110 km of strike length across two highly prospective faults zones, and a strong shareholder base, including renowned mining investor and cornerstone shareholder, Eric Sprott.
On August 26, 2026, the Company's shares began trading on the Toronto Stock Exchange under the symbol "NFGC", to align with its stock symbol on the NYSE American LLC.
Keith Boyle, P.Eng.
Chief Executive Officer
New Found Gold Corp.
Neither the TSX nor its Regulation Services Provider (as that term is defined in the policies of the TSX) accepts responsibility for the adequacy or accuracy of this release.
Qualified Persons
The scientific and technical information disclosed in this press release was reviewed and approved by Keith Boyle, P.Eng., CEO, and a Qualified Person as defined under NI 43-101. Mr. Boyle consents to the publication of this press release by New Found Gold. Mr. Boyle certifies that this press release fairly and accurately represents the scientific and technical information that forms the basis for this press release.
The PEA was prepared using the Company's updated MRE with an effective date as at July 6, 2026. The PEA, with an effective date as at October 19, 2026 was prepared by consultants who are independent of New Found Gold, each of whom are QPs as defined by NI 43-101. Each of the QPs have reviewed and confirmed that this news release fairly and accurately reflects, in the form and context in which it appears, the information contained in the respective sections of the PEA for which they are responsible. The following acted as QPs under NI 43-101 as authors of the PEA:
Stephen Coates, P.Eng., Evomine Consulting Inc., responsible for Mining Methods, Stockpiles, Mining Capital and Operating Costs.
Christian Beaulieu, P.Geo., Minéralis Consulting Services Inc., responsible for Property Description and Location, Accessibility, Climate, Local Resources, Infrastructure, and Physiography, History, Geological Setting and Mineralization), Deposit Types, Exploration, Drilling, Sample Preparation, Analyses, and Security, Data Verification, Mineral Resource Estimate, Adjacent Properties.
Ali Jalbout, P.Eng., ASA Geotech Inc., responsible for Mining Methods - geotechnical subsection.
Sheldon H. Smith, P.Geo., Stantec Consulting Ltd., responsible for Property Description and Location - Subsection for environmental risks and liabilities, Mining Methods - Subsection for hydrogeology and geochemistry, Environmental Studies, Permitting, and Social or Community Impact, Closure Costs.
J. Alex McIntyre, P.Eng., Knight Piésold Ltd., responsible for Project Infrastructure - Subsection for tailings (Pine Cove site), Environmental Studies, Permitting, and Social or Community Impact - Subsection for closure (Pine Cove site),TSF Sustaining Capital and Operating Costs (Pine Cove).
Neil J. Lincoln, P.Eng., Lincoln Metallurgical, Inc., responsible for Mineral Processing and Metallurgical Testing, Recovery Methods, Queensway Crushing Plant and Mill Capital, Pine Cove and Queensway Operating Costs, G&A costs and indicative concentrate terms.
Michelle Murphy, P.Eng., WSP Canada Inc., responsible for Project Infrastructure, Electrical and Water Management, Capital Cost.
William Richard McBride, P.Eng., WSP Canada Inc., responsible for Introduction, Market Studies and Contracts, compiling of Capital and Operating Costs, Economic Analysis.
Contact
For further information on New Found Gold contact us through our investor inquiry form on our website or contact:
Fiona Childe, Ph.D., P.Geo.
Vice President, Communications and Corporate Development
Phone: +1 (416) 775-2700
Email: contact@newfoundgold.ca
Forward-Looking Information
This press release contains certain "forward-looking statements" within the meaning of Canadian and United States securities legislation, including statements regarding the results and conclusions of the PEA, including the updated MRE, the projected economics, mine planning, production profiles, capital and operating cost estimates, project development opportunities, processing assumptions, anticipated operational efficiencies, potential project optimizations, and the expected benefits arising therefrom; the Queensway becoming Canada's next mid-tier gold producer; the camp-scale potential of the Dropkick Zone; the development strategy over three phases, including, as part of Phase 1, the commencement of milling OP mineralized material from Keats and Iceberg deposits in Q4/27 at a rate of 700 tpd at the Pine Cove mill, the expansion of capacity and the processing of high grade mineralized material from Queensway at Pine Cove until 2030, as part of Phase 2, the commencement in 2031 of milling of OP and UG mineralized material from all deposits at a rate of 4,900 tpd at a newly built Queensway Mill, and, as part of Phase 3, the expansion of the Queensway Mill Gravity-Flotation circuit to 5,000 tpd, while continuing to process OP and UG high-grade mineralized material at 2,000 tpd in the Gravity-CIL circuit, for total processing capacity of 7,000 tpd, the planned use of in-pit tailings deposition throughout all phases of the Project, the mine plan for production of 1.744 M oz Au over 15 year mine life, the growth potential, and the capital expenditures and funding, including the anticipated use of cash flows from Phase 1 to fund the growth capital for Phases 2 and 3 at an average gold price of US$3,600/oz; the filing of the Technical Report within 45 days of this press release; the anticipated delivery to the mill of 1.9 Mt of mineralized material at an average diluted grade of 6.85 g/t for 427 koz Au; the expected open pit mining from 2027 until 2040 with a peak mining rate of 53,200 tpd; the expected underground mining from 2030 until 2039 with a peak mining rate of 800 tpd; the estimate doré recovery of 94% in Phase 1; the estimated gold recovery of 92% at the gravity-CIL circuit and 88% at the gravity-flotation circuit in Phases 2 and 3; over the LOM, the expectation that 85% of the gold will report to doré and 15% will report to gold concentrate; the expectation that approximately 28.8 Mt of tailings will be accommodated over the life of the Project; the scheduled construction of a water settling pond and water treatment plant as part of the early works prior to production, and the scheduled construction of a sound attenuation berm; the economic analysis, including the projected economic returns, net present value, internal rate of return, projected taxation, cash flow forecasts, optimizations, and the anticipated benefits arising from applicable tax incentives and government programs; the target submission for the EPR for Q4/26; the planned application for a range of provincial and federal permits following release from the EA process and work with the province to obtain a Surface and Mining Lease; plans to draw on the skilled workforce available in central Newfoundland and create employment and procurement opportunities within NL, with the expectation that a total of 530 new jobs will be created in central Newfoundland over the LOM; the planned expansion of the Pine Cove mill to 1,400 tpd capacity in Q4, 2027; the mobilization of contractors at Queensway in Q1 2027; the start of early works at Queensway in Q2 2027; the commencement of mining in Q3 2027 to build a stockpile for delivery to Pine Cove mill starting in Q4 2027; and the Company's focus on advancing Phase 1 to production. Although the Company believes that such statements are reasonable, it can give no assurance that such expectations will prove to be correct. Forward-looking statements are statements that are not historical facts; they are generally, but not always, identified by the words "expects", "plans", "anticipates", "believes", "interpreted", "intends", "estimates", "projects", "aims", "suggests", "indicate", "often", "target", "future", "likely", "pending", "potential", "encouraging", "goal", "objective", "prospective", "possibly", "preliminary", and similar expressions, or that events or conditions "will", "would", "may", "can", "could" or "should" occur, or are those statements, which, by their nature, refer to future events. The Company cautions that forward-looking statements are based on the beliefs, estimates and opinions of the Company's management on the date the statements are made, and they involve a number of risks and uncertainties. Consequently, there can be no assurances that such statements will prove to be accurate and actual results and future events could differ materially from those anticipated in such statements. Except to the extent required by applicable securities laws and the policies of the TSX and NYSE American, the Company undertakes no obligation to update these forward-looking statements if management's beliefs, estimates or opinions, or other factors, should change. Factors that could cause future results to differ materially from those anticipated in these forward-looking statements include risks associated with the Company's ability to complete exploration and drilling programs as expected, possible accidents and other risks associated with mineral exploration operations, the risk that the Company will encounter unanticipated geological factors, risks associated with the interpretation of exploration results and the results of the metallurgical testing program, the possibility that the Company may not be able to secure permitting and other governmental clearances necessary to carry out the Company's exploration plans, the risk that the Company will not be able to raise sufficient funds to carry out its business plans, and the risk of political uncertainties and regulatory or legal changes that might interfere with the Company's business and prospects. The reader is urged to refer to the Company's Annual Information Form and Management's Discussion and Analysis, publicly available through the Canadian Securities Administrators' System for Electronic Document Analysis and Retrieval (SEDAR+) at www.sedarplus.ca and on the website of the United States Securities and Exchange Commission at www.sec.gov for a more complete discussion of such risk factors and their potential effects.
Non-IFRS Financial Measures
This press release contains reference to the following non-IFRS financial measures: cash operating costs per ounce of gold sold, all-in sustaining costs per ounce of gold sold, and average realized gold price (per ounce of gold sold). These non-IFRS performance measures do not have any standardized meaning prescribed by IFRS and, therefore, may not be comparable to similar measures presented by other companies.
The Company believes that, in addition to conventional measures prepared in accordance with IFRS, certain investors use this information to evaluate the Company's performance. Accordingly, non-IFRS financial measures are intended to provide additional information and should not be considered in isolation or as a substitute for measures of performance prepared in accordance with IFRS. More specifically, management believes that these figures are a useful indicator to investors and management of a mine's performance as they provide: (i) a measure of the mine's cash margin per ounce, by comparison of the cash operating costs per ounce to the price of gold; (ii) the trend in costs as the mine matures; and (iii) an internal benchmark of performance to allow for comparison against other mines.
As the Project is currently not in production, the Company does not have historical operating results for the Project against which to compare these non-IFRS measures, and cannot perform a reconciliation with historical measures.
For additional details, please refer to the Company's discussion of Non-IFRS and other performance measures in its Management's Discussion and Analysis, publicly available through the Canadian Securities Administrators' System for Electronic Document Analysis and Retrieval (SEDAR+) at www.sedarplus.ca and on the website of the United States Securities and Exchange Commission at www.sec.gov.
Appendix 1: Queensway global in-pit and underground updated MRE broken down by areas and major contributors.
| Area | Deposit | Category | Open Pit | Underground | Total | ||||||
Tonnage | Grade | Contained Au | Tonnage | Grade | Contained Au | Tonnage | Grade | Contained Au | |||
| AFZ Core | Keats | Measured | 168 | 5.67 | 31 | 0 | - | 0 | 168 | 5.67 | 31 |
| Indicated | 6,161 | 2.01 | 397 | 150 | 5.35 | 26 | 6,311 | 2.08 | 423 | ||
| M&I | 6,328 | 2.10 | 428 | 150 | 5.35 | 26 | 6,478 | 2.18 | 454 | ||
| Inferred | 565 | 0.83 | 15 | 149 | 3.17 | 15 | 714 | 1.32 | 30 | ||
| Iceberg | Measured | 92 | 10.23 | 30 | 0 | - | 0 | 92 | 10.23 | 30 | |
| Indicated | 2,725 | 3.64 | 319 | 16 | 3.60 | 2 | 2,741 | 3.64 | 321 | ||
| M&I | 2,816 | 3.85 | 349 | 16 | 3.60 | 2 | 2,833 | 3.85 | 351 | ||
| Inferred | 273 | 0.87 | 8 | 0.2 | 2.22 | 0.02 | 273 | 0.87 | 8 | ||
| Keats West | Indicated | 5,148 | 2.11 | 350 | 14 | 4.87 | 2 | 5,162 | 2.12 | 352 | |
| Inferred | 387 | 1.07 | 13 | 3 | 3.02 | 0.3 | 391 | 1.09 | 14 | ||
| K2 | Indicated | 5,731 | 1.39 | 257 | 0 | - | 0 | 5,731 | 1.39 | 257 | |
| Inferred | 1,653 | 0.96 | 51 | 45 | 2.59 | 4 | 1,698 | 1.00 | 55 | ||
| Lotto-Lotto North | Indicated | 1,937 | 2.42 | 151 | 20 | 3.84 | 3 | 1,957 | 2.43 | 153 | |
| Inferred | 897 | 1.03 | 30 | 44 | 4.40 | 6 | 941 | 1.19 | 36 | ||
| Golden Joint | Indicated | 619 | 2.24 | 45 | 41 | 5.72 | 8 | 660 | 2.46 | 52 | |
| Inferred | 367 | 2.17 | 26 | 208 | 5.15 | 34 | 575 | 3.25 | 60 | ||
| Monte Carlo | Indicated | 915 | 2.27 | 67 | 17 | 2.26 | 1 | 933 | 2.27 | 68 | |
| Inferred | 563 | 1.23 | 22 | 103 | 2.60 | 9 | 666 | 1.44 | 31 | ||
| Satellite deposits | Indicated | 1,234 | 1.93 | 76 | 93 | 4.46 | 13 | 1,327 | 2.10 | 90 | |
| Inferred | 2,867 | 0.91 | 84 | 488 | 4.28 | 67 | 3,355 | 1.40 | 151 | ||
| AFZ Peripheral | Dropkick | Indicated | 682 | 3.73 | 82 | 0 | - | 0 | 682 | 3.73 | 82 |
| Inferred | 2,463 | 1.53 | 121 | 122 | 6.49 | 26 | 2,585 | 1.76 | 147 | ||
| Satellite deposits | Indicated | 1,290 | 0.77 | 32 | 132 | 5.28 | 22 | 1,422 | 1.19 | 54 | |
| Inferred | 575 | 1.37 | 25 | 152 | 4.12 | 20 | 727 | 1.95 | 46 | ||
| JBP | Indicated | 116 | 1.37 | 5 | 24 | 3.85 | 3 | 140 | 1.80 | 8 | |
| Inferred | 433 | 1.37 | 19 | 113 | 2.64 | 10 | 546 | 1.64 | 29 | ||
| Total | Measured | 259 | 7.28 | 61 | 0 | - | 0 | 259 | 7.28 | 61 | |
| Indicated | 26,557 | 2.08 | 1,780 | 509 | 4.89 | 80 | 27,066 | 2.14 | 1,860 | ||
| M&I | 26,816 | 2.13 | 1,840 | 509 | 4.89 | 80 | 27,325 | 2.19 | 1,920 | ||
| Inferred | 11,044 | 1.17 | 414 | 1,427 | 4.17 | 191 | 12,471 | 1.51 | 606 | ||
Notes: See notes for Table 6.
Appendix 2: Queensway Mine Plan Summary.
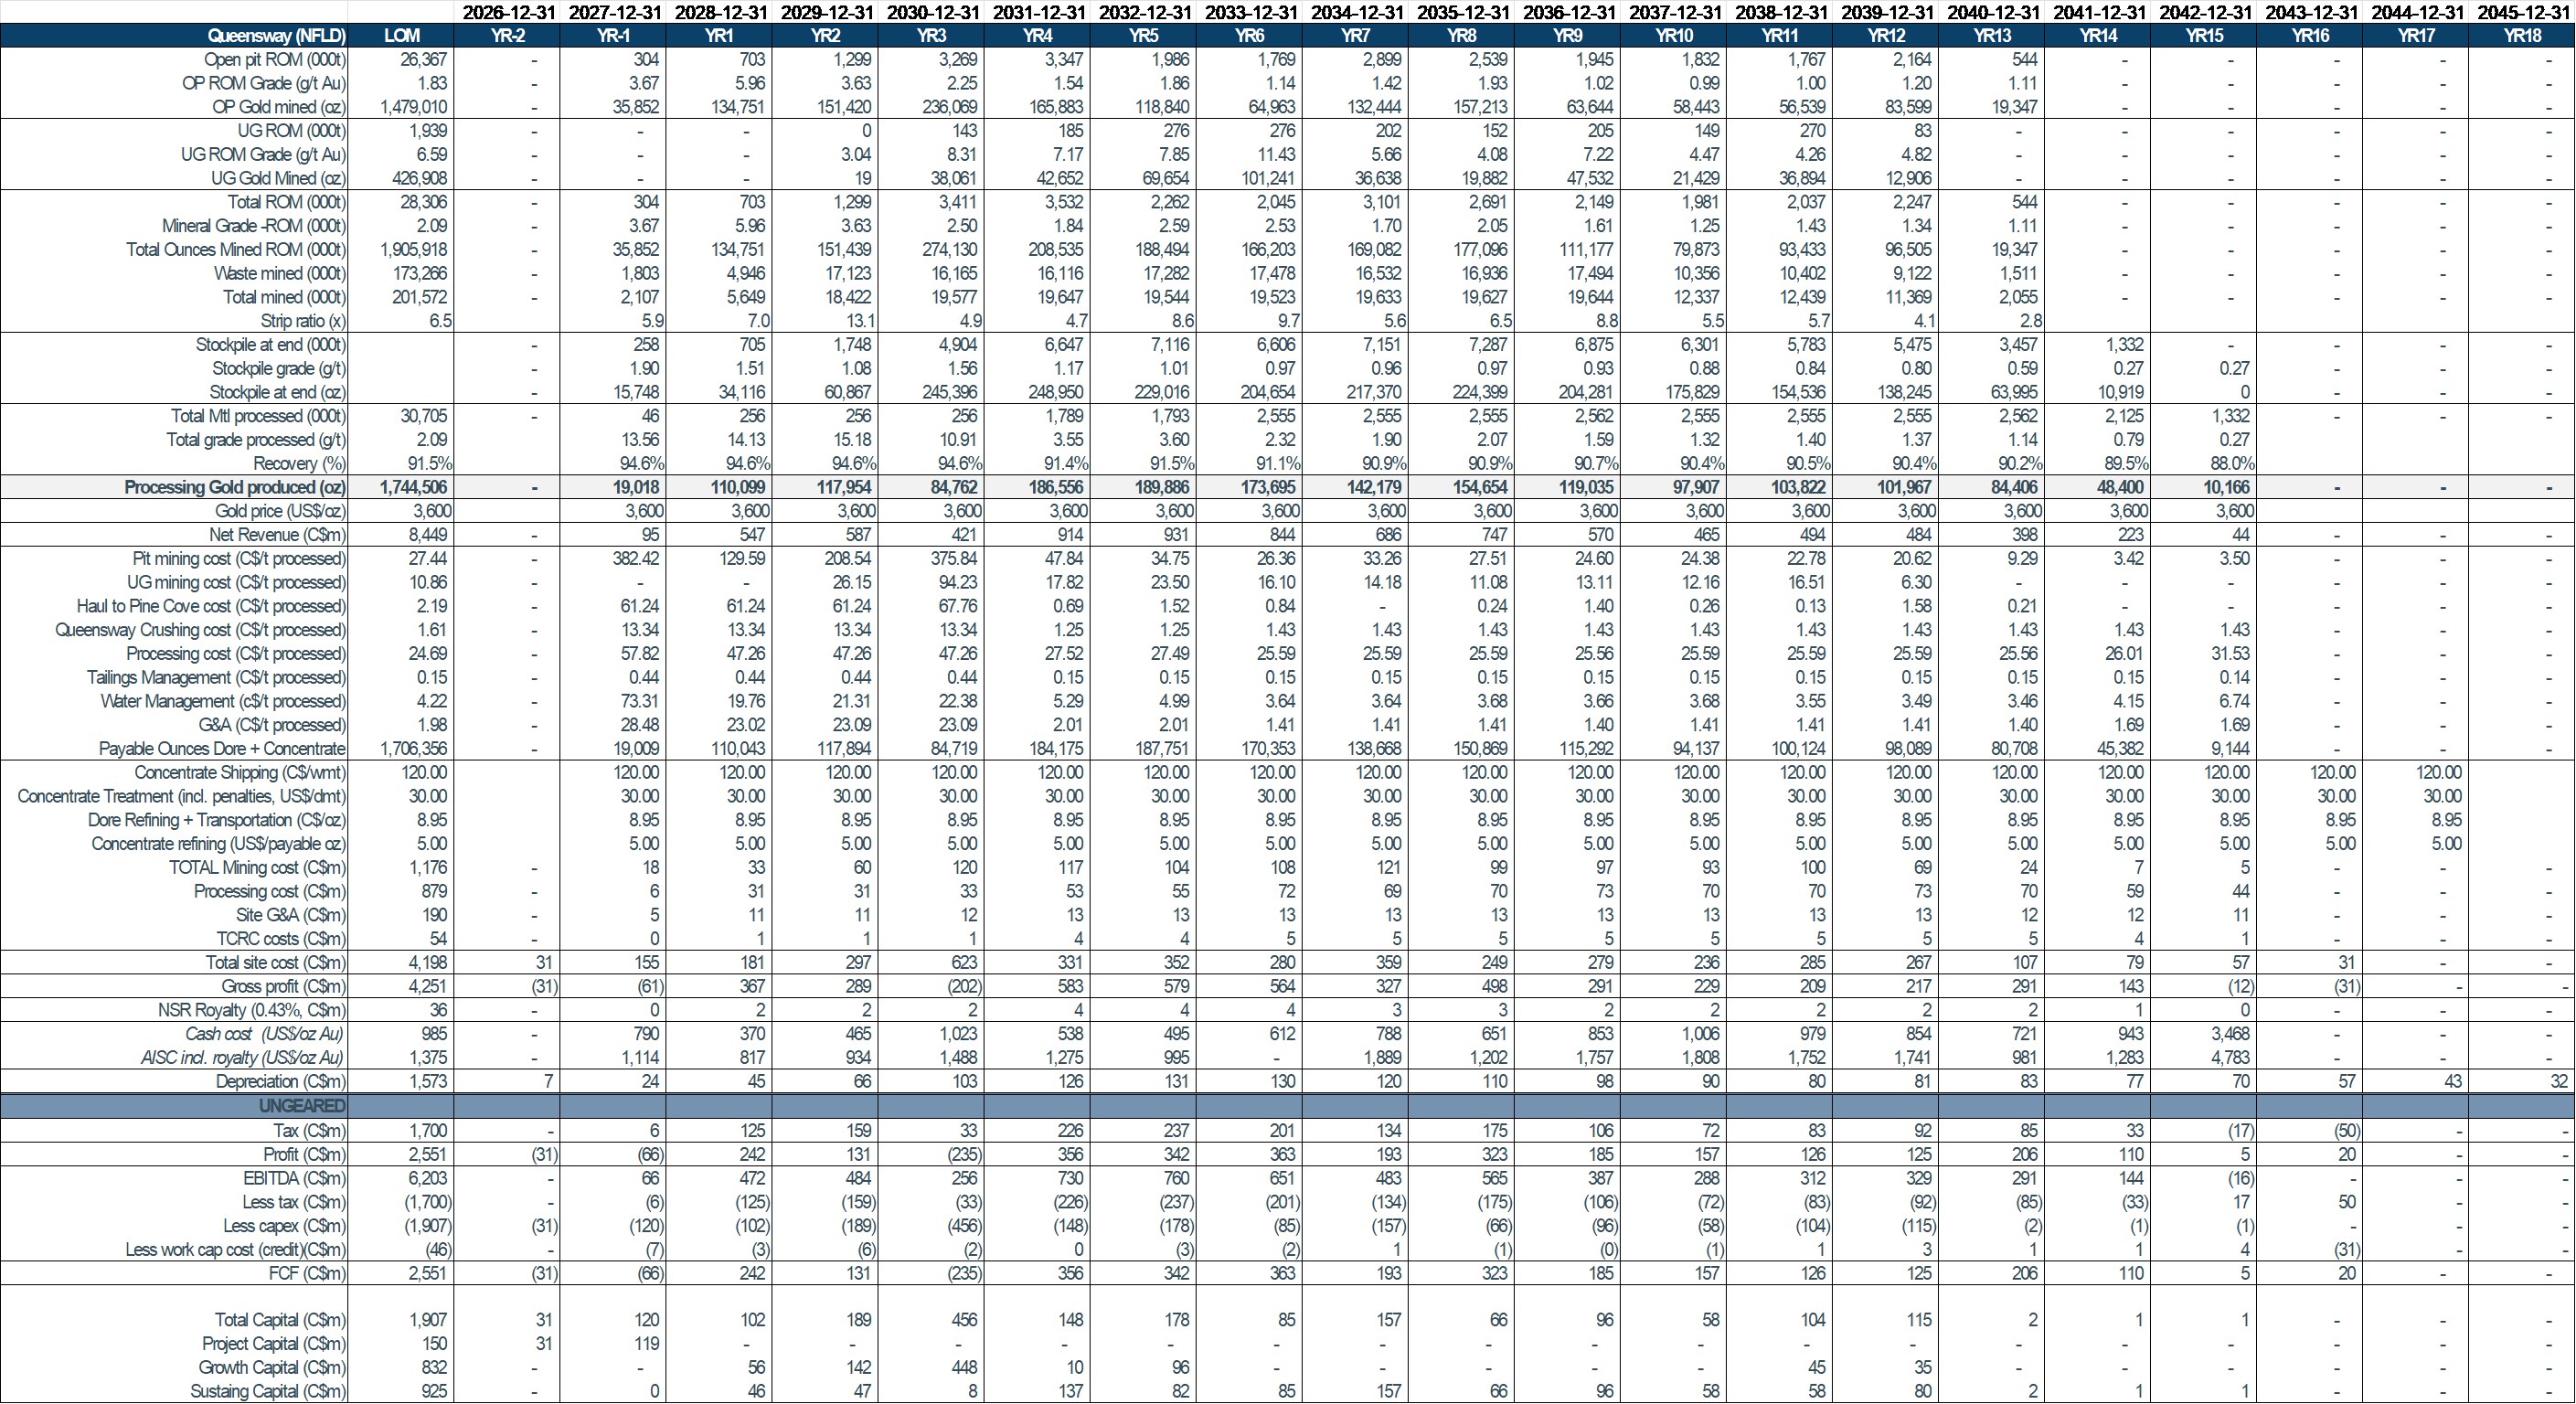
To view an enhanced version of this graphic, please visit:
https://images.newsfilecorp.com/files/7337/319963_0ce29a3064f12ba8_006full.jpg
[1] Note Cash Cost and AISC are IFRS measures; see notes below for additional information regarding Cash Costs and AISC.
[2] Debt facility available until May 15, 2027, subject to the satisfaction of certain conditions precedent (see New Found Gold press releases dated April 20, 2026 and May 19, 2026).
To view the source version of this press release, please visit https://www.newsfilecorp.com/release/319963
Source: New Found Gold Corp.