A High-Performing Plasma Metabolite Panel for Early-Stage Lung Cancer Detection

 , , , and
Abstract
:
1. Introduction
2. Materials and Methods
2.1. Regulatory and Institutional Review Board Approvals
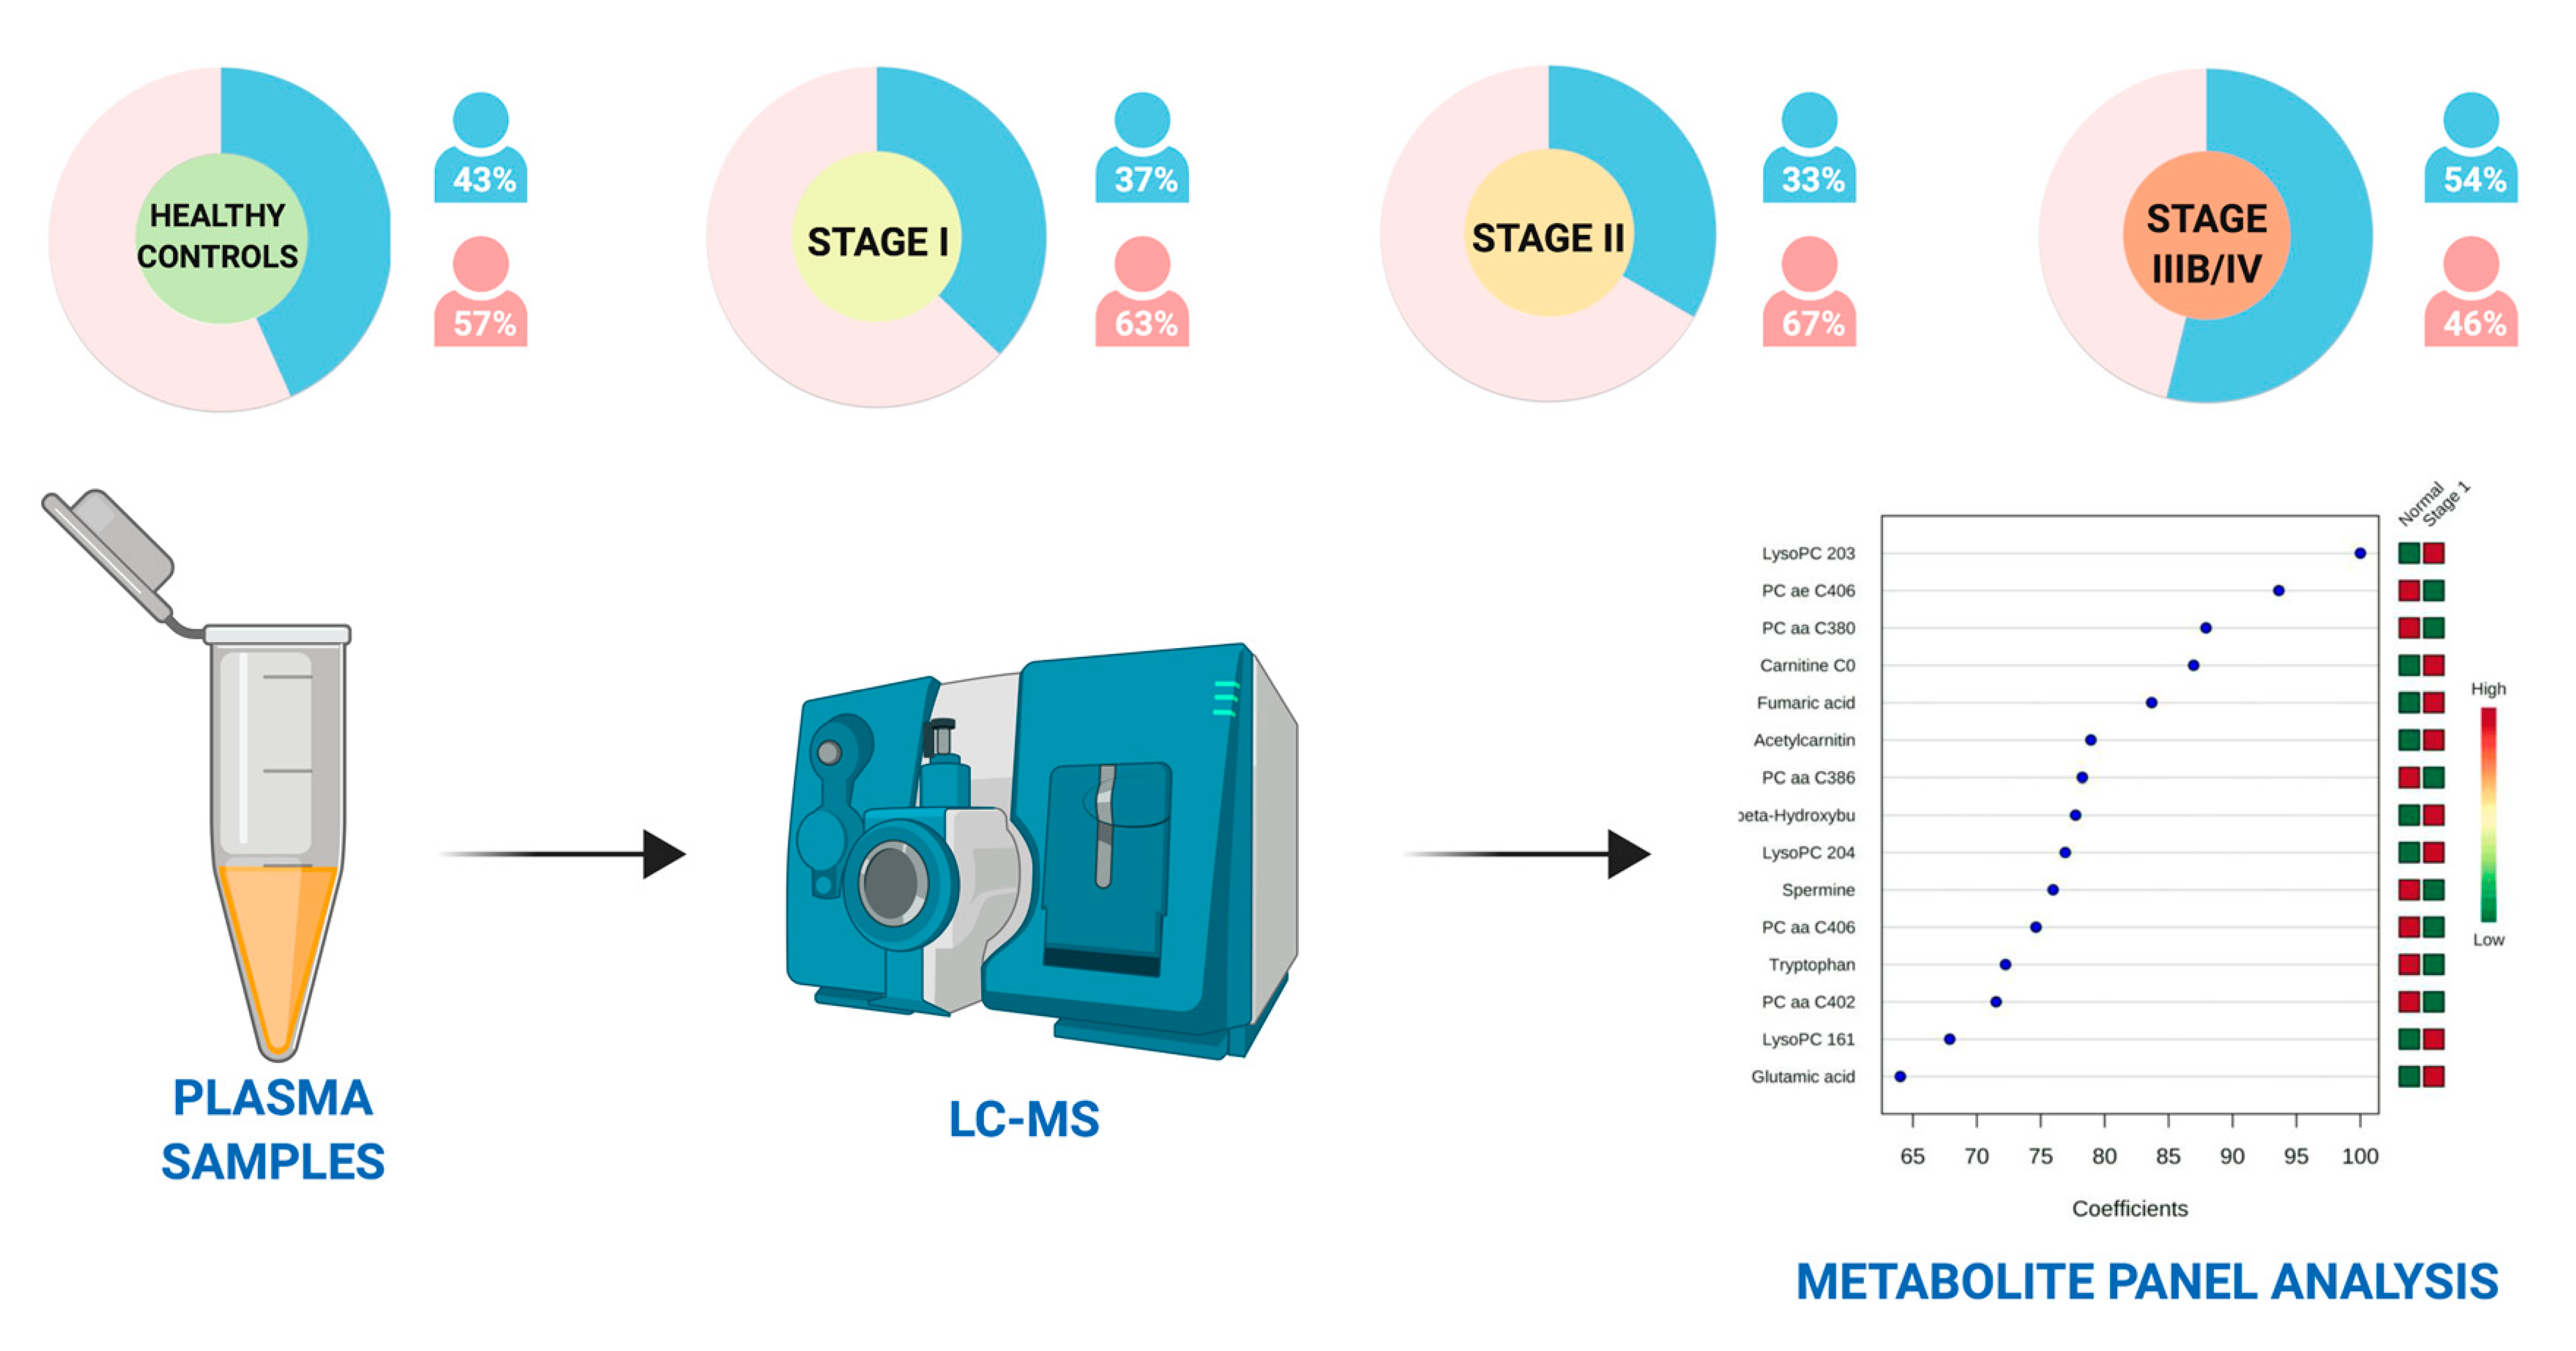
2.2. Study Population
2.3. Chemicals, Reagents, and Materials for Metabolomic Assays
2.4. Stock Solutions, Internal Standard (ISTD) Mixture, and Calibration Curve Standards for Metabolomic Assays
2.5. Sample Preparation and Liquid Chromatography/Direct Injection Mass Spectrometry for Metabolomic Assays
2.6. Statistical Analysis
3. Results
3.1. Statistical Data Processing
3.2. Statistical Analysis on Clinical Variables
3.3. Statistical Analysis: Normal vs. NSCLC at All Stages
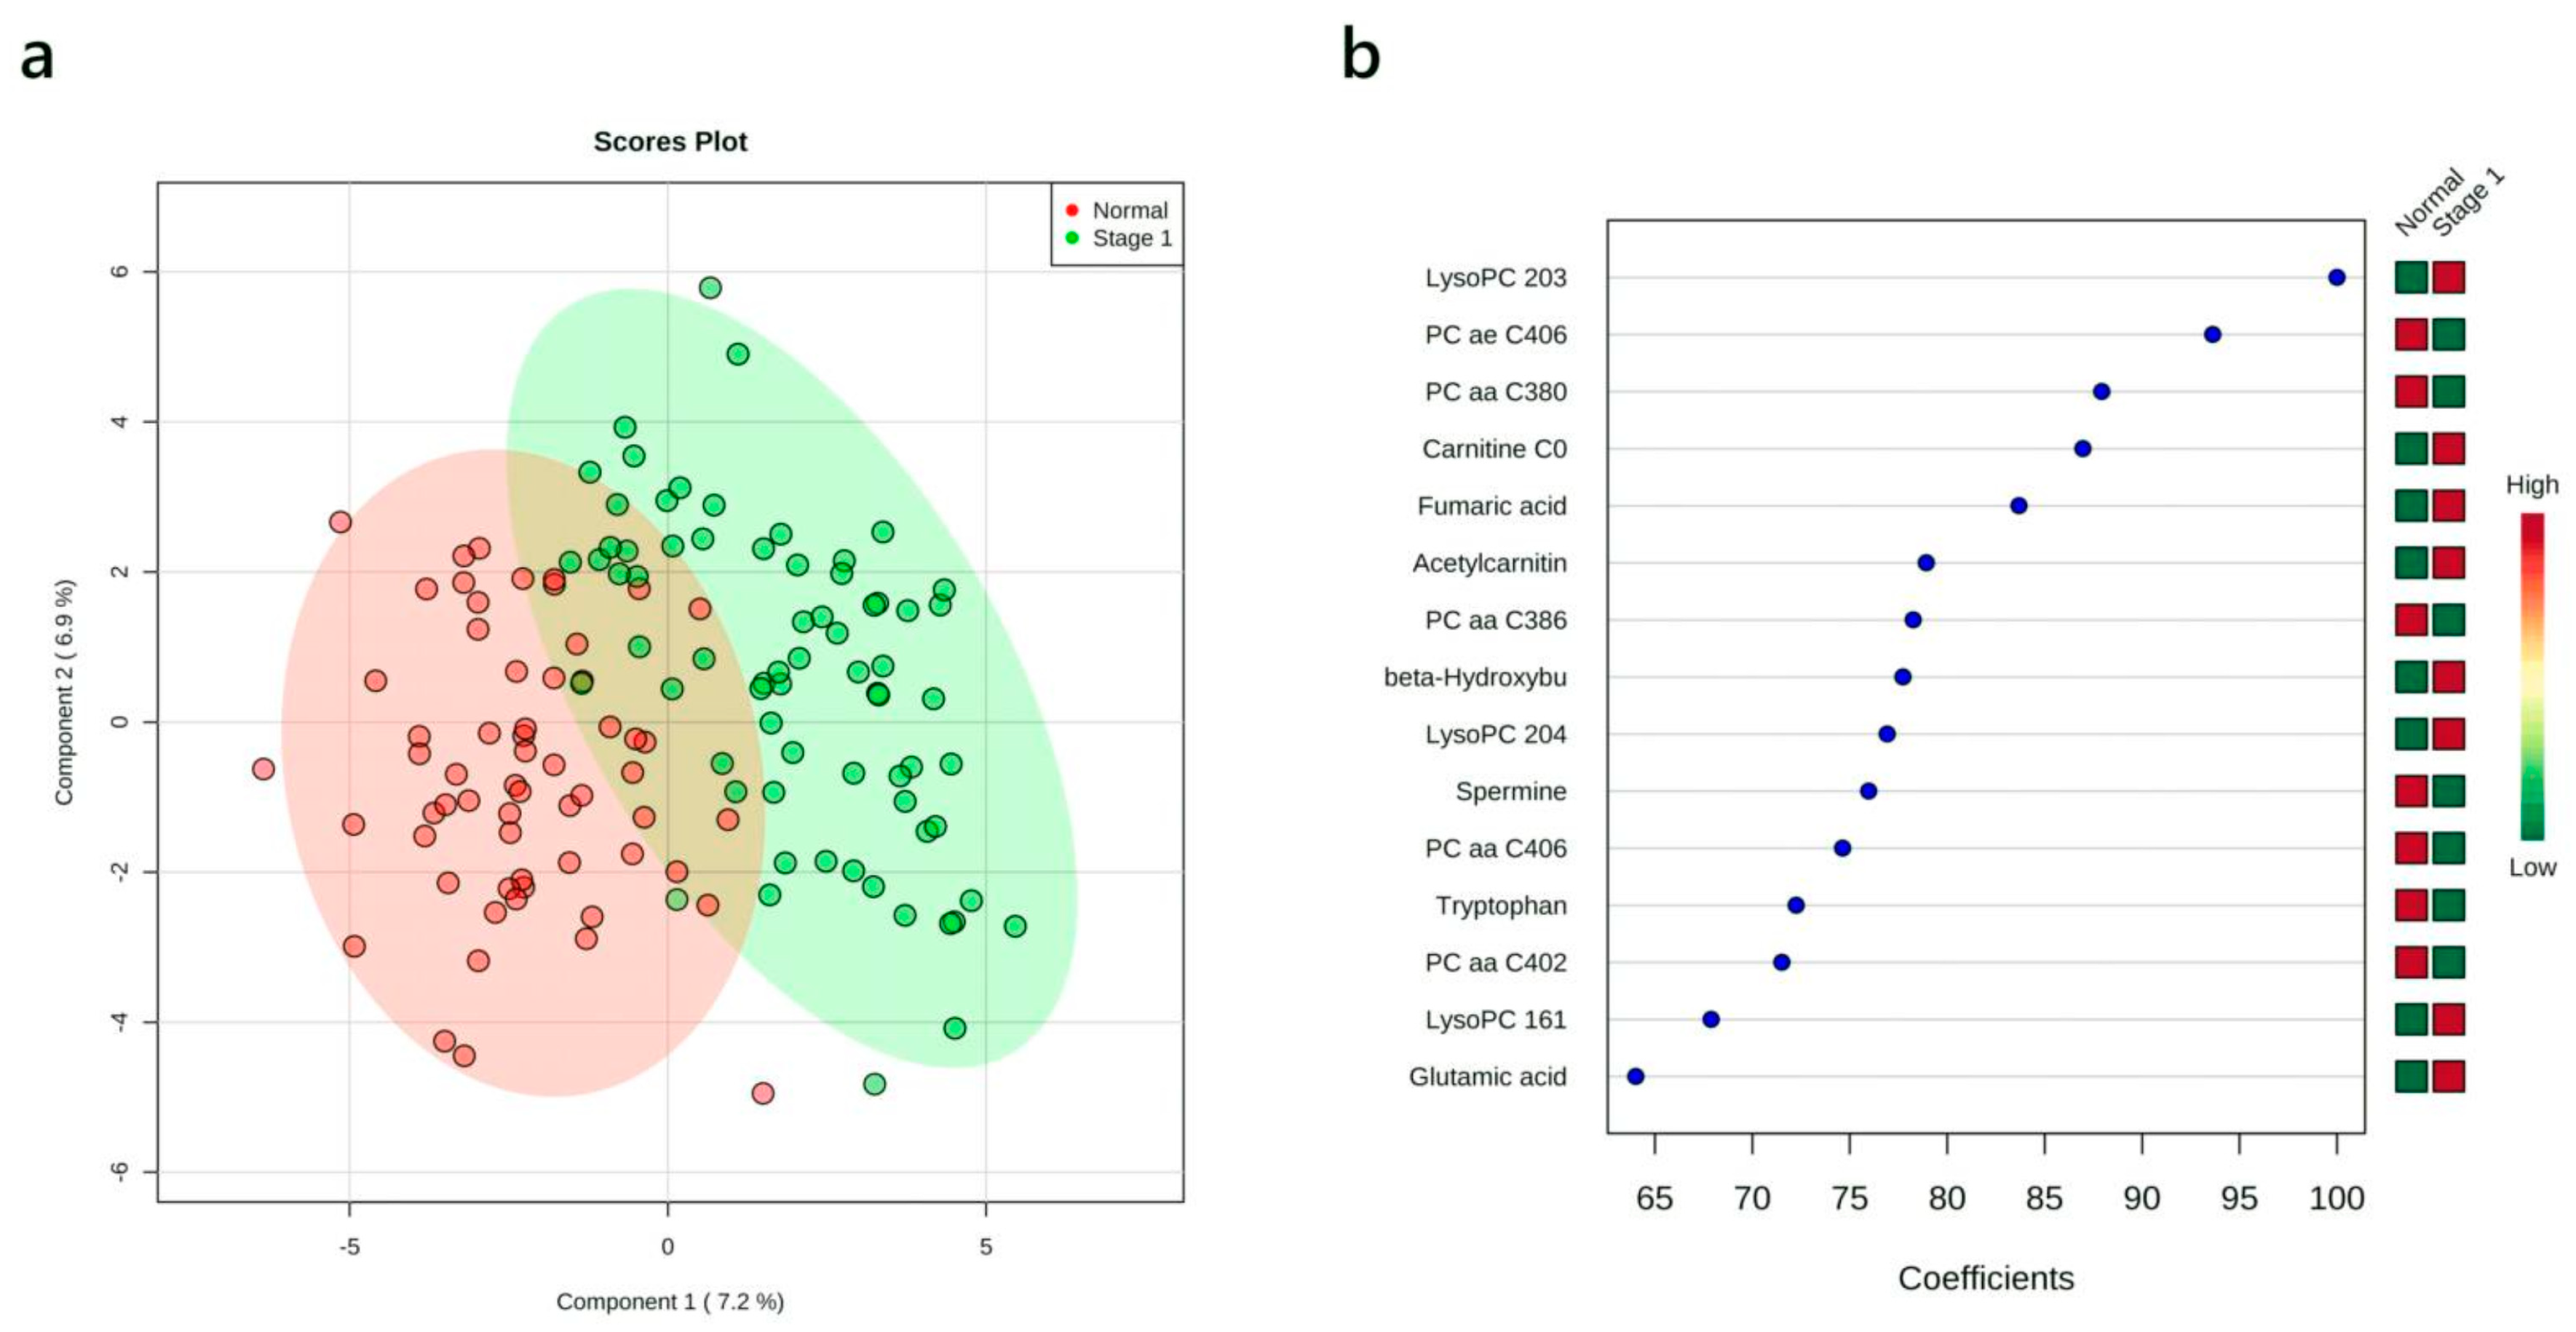
3.4. Multivariate Analysis: Stage I vs. Normal
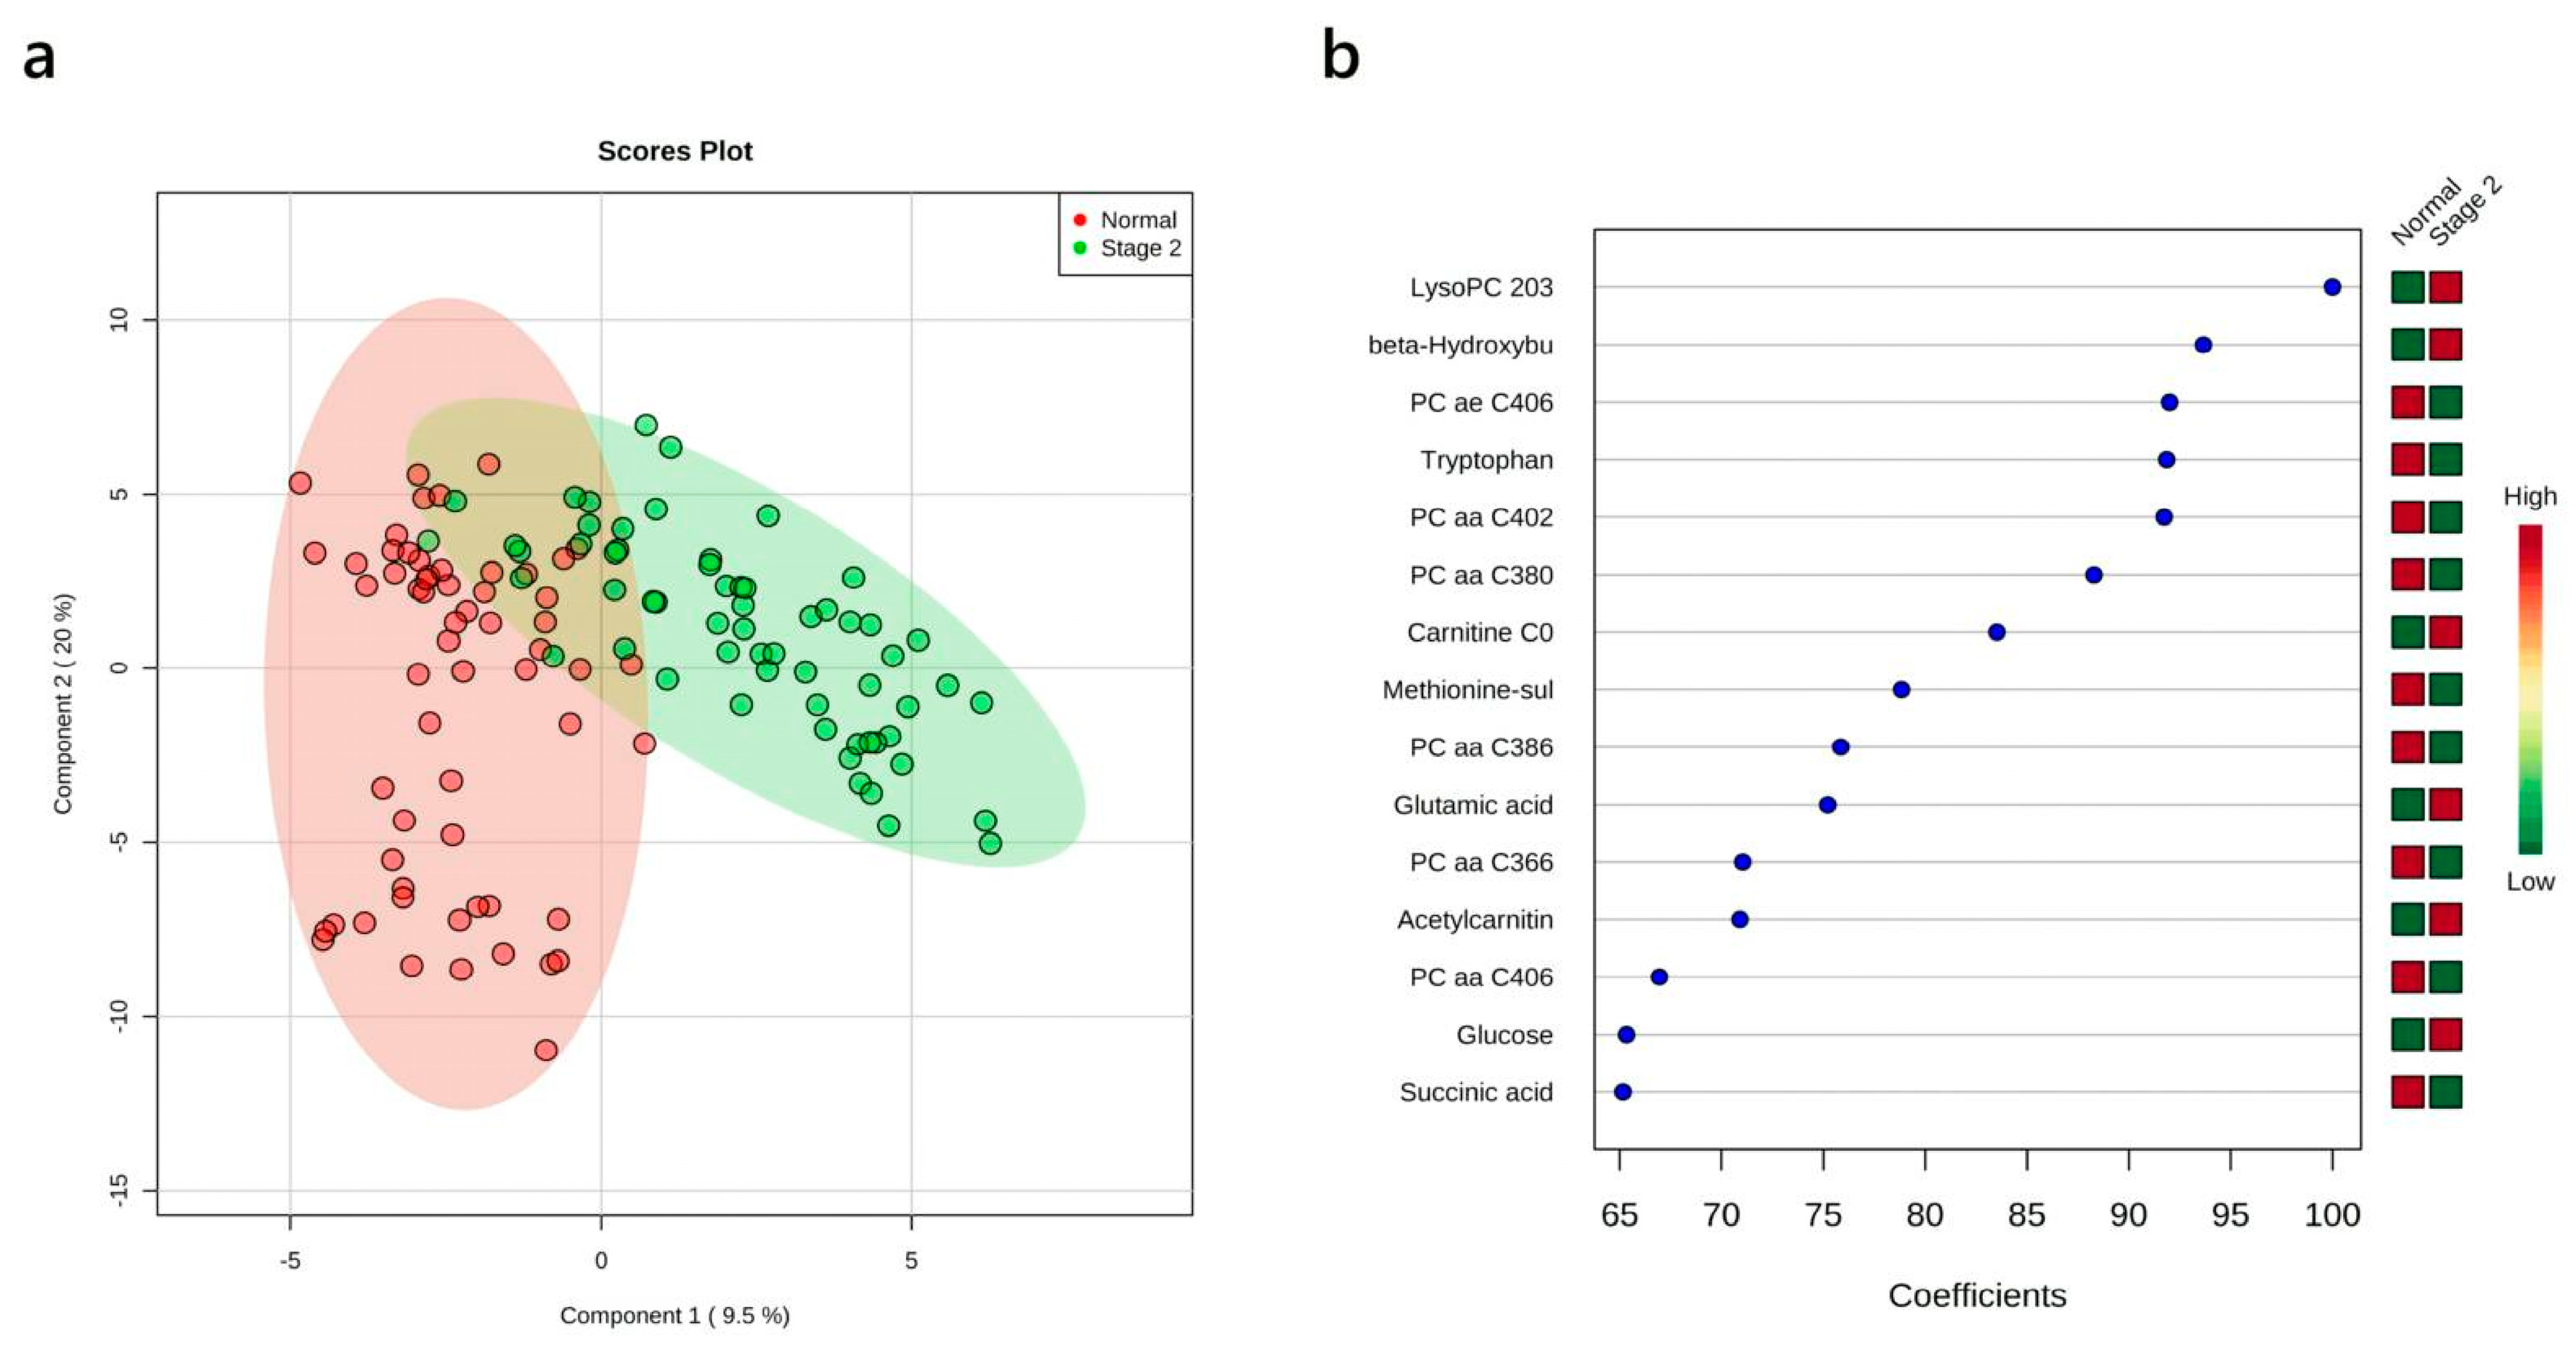
3.5. Multivariate Analysis: Stage II vs. Normal
3.6. Multivariate Analysis: Stage I+II vs. Healthy Controls
3.7. Multivariate Analysis: Stages IIIB+IV vs. Normal
4. Discussion
5. Conclusions
Supplementary Materials
Author Contributions
Funding
Acknowledgments
Conflicts of Interest
References
- Reck, M.; Rabe, K.F. Precision diagnosis and treatment for advanced non–small-cell lung cancer. N. Engl. J. Med. 2017, 377, 849–861. [Google Scholar] [CrossRef] [Green Version]
- Lanuti, M.; Hong, H.-J.; Ali, S.; Stock, C.; Temel, J.; Mathisen, D.; Michaelson, J.S. Observations in lung cancer over multiple decades: an analysis of outcomes and cost at a single high-volume institution. Eur. J. Cardio-Thorac. Surg. 2014, 46, 254–261. [Google Scholar] [CrossRef] [Green Version]
- Howlader, N.; Noone, A.M.; Krapcho, M.; Miller, D.; Brest, A.; Yu, M.; Ruhl, J.; Tatalovich, Z.; Mariotto, A.; Lewis, D.R.; et al. (Eds.) SEER Cancer Statistics Review, 1975–2016; SEER: Bethesda, MD, USA, 2019. Available online: https://seer.cancer.gov/csr/1975_2016/ (accessed on 2 August 2019).
- Lu, T.; Yang, X.; Huang, Y.; Zhao, M.; Li, M.; Ma, K.; Yin, J.; Zhan, C.; Wang, Q. Trends in the incidence, treatment, and survival of patients with lung cancer in the last four decades. Cancer Manag. Res. 2019, 11, 943–953. [Google Scholar] [CrossRef] [Green Version]
- International Early Lung Cancer Action Program Investigators; Henschke, C.I.; Yankelevitz, D.F.; Libby, D.M.; Pasmantier, M.W.; Smith, J.P.; Miettinen, O.S. Survival of patients with stage I lung cancer detected on CT screening. N. Engl. J. Med. 2006, 355, 1763–1771. [Google Scholar]
- National Lung Screening Trial Research Team. Reduced lung-cancer mortality with low-dose computed tomographic screening. N. Engl. J. Med. 2011, 365, 395–409. [Google Scholar] [CrossRef] [PubMed] [Green Version]
- Pastorino, U.; Silva, M.; Sestini, S.; Sabia, F.; Boeri, M.; Cantarutti, A.; Sverzellati, N.; Sozzi, G.; Corrao, G.; Marchianò, A. Prolonged lung cancer screening reduced 10-year mortality in the MILD trial: New confirmation of lung cancer screening efficacy. Ann. Oncol. 2019, 30, 1162–1169. [Google Scholar] [CrossRef] [PubMed]
- Xia, J.; Wishart, D.S. Using MetaboAnalyst 3.0 for comprehensive metabolomics data analysis. Curr. Protoc. Bioinform. 2016, 55, 14.10.1–14.10.91. [Google Scholar] [CrossRef] [PubMed]
- Zhong, L.; Coe, S.P.; Stromberg, A.J.; Khattar, N.H.; Jett, J.R.; Hirschowitz, E.A. Profiling tumor-associated antibodies for early detection of non-small cell lung cancer. J. Thorac. Oncol. 2006, 1, 513–519. [Google Scholar] [CrossRef] [PubMed]
- Sozzi, G.; Boeri, M.; Rossi, M.; Verri, C.; Suatoni, P.; Bravi, F.; Roz, L.; Conte, D.; Grassi, M.; Sverzellati, N.; et al. Clinical utility of a plasma-based miRNA signature classifier within computed tomography lung cancer screening: A correlative MILD trial study. J. Clin. Oncol. 2014, 32, 768–773. [Google Scholar] [CrossRef] [PubMed]
- Fiala, C.; Diamandis, E.P. Utility of circulating tumor DNA in cancer diagnostics with emphasis on early detection. BMC Med. 2018, 16, 166. [Google Scholar] [CrossRef] [PubMed] [Green Version]
- Paci, M.; Maramotti, S.; Bellesia, E.; Formisano, D.; Albertazzi, L.; Ricchetti, T.; Ferrari, G.; Annessi, V.; Lasagni, D.; Carbonelli, C.; et al. Circulating plasma DNA as diagnostic biomarker in non-small cell lung cancer. Lung Cancer 2009, 64, 92–97. [Google Scholar] [CrossRef] [PubMed]
- Newman, A.M.; Bratman, S.V.; To, J.; Wynne, J.F.; Eclov, N.C.W.; Modlin, L.A.; Liu, C.L.; Neal, J.W.; Wakelee, H.A.; Merritt, R.E.; et al. An ultrasensitive method for quantitating circulating tumor DNA with broad patient coverage. Nat. Med. 2014, 20, 548–554. [Google Scholar] [CrossRef] [PubMed]
- Ostrow, K.L.; Hoque, M.O.; Loyo, M.; Brait, M.; Greenberg, A.; Siegfried, J.M.; Grandis, J.R.; Gaither Davis, A.; Bigbee, W.L.; Rom, W.; et al. Molecular analysis of plasma DNA for the early detection of lung cancer by quantitative methylation-specific PCR. Clin. Cancer Res. 2010, 16, 3463–3472. [Google Scholar] [CrossRef] [PubMed] [Green Version]
- Duarte, I.F.; Rocha, C.M.; Gil, A.M. Metabolic profiling of biofluids: Potential in lung cancer screening and diagnosis. Expert Rev. Mol. Diagn. 2013, 13, 737–748. [Google Scholar] [CrossRef]
- Wishart, D.; Mandal, R.; Stanislaus, A.; Ramirez-Gaona, M. Cancer metabolomics and the human metabolome database. Metabolites 2016, 6, 10. [Google Scholar] [CrossRef] [Green Version]
- O’Shea, K.; Cameron, S.J.S.; Lewis, K.E.; Lu, C.; Mur, L.A.J. Metabolomic-based biomarker discovery for non-invasive lung cancer screening: A case study. Biochim. Biophys. Acta Gen. Subj. 2016, 1860, 2682–2687. [Google Scholar] [CrossRef] [Green Version]
- Kumar, N.; Shahjaman, M.; Mollah, M.N.H.; Islam, S.M.S.; Hoque, M.A. Serum and plasma metabolomic biomarkers for lung cancer. Bioinformation 2017, 13, 202–208. [Google Scholar] [CrossRef] [Green Version]
- Callejón-Leblic, B.; García-Barrera, T.; Grávalos-Guzmán, J.; Pereira-Vega, A.; Gómez-Ariza, J.L. Metabolic profiling of potential lung cancer biomarkers using bronchoalveolar lavage fluid and the integrated direct infusion/gas chromatography mass spectrometry platform. J. Prot. 2016, 145, 197–206. [Google Scholar] [CrossRef] [Green Version]
- Yu, L.; Li, K.; Zhang, X. Next-generation metabolomics in lung cancer diagnosis, treatment and precision medicine: Mini review. Oncotarget 2017, 8, 115774–115786. [Google Scholar] [CrossRef] [Green Version]
- Maeda, J.; Higashiyama, M.; Imaizumi, A.; Nakayama, T.; Yamamoto, H.; Daimon, T.; Yamakado, M.; Imamura, F.; Kodama, K. Possibility of multivariate function composed of plasma amino acid profiles as a novel screening index for non-small cell lung cancer: A case control study. BMC Cancer 2010, 10, 690. [Google Scholar] [CrossRef] [Green Version]
- Yu, Z.; Chen, H.; Ai, J.; Zhu, Y.; Li, Y.; Borgia, J.A.; Yang, J.-S.; Zhang, J.; Jiang, B.; Gu, W.; et al. Global lipidomics identified plasma lipids as novel biomarkers for early detection of lung cancer. Oncotarget 2017, 8, 107899–107906. [Google Scholar] [CrossRef] [PubMed]
- Ros-Mazurczyk, M.; Jelonek, K.; Marczyk, M.; Binczyk, F.; Pietrowska, M.; Polanska, J.; Dziadziuszko, R.; Jassem, J.; Rzyman, W.; Widlak, P. Serum lipid profile discriminates patients with early lung cancer from healthy controls. Lung Cancer 2017, 112, 69–74. [Google Scholar] [CrossRef] [PubMed]
- Khaniani, Y.; Lipfert, M.; Bhattacharyya, D.; Perez Pineiro, R.; Zheng, J.; Wishart, D.; Khaniani, Y.; Lipfert, M.; Bhattacharyya, D.; Perez Pineiro, R.; et al. A simple and convenient synthesis of unlabeled and 13C-labeled 3-(3-Hydroxyphenyl)-3-Hydroxypropionic acid and its quantification in human urine samples. Metabolites 2018, 8, 80. [Google Scholar] [CrossRef] [PubMed] [Green Version]
- Wishart, D.S. Computational approaches to metabolomics. In Methods in Molecular Biology; Clifton, N.J., Ed.; Humana Press Inc.: Totowa, NJ, USA, 2010; Volume 593, pp. 283–313. [Google Scholar]
- Jelonek, K.; Widłak, P. Metabolome-based biomarkers: Their potential role in the early detection of lung cancer. Contemp. Oncol. 2018, 22, 135. [Google Scholar] [CrossRef] [PubMed] [Green Version]
- Xiang, C.; Jin, S.; Zhang, J.; Chen, M.; Xia, Y.; Shu, Y.; Guo, R. Cortisol, cortisone, and 4-methoxyphenylacetic acid as potential plasma biomarkers for early detection of non-small cell lung cancer. Int. J. Biol. Mark. 2018, 33, 314–320. [Google Scholar] [CrossRef] [PubMed]
- Mazzone, P.J.; Wang, X.-F.; Beukemann, M.; Zhang, Q.; Seeley, M.; Mohney, R.; Holt, T.; Pappan, K.L. Metabolite profiles of the serum of patients with non–small cell carcinoma. J. Thorac. Oncol. 2016, 11, 72–78. [Google Scholar] [CrossRef] [Green Version]
- Li, Y.; Song, X.; Zhao, X.; Zou, L.; Xu, G. Serum metabolic profiling study of lung cancer using ultra high performance liquid chromatography/quadrupole time-of-flight mass spectrometry. J. Chromatogr. B 2014, 966, 147–153. [Google Scholar] [CrossRef]
- Zhang, Q.; Xu, H.; Liu, R.; Gao, P.; Yang, X.; Jin, W.; Zhang, Y.; Bi, K.; Li, Q. A novel strategy for targeted lipidomics based on LC-tandem-MS parameters prediction, quantification, and multiple statistical data mining: Evaluation of lysophosphatidylcholines as potential cancer biomarkers. Anal. Chem. 2019, 91, 3389–3396. [Google Scholar] [CrossRef]
- Ishikawa, M.; Maekawa, K.; Saito, K.; Senoo, Y.; Urata, M.; Murayama, M.; Tajima, Y.; Kumagai, Y.; Saito, Y. Plasma and serum lipidomics of healthy white adults shows characteristic profiles by subjects’ gender and age. PLoS ONE 2014, 9, e91806. [Google Scholar] [CrossRef] [Green Version]
- Yu, Z.; Kastenmüller, G.; He, Y.; Belcredi, P.; Möller, G.; Prehn, C.; Mendes, J.; Wahl, S.; Roemisch-Margl, W.; Ceglarek, U.; et al. Differences between human plasma and serum metabolite profiles. PLoS ONE 2011, 6, e21230. [Google Scholar] [CrossRef]
- Singhal, S.; Rolfo, C.; Maksymiuk, A.W.; Tappia, P.S.; Sitar, D.S.; Russo, A.; Akhtar, P.S.; Khatun, N.; Rahnuma, P.; Rashiduzzaman, A.; et al. Liquid biopsy in lung cancer screening: The contribution of metabolomics. Results of a pilot study. Cancers 2019, 11, 1069. [Google Scholar] [CrossRef] [PubMed] [Green Version]
- Cui, L.; Zheng, D.; Lee, Y.H.; Chan, T.K.; Kumar, Y.; Ho, W.E.; Chen, J.Z.; Tannenbaum, S.R.; Ong, C.N. Metabolomics investigation reveals metabolite mediators associated with acute lung injury and repair in a murine model of influenza pneumonia. Sci. Rep. 2016, 6, 26076. [Google Scholar] [CrossRef] [PubMed] [Green Version]
- Slupsky, C.M.; Rankin, K.N.; Fu, H.; Chang, D.; Rowe, B.H.; Charles, P.G.P.; McGeer, A.; Low, D.; Long, R.; Kunimoto, D.; et al. Pneumococcal pneumonia: Potential for diagnosis through a urinary metabolic profile. J. Prot. Res. 2009, 8, 5550–5558. [Google Scholar] [CrossRef] [PubMed]
- Frediani, J.K.; Jones, D.P.; Tukvadze, N.; Uppal, K.; Sanikidze, E.; Kipiani, M.; Tran, V.T.; Hebbar, G.; Walker, D.I.; Kempker, R.R.; et al. Plasma metabolomics in human pulmonary tuberculosis disease: A pilot study. PLoS ONE 2014, 9, e108854. [Google Scholar] [CrossRef] [PubMed] [Green Version]
- Mirsaeidi, M.; Banoei, M.M.; Winston, B.W.; Schraufnagel, D.E. Metabolomics: Applications and promise in mycobacterial disease. Ann. Am. Thorac. Soc. 2015, 12, 1278–1287. [Google Scholar] [CrossRef] [Green Version]
- Nobakht, F.; Aliannejad, R.; Rezaei-Tavirani, M.; Taheri, S.; Oskouie, A.A. The metabolomics of airway diseases, including COPD, asthma and cystic fibrosis. Biomarkers 2015, 20, 5–16. [Google Scholar] [CrossRef]
- Raynor, A.; Jantscheff, P.; Ross, T.; Schlesinger, M.; Wilde, M.; Haasis, S.; Dreckmann, T.; Bendas, G.; Massing, U. Saturated and mono-unsaturated lysophosphatidylcholine metabolism in tumour cells: A potential therapeutic target for preventing metastases. Lipids Health Dis. 2015, 14, 69. [Google Scholar] [CrossRef] [Green Version]
- Taylor, L.A.; Arends, J.; Hodina, A.K.; Unger, C.; Massing, U. Plasma lyso-phosphatidylcholine concentration is decreased in cancer patients with weight loss and activated inflammatory status. Lipids Health Dis. 2007, 6, 17. [Google Scholar] [CrossRef] [Green Version]
- Kühn, T.; Floegel, A.; Sookthai, D.; Johnson, T.; Rolle-Kampczyk, U.; Otto, W.; von Bergen, M.; Boeing, H.; Kaaks, R. Higher plasma levels of lysophosphatidylcholine 18:0 are related to a lower risk of common cancers in a prospective metabolomics study. BMC Med. 2016, 14, 13. [Google Scholar] [CrossRef] [Green Version]
- Joo, E.J.; Weyers, A.; Li, G.; Gasimli, L.; Li, L.; Choi, W.J.; Lee, K.B.; Linhardt, R.J. Carbohydrate-containing molecules as potential biomarkers in colon cancer. OMICS A J. Integr. Biol. 2014, 18, 231–241. [Google Scholar] [CrossRef] [Green Version]
- Fogarty, C.E.; Bergmann, A. The sound of silence: Signaling by apoptotic cells. Curr. Top. Dev. Biol. 2015, 114, 241–265. [Google Scholar] [PubMed] [Green Version]
- Chen, Y.; Ma, Z.; Zhong, J.; Li, L.; Min, L.; Xu, L.; Li, H.; Zhang, J.; Wu, W.; Dai, L. Simultaneous quantification of serum monounsaturated and polyunsaturated phosphatidylcholines as potential biomarkers for diagnosing non-small cell lung cancer. Sci. Rep. 2018, 8, 7137. [Google Scholar] [CrossRef] [PubMed]
- Rysman, E.; Brusselmans, K.; Scheys, K.; Timmermans, L.; Derua, R.; Munck, S.; Van Veldhoven, P.P.; Waltregny, D.; Daniels, V.W.; Machiels, J.; et al. De novo lipogenesis protects cancer cells from free radicals and chemotherapeutics by promoting membrane lipid saturation. Cancer Res. 2010, 70, 8117–8126. [Google Scholar] [CrossRef] [PubMed] [Green Version]
- Guo, S.; Wang, Y.; Zhou, D.; Li, Z. Significantly increased monounsaturated lipids relative to polyunsaturated lipids in six types of cancer microenvironment are observed by mass spectrometry imaging. Sci. Rep. 2015, 4, 5959. [Google Scholar] [CrossRef] [PubMed] [Green Version]
- Zabłocka-Słowińska, K.; Płaczkowska, S.; Prescha, A.; Pawełczyk, K.; Kosacka, M.; Porębska, I.; Grajeta, H. Systemic redox status in lung cancer patients is related to altered glucose metabolism. PLoS ONE 2018, 13, e0204173. [Google Scholar] [CrossRef] [PubMed]
- An, Y.J.; Cho, H.R.; Kim, T.M.; Keam, B.; Kim, J.W.; Wen, H.; Park, C.-K.; Lee, S.-H.; Im, S.-A.; Kim, J.E.; et al. An NMR metabolomics approach for the diagnosis of leptomeningeal carcinomatosis in lung adenocarcinoma cancer patients. Int. J. Cancer 2015, 136, 162–171. [Google Scholar] [CrossRef] [PubMed]
- Louis, E.; Adriaensens, P.; Guedens, W.; Bigirumurame, T.; Baeten, K.; Vanhove, K.; Vandeurzen, K.; Darquennes, K.; Vansteenkiste, J.; Dooms, C.; et al. Detection of lung cancer through metabolic changes measured in blood plasma. J. Thorac. Oncol. 2016, 11, 516–523. [Google Scholar] [CrossRef] [Green Version]
- Puchalska, P.; Crawford, P.A. Multi-dimensional roles of ketone bodies in fuel metabolism, signaling, and therapeutics. Cell Metab. 2017, 25, 262–284. [Google Scholar] [CrossRef] [Green Version]
- Bonuccelli, G.; Tsirigos, A.; Whitaker-Menezes, D.; Pavlides, S.; Pestell, R.G.; Chiavarina, B.; Frank, P.G.; Flomenberg, N.; Howell, A.; Martinez-Outschoorn, U.E.; et al. Ketones and lactate “fuel” tumor growth and metastasis. Cell Cycle 2010, 9, 3506–3514. [Google Scholar] [CrossRef]
- Linehan, W.M.; Rouault, T.A. Molecular pathways: Fumarate hydratase-deficient kidney cancer--targeting the warburg effect in cancer. Clin. Cancer Res. 2013, 19, 3345–3352. [Google Scholar] [CrossRef] [Green Version]
- Isaacs, J.S.; Jung, Y.J.; Mole, D.R.; Lee, S.; Torres-Cabala, C.; Chung, Y.-L.; Merino, M.; Trepel, J.; Zbar, B.; Toro, J.; et al. HIF overexpression correlates with biallelic loss of fumarate hydratase in renal cancer: Novel role of fumarate in regulation of HIF stability. Cancer Cell 2005, 8, 143–153. [Google Scholar] [CrossRef] [PubMed] [Green Version]
- King, A.; Selak, M.A.; Gottlieb, E. Succinate dehydrogenase and fumarate hydratase: Linking mitochondrial dysfunction and cancer. Oncogene 2006, 25, 4675–4682. [Google Scholar] [CrossRef] [PubMed] [Green Version]
- Wishart, D.S. Is cancer a genetic disease or a metabolic disease? EBioMedicine 2015, 2, 478–479. [Google Scholar] [CrossRef] [PubMed] [Green Version]
- Obre, E.; Rossignol, R. Emerging concepts in bioenergetics and cancer research: Metabolic flexibility, coupling, symbiosis, switch, oxidative tumors, metabolic remodeling, signaling and bioenergetic therapy. Int. J. Biochem. Cell Biol. 2015, 59, 167–181. [Google Scholar] [CrossRef]
- Hori, S.; Nishiumi, S.; Kobayashi, K.; Shinohara, M.; Hatakeyama, Y.; Kotani, Y.; Hatano, N.; Maniwa, Y.; Nishio, W.; Bamba, T.; et al. A metabolomic approach to lung cancer. Lung Cancer 2011, 74, 284–292. [Google Scholar] [CrossRef]
- Fan, T.W.M.; Lane, A.N.; Higashi, R.M.; Farag, M.A.; Gao, H.; Bousamra, M.; Miller, D.M. Altered regulation of metabolic pathways in human lung cancer discerned by (13)C stable isotope-resolved metabolomics (SIRM). Mol. Cancer 2009, 8, 41. [Google Scholar] [CrossRef] [Green Version]
- Deja, S.; Porebska, I.; Kowal, A.; Zabek, A.; Barg, W.; Pawelczyk, K.; Stanimirova, I.; Daszykowski, M.; Korzeniewska, A.; Jankowska, R.; et al. Metabolomics provide new insights on lung cancer staging and discrimination from chronic obstructive pulmonary disease. J. Pharm. Biomed. Anal. 2014, 100, 369–380. [Google Scholar] [CrossRef]
- Klupczynska, A.; Dereziński, P.; Garrett, T.J.; Rubio, V.Y.; Dyszkiewicz, W.; Kasprzyk, M.; Kokot, Z.J. Study of early stage non-small-cell lung cancer using Orbitrap-based global serum metabolomics. J. Cancer Res. Clin. Oncol. 2017, 143, 649–659. [Google Scholar] [CrossRef] [Green Version]
- Rodrigues, D.; Jerónimo, C.; Henrique, R.; Belo, L.; de Bastos, M.L.; de Pinho, P.G.; Carvalho, M. Biomarkers in bladder cancer: A metabolomic approach using in vitro and ex vivo model systems. Int. J. Cancer 2016, 139, 256–268. [Google Scholar] [CrossRef] [Green Version]
- Fan, Y.; Zhou, X.; Xia, T.-S.; Chen, Z.; Li, J.; Liu, Q.; Alolga, R.N.; Chen, Y.; Lai, M.-D.; Li, P.; et al. Human plasma metabolomics for identifying differential metabolites and predicting molecular subtypes of breast cancer. Oncotarget 2016, 7, 9925–9938. [Google Scholar] [CrossRef] [Green Version]
- Zhang, F.; Zhang, Y.; Zhao, W.; Deng, K.; Wang, Z.; Yang, C.; Ma, L.; Openkova, M.S.; Hou, Y.; Li, K. Metabolomics for biomarker discovery in the diagnosis, prognosis, survival and recurrence of colorectal cancer: A systematic review. Oncotarget 2017, 8, 35460–35472. [Google Scholar] [CrossRef] [PubMed] [Green Version]
- Flanagan, J.L.; Simmons, P.A.; Vehige, J.; Willcox, M.D.; Garrett, Q. Role of carnitine in disease. Nutr. Metab. (Lond.) 2010, 7, 30. [Google Scholar] [CrossRef] [PubMed] [Green Version]
- Melone, M.A.B.; Valentino, A.; Margarucci, S.; Galderisi, U.; Giordano, A.; Peluso, G. The carnitine system and cancer metabolic plasticity. Cell Death Dis. 2018, 9, 228. [Google Scholar] [CrossRef] [PubMed] [Green Version]


| Discovery Set | |||||||||||
| Group | Number of Samples | Age | Histology | Gender | Smoking Status | ||||||
| Range | Median | Adenocarcinoma | Squamous Cell Carcinoma | Male | Female | Never | Former | Current | Median Pack * Years (Former + Current) | ||
| Stage I NSCLC | 47 | 49–79 | 66 | 32 | 15 | 18 | 29 | 10 | 26 | 11 | 36 |
| Stage II NSCLC | 40 | 49–79 | 61.5 | 29 | 11 | 11 | 29 | 3 | 34 | 3 | 34 |
| Stage IIIB/IV NSCLC | 26 | 42–79 | 63 | 20 | 6 | 14 | 12 | 0 | 18 | 8 | 43 |
| Healthy control | 40 | 49–77 | 62.5 | NA | NA | 18 | 22 | 25 | 15 | 0 | 11 |
| Total | 153 | 42–79 | 64 | 81 | 32 | 61 | 92 | 57 | 131 | 28 | 33 |
| Validation Set | |||||||||||
| Group | Number of Samples | Age | Histology | Gender | Smoking Status | ||||||
| Range | Median | Adenocarcinoma | Squamous Cell Carcinoma | Male | Female | Never | Former | Current | Median Pack * Years (Former + Current) | ||
| Stage I NSCLC | 23 | 49–78 | 65 | 18 | 5 | 8 | 15 | 4 | 14 | 5 | 35 |
| Stage II NSCLC | 20 | 51–78 | 64 | 11 | 9 | 9 | 11 | 2 | 16 | 2 | 38 |
| Healthy control | 20 | 49–77 | 62.5 | NA | NA | 8 | 12 | 13 | 7 | 0 | 5 |
| Total | 63 | 49–78 | 65 | 29 | 14 | 25 | 38 | 57 | 131 | 28 | 27 |
| Logistic Model with Selected Compounds: | |||||||
| log(P/(1 − P)) = 0.258 − 1.341 × PC ae C40:6 + 1.747 × LysoPC 20:3 + 0.913 × β-hydroxybutyric acid + 0.939 × Fumaric acid. The optimal cut-off point for the above equation is 0.69. | |||||||
| Logistic Regression Model—Summary of Each Feature: | |||||||
| Estimate | Std. Error | z Value | Pr(>|z|) | Odds | |||
| (Intercept) | 0.258 | 0.352 | 0.733 | 0.463 | - | ||
| LysoPC 20:3 | 1.747 | 0.518 | 3.37 | 0.001 | 5.73 | ||
| β-Hydroxybutyric acid | 0.913 | 0.404 | 2.263 | 0.024 | 2.49 | ||
| Fumaric acid | 0.939 | 0.446 | 2.106 | 0.035 | 2.56 | ||
| PC ae C40:6 | −1.341 | 0.465 | −2.884 | 0.001 | 0.26 | ||
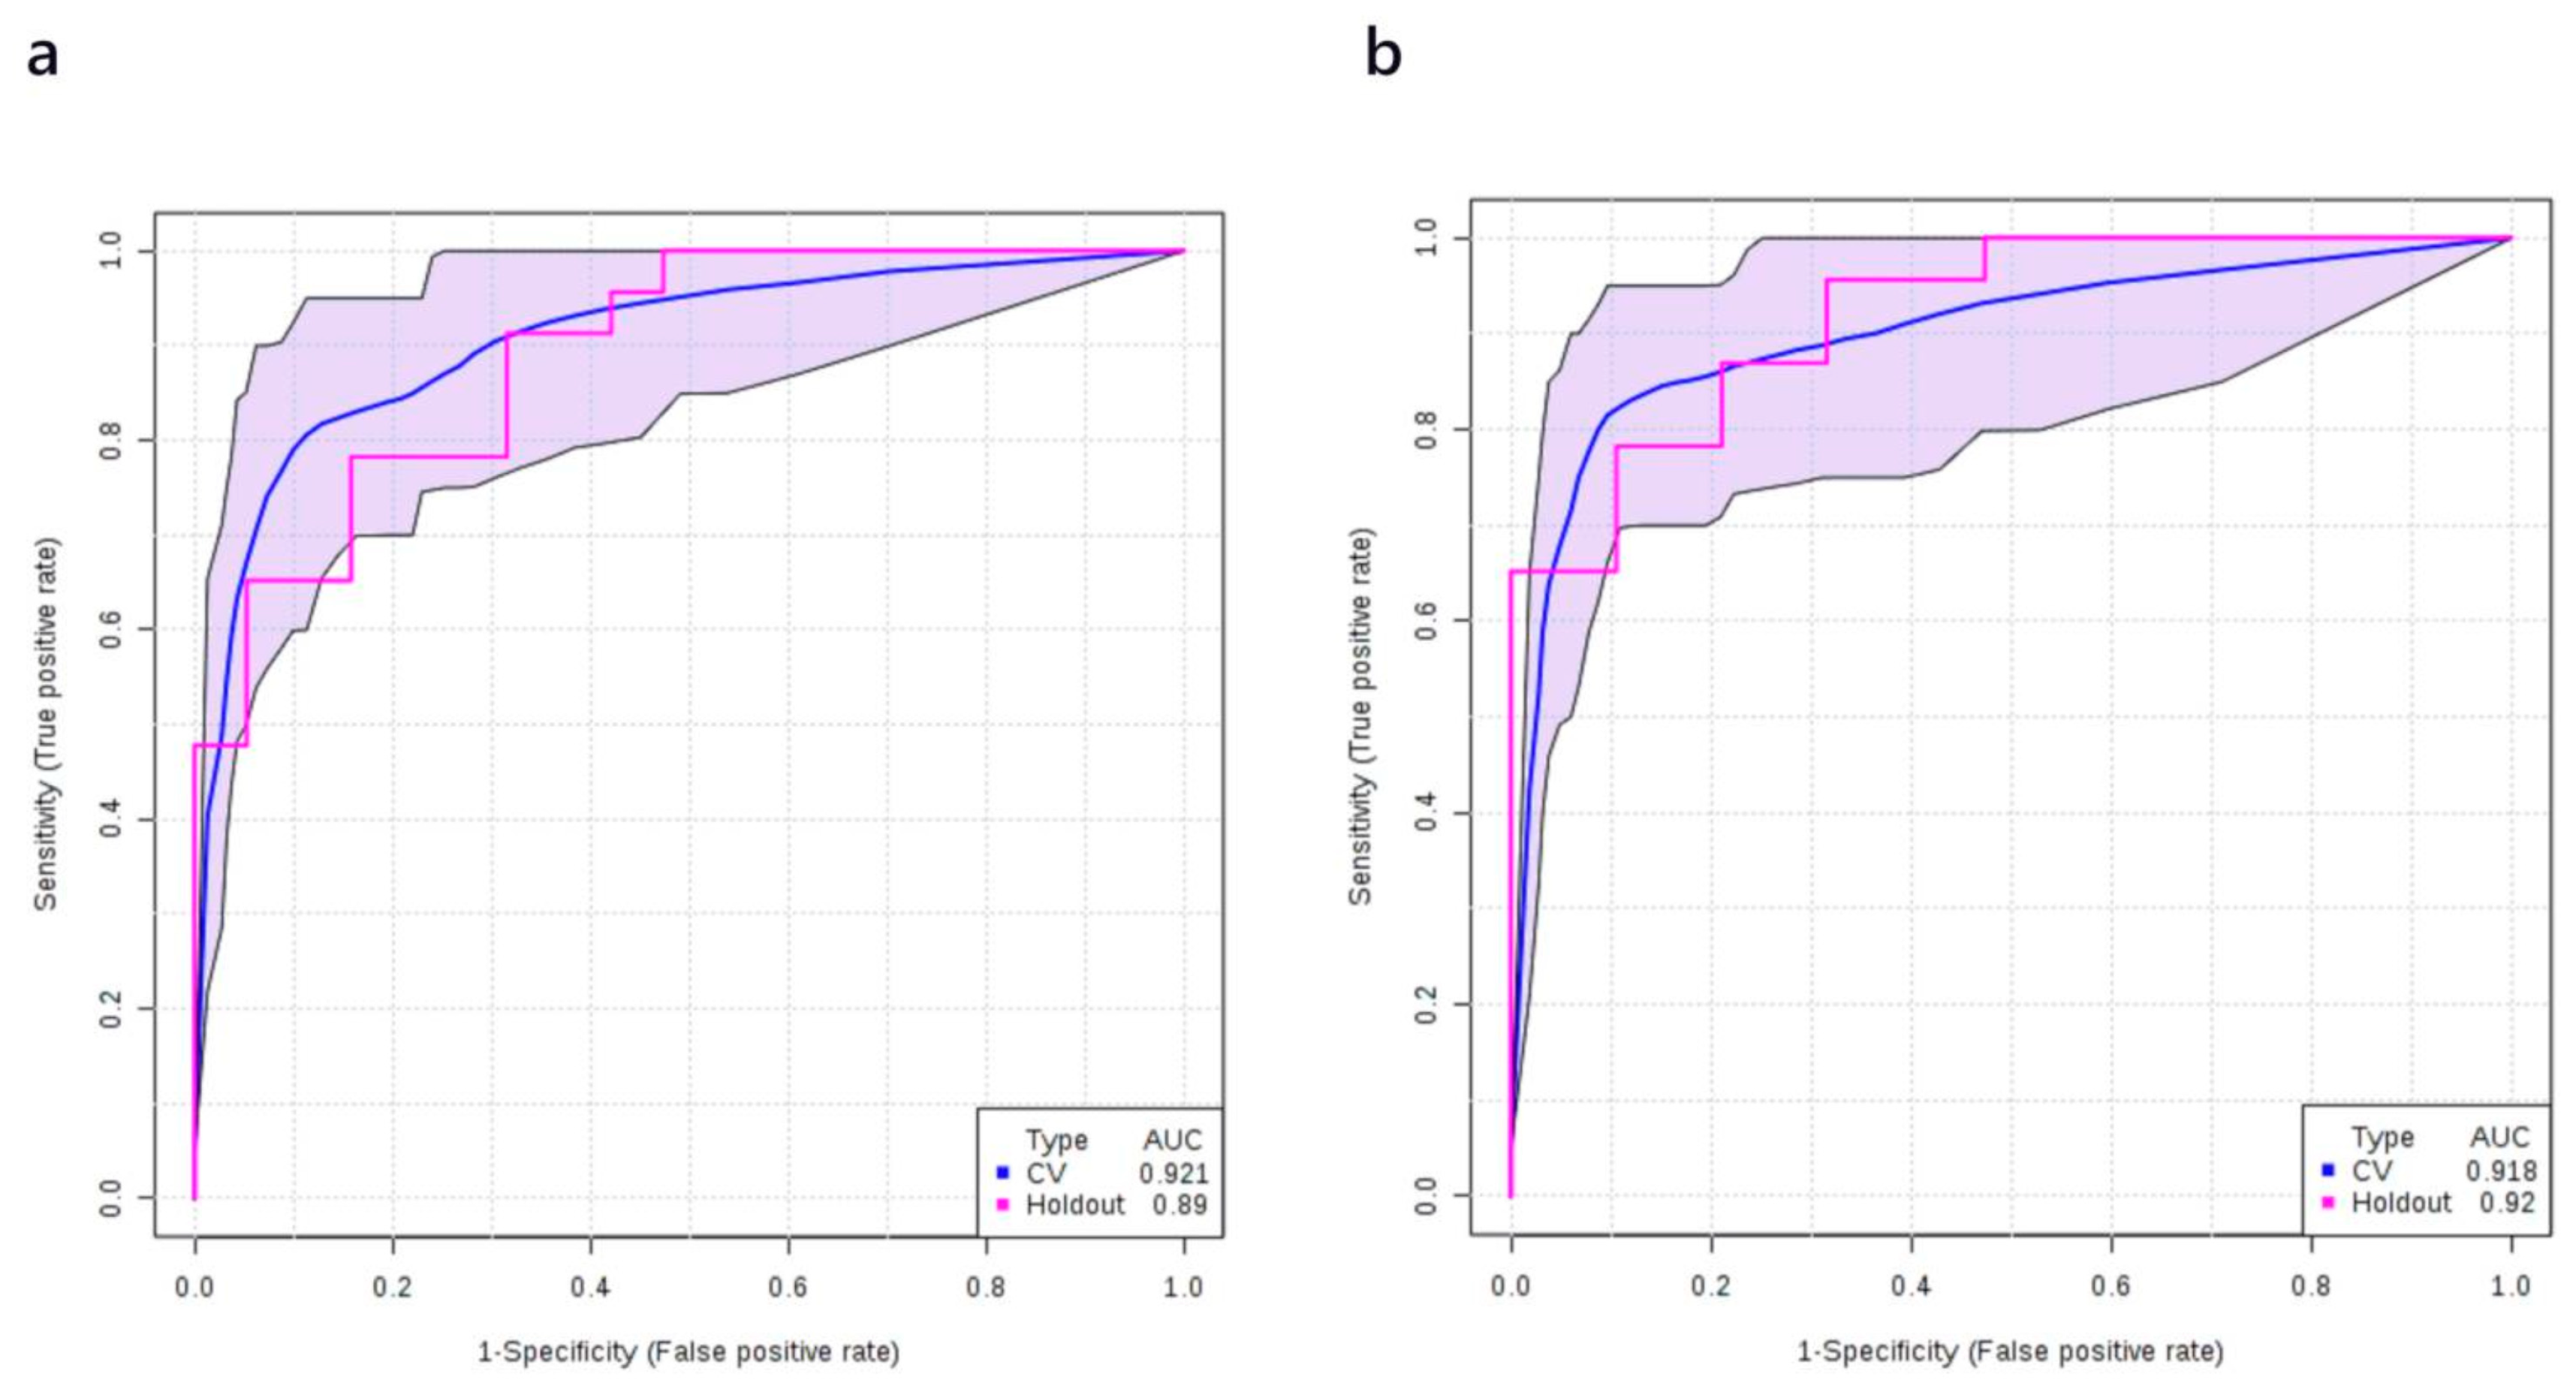
| Performance of Logistic Regression Model: | |||||||
| AUC | Sensitivity | Specificity | |||||
| Training/discovery | 0.939 (0.924–0.955) | 0.827 (0.791–0.863) | 0.957 (0.936–0.977) | ||||
| 10-fold cross-validation | 0.923 (0.866–0.980) | 0.830 (0.830–0.937) | 0.927 (0.847–1.000) | ||||
| Logistic Model with Selected Compounds: | |||||||
| logit(P) = log(P/(1 − P)) = 0.311 + 0.641 × Amount of smoking − 1.372 × PC ae C40:6 + 1.623 × LysoPC 20:3 + 0.882 × β-hydroxybutyric acid + 0.65 × Fumaric acid. The optimal cut-off point for the above equation is 0.74. | |||||||
| Logistic Regression Model—Summary of Each Feature: | |||||||
| Estimate | Std. Error | z Value | Pr(>|z|) | Odds | |||
| (Intercept) | 0.311 | 0.369 | 0.843 | 0.399 | - | ||
| Amount of smoking | 0.641 | 0.382 | 1.676 | 0.094 | 1.9 | ||
| PC ae C40:6 | −1.372 | 0.475 | −2.886 | 0.004 | 0.25 | ||
| LysoPC 20:3 | 1.623 | 0.495 | 3.281 | 0.001 | 5.07 | ||
| β-Hydroxybutyric acid | 0.882 | 0.419 | 2.105 | 0.035 | 2.42 | ||
| Fumaric acid | 0.65 | 0.474 | 1.373 | 0.17 | 1.92 | ||
| Performance of Logistic Regression Model: | |||||||
| AUC | Sensitivity | Specificity | |||||
| Training/discovery | 0.942 (0.926–0.957) | 0.844 (0.809–0.879) | 0.951 (0.929–0.973) | ||||
| 10-fold cross-validation | 0.922 (0.864–0.979) | 0.851 (0.851–0.953) | 0.951 (0.882–1.000) | ||||
| Logistic Model with Selected Compounds: | |||||||
| logit(P) = log(P/(1 − P)) = 0.346 + 2.565 × β-hydroxybutyric acid − 2.219 × Citric acid + 2.904 × Carnitine − 1.599 × PC ae C40:6. The optimal cut-off point for the above equation is 0.34. | |||||||
| Logistic Regression Model—Summary of Each Feature: | |||||||
| Estimate | Std. Error | z Value | Pr(>|z|) | Odds | |||
| (Intercept) | 0.346 | 0.516 | 0.671 | 0.502 | - | ||
| β-Hydroxybutyric acid | 2.565 | 0.861 | 2.981 | 0.003 | 13.93 | ||
| Citric acid | −2.219 | 0.804 | −2.758 | 0.006 | 0.11 | ||
| Carnitine | 2.904 | 0.976 | 2.975 | 0.003 | 18.24 | ||
| PC ae C40:6 | −1.599 | 0.765 | −2.091 | 0.037 | 0.2 | ||
| Performance of Logistic Regression Model: | |||||||
| AUC | Sensitivity | Specificity | |||||
| Training/discovery | 0.980 (0.973–0.987) | 0.958 (0.938–0.979) | 0.881 (0.854–0.909) | ||||
| 10-fold cross-validation | 0.952 (0.909–0.995) | 0.875 (0.875–0.977) | 0.875 (0.773–0.977) | ||||
| Logistic Model with Selected Compounds: | |||||||
| logit(P) = log(P/(1 − P)) = 0.098 + 1.489 × Amount of smoking + 2.911 × β-hydroxybutyric acid − 1.627 × Citric acid + 2.605 × Carnitine − 0.702 × PC ae C40:6. The optimal cut-off point for the above equation is 0.25. | |||||||
| Logistic Regression Model—Summary of Each Feature: | |||||||
| Estimate | Std. Error | z Value | Pr(>|z|) | Odds | |||
| (Intercept) | −0.098 | 0.612 | 0.159 | 0.873 | - | ||
| Amount of smoking | 1.489 | 0.915 | 1.627 | 0.104 | 4.43 | ||
| β-Hydroxybutyric acid | 2.911 | 1.132 | 2.572 | 0.01 | 18.37 | ||
| Citric acid | −1.627 | 0.864 | −1.883 | 0.06 | 0.2 | ||
| Carnitine | 2.605 | 0.936 | 2.784 | 0.005 | 13.53 | ||
| PC ae C40:6 | −0.702 | 0.862 | −0.814 | 0.416 | 0.5 | ||
| Performance of Logistic Regression Model: | |||||||
| AUC | Sensitivity | Specificity | |||||
| Training/discovery | 0.985 (0.979–0.991) | 0.972 (0.955–0.989) | 0.875 (0.841–0.909) | ||||
| 10-fold cross-validation | 0.948 (0.900–0.996) | 0.925 (0.925–1.000) | 0.850 (0.739–0.961) | ||||
| Logistic Model with Selected Compounds: | |||||||
| logit(P) = log(P/(1 − P)) = 2.346 − 1.528 × PC ae C40:6 + 1.429 × β-hydroxybutyric acid − 2.481 × Citric acid + 1.03 × LysoPC 20:3 + 1.773 × Fumaric acid. The optimal cut-off point for the above equation is 0.62. | |||||||
| Logistic Regression Model—Summary of Each Feature: | |||||||
| Estimate | Std. Error | z Value | Pr(>|z|) | Odds | |||
| (Intercept) | 2.346 | 0.588 | 3.991 | <0.001 | - | ||
| PC ae C40:6 | −1.528 | 0.61 | −2.507 | 0.012 | 0.22 | ||
| β-Hydroxybutyric acid | 1.429 | 0.505 | 2.832 | 0.005 | 4.18 | ||
| Citric acid | −2.481 | 0.642 | −3.863 | <0.001 | 0.08 | ||
| LysoPC 20:3 | 1.03 | 0.508 | 2.028 | 0.043 | 2.8 | ||
| Fumaric acid | 1.773 | 0.569 | 3.117 | 0.002 | 5.89 | ||
| Performance of Logistic Regression Model: | |||||||
| AUC | Sensitivity | Specificity | |||||
| Training/discovery | 0.974 (0.965–0.982) | 0.937 (0.920–0.954) | 0.922 (0.895–0.950) | ||||
| 10-fold cross-validation | 0.959 (0.923–0.995) | 0.919 (0.919–0.976) | 0.900 (0.807–0.993) | ||||
| Logistic Model with Selected Compounds: | |||||||
| logit(P) = log(P/(1 − P)) = 2.427 + 1.425 × Amount of smoking − 1.414 × PC ae C40:6 + 1.414 × β-hydroxybutyric acid − 2.193 × Citric acid + 1.738 × LysoPC 20:3 + 1.44 × Fumaric acid. The optimal cut-off point for the above equation is 0.66. | |||||||
| Logistic Regression Model—Summary of Each Feature: | |||||||
| Estimate | Std. Error | z Value | Pr(>|z|) | Odds | |||
| (Intercept) | 2.427 | 0.638 | 3.803 | <0.001 | - | ||
| Amount of smoking | 1.425 | 0.507 | 2.813 | 0.005 | 4.16 | ||
| PC ae C40:6 | −1.048 | 0.64 | −1.637 | 0.102 | 0.35 | ||
| β-Hydroxybutyric acid | 1.414 | 0.594 | 2.379 | 0.017 | 4.11 | ||
| Citric acid | −2.193 | 0.719 | −3.051 | 0.002 | 0.11 | ||
| LysoPC 20:3 | 1.738 | 0.739 | 2.351 | 0.019 | 5.68 | ||
| Fumaric acid | 1.44 | 0.612 | 2.352 | 0.019 | 4.22 | ||
| Performance of Logistic Regression Model: | |||||||
| AUC | Sensitivity | Specificity | |||||
| Training/discovery | 0.982 (0.975–0.990) | 0.960 (0.946–0.974) | 0.944 (0.921–0.968) | ||||
| 10-fold cross-validation | 0.965 (0.930–1.000) | 0.930 (0.930–0.984) | 0.925 (0.843–1.000) | ||||
© 2020 by the authors. Licensee MDPI, Basel, Switzerland. This article is an open access article distributed under the terms and conditions of the Creative Commons Attribution (CC BY) license (http://creativecommons.org/licenses/by/4.0/).
Share and Cite
Zhang, L.; Zheng, J.; Ahmed, R.; Huang, G.; Reid, J.; Mandal, R.; Maksymuik, A.; Sitar, D.S.; Tappia, P.S.; Ramjiawan, B.; et al. A High-Performing Plasma Metabolite Panel for Early-Stage Lung Cancer Detection. Cancers 2020, 12, 622. https://doi.org/10.3390/cancers12030622
Zhang L, Zheng J, Ahmed R, Huang G, Reid J, Mandal R, Maksymuik A, Sitar DS, Tappia PS, Ramjiawan B, et al. A High-Performing Plasma Metabolite Panel for Early-Stage Lung Cancer Detection. Cancers. 2020; 12(3):622. https://doi.org/10.3390/cancers12030622
Chicago/Turabian StyleZhang, Lun, Jiamin Zheng, Rashid Ahmed, Guoyu Huang, Jennifer Reid, Rupasri Mandal, Andrew Maksymuik, Daniel S. Sitar, Paramjit S. Tappia, Bram Ramjiawan, and et al. 2020. "A High-Performing Plasma Metabolite Panel for Early-Stage Lung Cancer Detection" Cancers 12, no. 3: 622. https://doi.org/10.3390/cancers12030622