Chapter 1: life expectancy and healthy life expectancy
Published 13 July 2017

© Crown copyright 2017
This publication is licensed under the terms of the Open Government Licence v3.0 except where otherwise stated. To view this licence, visit nationalarchives.gov.uk/doc/open-government-licence/version/3 or write to the Information Policy Team, The National Archives, Kew, London TW9 4DU, or email: psi@nationalarchives.gov.uk.
Where we have identified any third party copyright information you will need to obtain permission from the copyright holders concerned.
This publication is available at https://www.gov.uk/government/publications/health-profile-for-england/chapter-1-life-expectancy-and-healthy-life-expectancy
1. Main messages
Provisional data for 2016 indicate that life expectancy at birth has now reached 79.5 years for males and 83.1 years for females.
The latest data on healthy life expectancy (the number of years lived in self-assessed good health) (2013 to 2015) show that it is now 63.4 for males and 64.1 for females.
Since 2000 to 2002, both life expectancy and healthy life expectancy have increased; the population is now living longer and spending more years in good health.
Since 2000 to 2002, life expectancy has increased by more years than healthy life expectancy and therefore the number of years lived in poor health has also increased slightly; in 2013 to 2015 it was 16.1 years for males and 19.0 years for females. However, the proportion of life spent in poor health has remained stable and these data do not take into account trends in the types and severity of diseases over time.
Although females still live longer than males, the gap between the sexes has decreased over time and is now 3.6 years. However, the majority of these extra years of life among females were spent in poor health; females lived 3.6 years longer than males in 2013 to 2015, but only had 0.7 years longer in good health.
Since 2000 to 2002, life expectancy, years spent in good health and the years spent in poor health from age 65 have also increased. The proportion of life spent in poor health has also increased slightly.
2. Introduction
Average life expectancy has increased steadily in England in recent decades (figure 1). Less than a century ago, deaths from infectious diseases were common [footnote 1] and often death would follow a relatively short period of illness. However, chronic non-communicable diseases are now the leading causes of death (chapter 2) and long periods of moderate and severe ill health often precede death.
We have an ageing population: in the UK there are now half a million people in their 90s, more than two and half times the number in 1985 [footnote 6]. The older a person is, the more likely they are to suffer from chronic conditions such as dementia, diabetes and arthritis.
This chapter looks at trends in the following measures:
- life expectancy (the average number of years that an individual is expected to live based on current mortality rates)
- healthy life expectancy (the average number of years that an individual is expected to live in a state of self-assessed good or very good health, based on current mortality rates and prevalence of good or very good health)
- the average number of years lived in poor health (the difference between life expectancy and healthy life expectancy)
- proportion of life spent in poor health (number of years in poor health as a percentage of life expectancy)
Further details on these measures are provided in the Definitions section.
Average life expectancy and healthy life expectancy are both important headline measures of the health status of the population. The healthy life expectancy measure adds a ‘quality of life’ dimension to estimates of life expectancy by dividing it into time spent in different states of health. The number of years of life in poor health is also important as it relates more closely to the demand for health and social care and the associated costs.
However, when comparing outcomes for groups with very different life expectancies, the proportion of life spent in poor health is also useful. Two populations may both spend on average 15 years in poor health which might be a quarter of life for a group with life expectancy of 60, but only a sixth for a group with life expectancy of 90.
3. Life expectancy and healthy life expectancy at birth
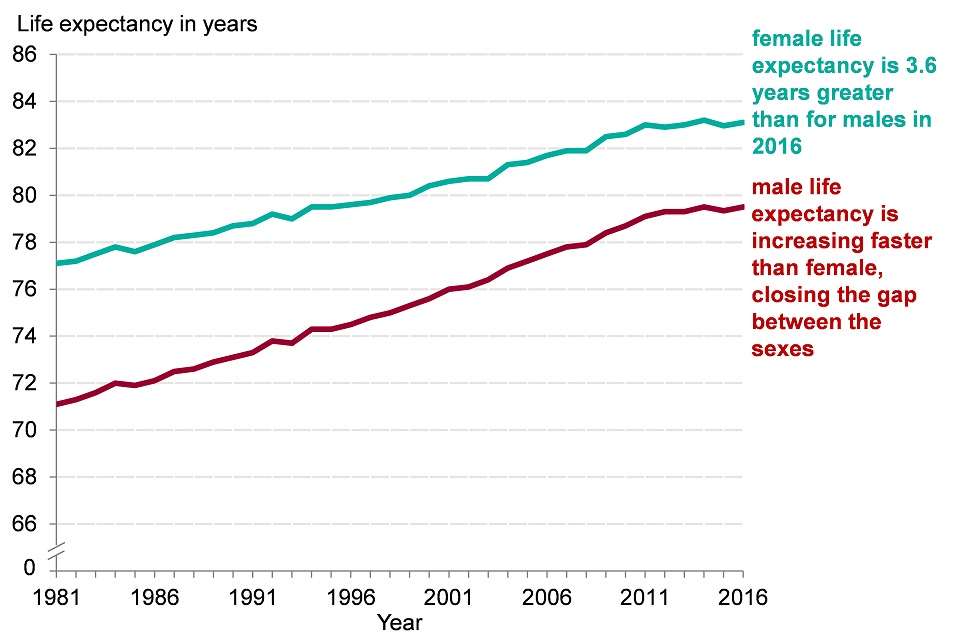
Life expectancy at birth in England has generally increased in recent decades and provisional data for 2016 show that it has reached 79.5 years for males and 83.1 for females (figure 1). In recent decades male life expectancy has increased faster than that for females and the gap in life expectancy is now less than 4 years, whereas in 1981 it was 6 years.
Figure 1 shows that life expectancy at birth increased by just over 3 months per year from 1981 to 2011, while for females the rate was just over 2 months per year. Since 2011 the rate of increase in life expectancy has slowed for both males and females.
3.1 Figure 1: life expectancy at birth for males and females 1981 to 2016
Life expectancy for males and females has been rising over recent decades
Source: Office for National Statistics life expectancy data for single years. Data for 2016 are provisional and produced by Public Health England.
This shows:
- in 2016 male life expectancy was 79.5 years and female life expectancy was 83.1 years
- male life expectancy was 6 years lower than female life expectancy in 1981
- between 1981 and 2016 the gap in life expectancy between males and females declined to under 4 years
- male life expectancy increased at just over 3 months per year from 1981 to 2011, while for females the rate was just over 2 months per year
- since 2011 the increase has slowed for both males and females
3.2 Table 1: life expectancy, healthy life expectancy, number of years in poor health and proportion of life spent in poor health; Males and females at birth and age 65, England 2013 to 2015
| At birth | At birth | At age 65 | At age 65 | |
|---|---|---|---|---|
| Males | Females | Males | Females | |
| Life expectancy | 79.5 | 83.1 | 18.7 | 21.1 |
| Healthy life expectancy | 63.4 | 64.1 | 10.5 | 11.2 |
| Number of years in poor health | 16.1 | 19.0 | 8.2 | 9.9 |
| % of life in poor health | 20.3 | 22.9 | 43.9 | 46.9 |
See the full data source: ONS
Healthy life expectancy has remained much lower than life expectancy and data for 2013 to 2015 from ONS indicate that it is now 63.4 years for males and 64.1 for females.
Although females live longer than males, in 2013 to 2015 there was little difference in the level of healthy life expectancy and therefore females spent more years in poor health than males (19.0 years compared with 16.1 years for males) and the proportion of life spent in poor health was greater for females than males (22.9% compared with 20.3%) (table 1). This demonstrates that the majority of the extra years of life that females had over males were spent in poor health; females lived 3.6 years longer than males in 2013 to 2015, but had only 0.7 years longer in a healthy life. Therefore 2.9 of these extra years were spent in poor health.
Due to the need to provide comparable data for healthy life expectancy over a long time period, the remainder of this chapter focuses on data up to 2012 to 2014 only. Data for 2013 to 2015 are based on a new methodology that is not directly comparable with the earlier period (table 1).
Figure 2 shows that male life expectancy increased by 3.5 years between 2000 to 2002 and 2012 to 2014, and healthy life expectancy increased by 2.8 years. Although both of these measures have shown an increase, life expectancy has increased by more years than healthy life expectancy and therefore males had an increase in the number of years spent in poor health as well as good health. The same was also true for females (figure 3), however, the proportion of life spent in poor health remained at 20% for males and 23% for females.
It is also important to note that this measure of years spent in poor health is self-reported and doesn’t adjust for the severity of ill health or the types of conditions that may be present. Years lived with ill health and disability (morbidity) adjusted for severity of disease are presented in Chapter 3.
3.3 Figure 2. Life expectancy, healthy life expectancy and years spent in poor health from birth, males 2000 to 2002 up to 2012 to 2014
For males, years in good health and poor health have increased
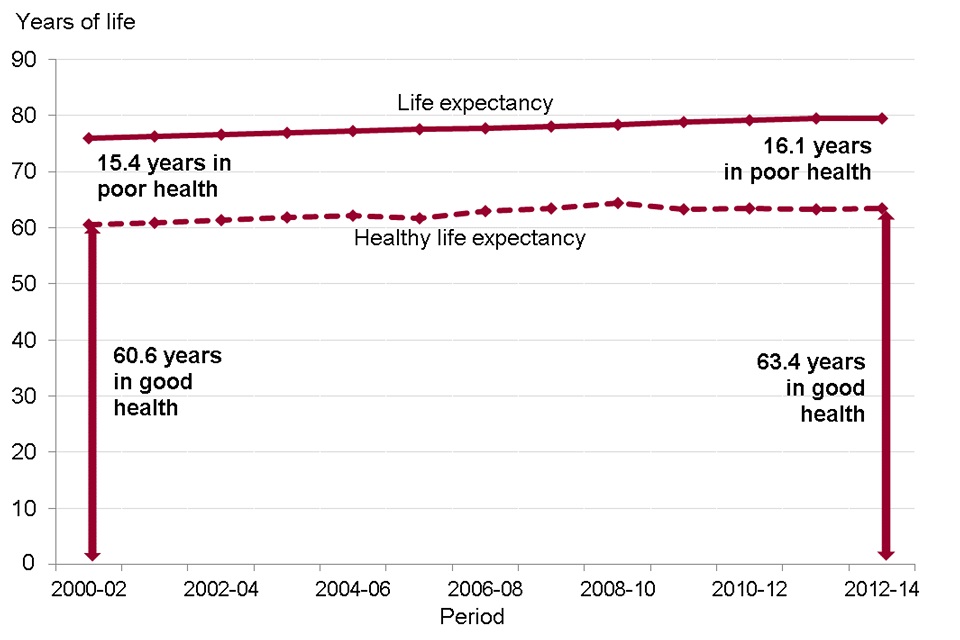
Source: Healthy life expectancies and life expectancies from ONS reports, with prevalence of good health derived from their surveys: General Household Survey/General Lifestyle Survey for years 2000 to 2002 up to 2008 to 2010, and the Annual Population Survey for years 2009 to 2011 up to 2012 to 2014.
Note: Data for 2000 to 2002 up to 2004 to 2006 have been adjusted to account for later methodology and survey changes.
This shows:
- life expectancy for males increased from 76.0 years to 79.5 years, a gain of 3.5 years
- male healthy life expectancy increased from 60.6 to 63.4 years, a gain of 2.8 years
- years in poor health (the difference between life expectancy and healthy life expectancy) increased slightly from 15.4 years to 16.1 years, however, the proportion of life males spent in poor health did not change significantly and remained at around 20%
3.4 Figure 3: life expectancy, healthy life expectancy and years spent in poor health from birth, females 2000 to 2002 up to 2012 to 2014
For females, years in good health and poor health have increased
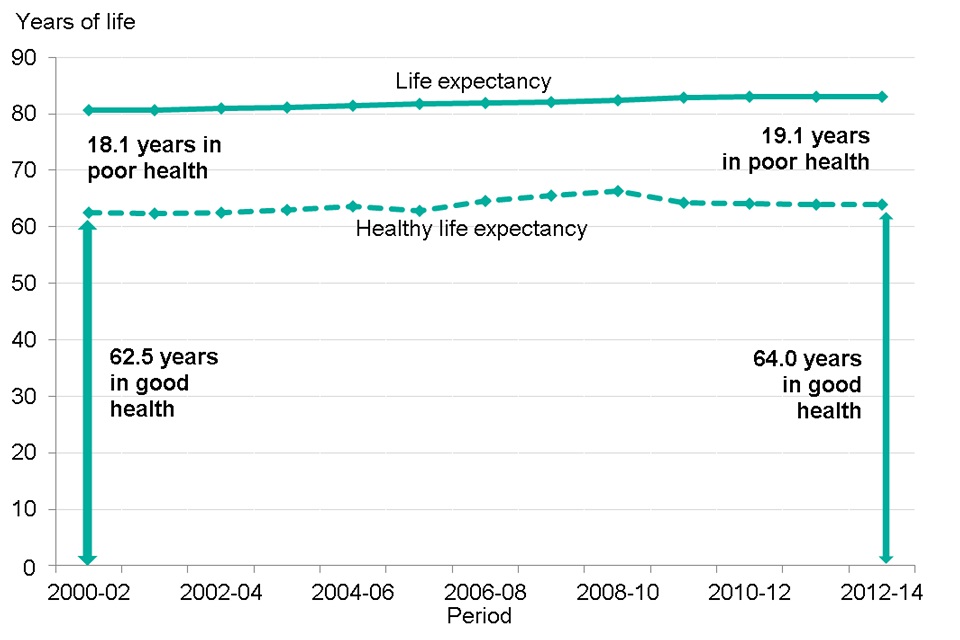
Source: Healthy life expectancies and life expectancies from ONS reports, with prevalence of good health derived from their surveys: General Household Survey/General Lifestyle Survey for years 2000 to 2002 up to 2008 to 2010, and the Annual Population Survey for years 2009 to 2011 up to 2012 to 2014.
Note: Data for 2000 to 2002 up to 2004 to 2006 have been adjusted to account for later methodology and survey changes.
This shows:
- life expectancy for females increased from 80.6 years to 83.1 years, a gain of 2.5 years
- healthy life expectancy at birth for females increased from 62.5 to 64.0 years, a gain of 1.5 years
- years in poor health (the difference between life expectancy and healthy life expectancy) increased from 18.1 years to 19.1 years. However, the proportion of life spent in poor health did not change significantly and remained at around 23%
4. Life expectancy and healthy life expectancy at age 65
The trend in life expectancy and healthy life expectancy at age 65 has also been upwards in recent decades. Once they reach the age of 65, in 2012 to 2014, males could expect to live an additional 18.8 years and females an additional 21.2 years.
For both males and females at age 65, the absolute increases in life expectancy have been greater than the absolute increase in healthy life expectancy and as a consequence, there has been an increase in the number of years lived in poor health.
For males, this has increased from 6.7 years in 2000 to 2002 to 8.2 years in 2012 to 2014 (figure 4), while for females it has risen from 8.3 years in 2000 to 2002 to 9.7 years in 2012 to 2014 (figure 4).
The proportion of life from age 65 spent in poor health has also increased slightly for both sexes. For males, it has increased from 41.6% in 2000 to 2002 to 43.6% in 2012 to 2014, and for females, it increased from 43.2% in 2000 to 2002 to 45.8% in 2012 to 2014.
These trends suggest an increase in the proportion of life spent in poor health from age 65 for both males and females, while the proportion of life from birth spent in poor health has remained stable. Although it is not quantified here, this indicates that the percentage of life spent in poor health at younger ages has decreased over time[footnote 2],[footnote 3].
4.1 Figure 4: years spent in poor health from age 65, males and females 2000 to 2002 up to 2012 to 2014
For both sexes years in poor health from age 65 has increased

Source: Healthy life expectancies and life expectancies from ONS reports, with prevalence of good health derived from their surveys: General Household Survey/General Lifestyle Survey for years 2000 to 2002 up to 2008 to 2010, and the Annual Population Survey for years 2009 to 2011 up to 2012 to 2014.
Note: Data for 2000 to 2002 up to 2004 to 2006 have been adjusted to account for later methodology and survey changes.
This shows:
- for both males and females there has been an increase in years spent in both good health and poor health since 2000 to 2002
- the number of years spent in poor health from age 65 increased by 1.5 years for males and 1.4 years for females, and years in good health increased by 1.2 years in males and 0.6 years in females
- the proportion of remaining life spent in poor health also increased for both males and females
5. Further information
The data presented in this chapter show a high-level picture of trends in life expectancy and health in England. These trends are influenced by changes in patterns of mortality (chapter 2) and changes in the prevalence of disease over time (chapter 3).
In addition, these high-level trends conceal inequalities between different parts of the country and different population groups (chapter 5).
Data from the Global Burden of Disease (GBD) model are an alternative source of trends in life expectancy and healthy life expectancy. It shows similar results to the data presented in this chapter, an increase in life expectancy with smaller absolute increases in healthy life expectancy since the earlier point of 1990.
6. Definitions
Life expectancy
Life expectancy at birth is the average number of years that would be lived by babies born in a given time period if mortality levels at each age remain constant. Similarly, life expectancy at age 65 is the average number of remaining years of life that a man or woman aged 65 will have if mortality levels at each age over 65 remain constant.
Healthy life expectancy
Healthy life expectancy at birth is an estimate of the average number of years babies born this year would live in a state of ‘good’ general health if mortality levels at each age, and the level of good health at each age, remain constant in the future. Similarly, healthy life expectancy at age 65 is the average number of remaining years a man or woman aged 65 will live in ‘good general health’ if mortality levels and the level of good health at each age beyond 65 remain constant in the future.
The healthy life expectancy measure adds a ‘quality of life’ dimension to estimates of life expectancy by dividing it into time spent in different states of health. Health status estimates are based on the following survey question; ‘How is your health in general; would you say it was… very good, good, fair, bad, or very bad’. If a respondent answered ‘very good’ or ‘good’ they were classified as having ‘good’ health. Those who answered ‘fair’, ‘bad’, or ‘very bad’ were classified as having ‘not good’ health and equate to those in ’poor’ health in this chapter.
Years spent in poor health
The average number of years lived in poor health is the average life expectancy minus the average number of years lived in good health (healthy life expectancy). An increase in the average number of years lived in poor health is often referred to as ‘expansion of morbidity’, whereas a reduction is referred to as ‘compression of morbidity’ [footnote 5].
7. Data notes
Short time trends
The trends presented in this chapter cover a relatively short time period. Consistent data for healthy life expectancy is only available for the period 2000 to 2002 to 2012 to 2014; just over 10 years. A short time frame limits the strength of any conclusions that can be made as indicators giving a summary picture of population health tend to show small changes over a single decade.
Further issues with health status data
There are known limitations to data on self-assessed health status. We know that people give subjective answers to the question used to determine health status. Responses are influenced by an individual’s expectations and there are measurable differences across socio-demographic factors such as age, sex, and deprivation.
There is also likely to be a bias arising from the way respondents are selected to take part in the survey. The data are based on surveys that are not able to select people to interview who are living in institutional accommodation (for example, care homes). This may lead to an underestimate of the level of poor health.
8. References
-
Griffiths, C and Brock, A (2003) Twentieth-century mortality trends in England and Wales. Health Statistics Quarterly 18, 5-17. ↩
-
ONS (2016) Estimates of the very old (including centenarians), UK: 2002 to 2015. Office for National Statistics Accessed 18 June 2017. ↩
-
Howse, K (2006) Increasing life expectancy and the compression of morbidity: A critical review of the debate. Oxford Institute of Aging Working Paper Number 206. Oxford: Oxford Institute of Ageing. ↩
-
Jagger C (2015) Trends in life expectancy and healthy life expectancy. Future of an ageing population project: evidence review. London: Foresight, UK Government Office for Science; 2015. 1–29 ↩
-
Fries JF (1980) Ageing, natural death, and the compression of morbidity. N Engl J Medicine 303(3):130-5. ↩